Equity Futures Premiums by Contract
S&P 500 E-mini futures trade at 7714.5 which sits 37.7 points above the cash index at 7676.8 and therefore generates positive basis that supports carry into expiry because the premium reflects front-month positioning. Nasdaq 100 E-mini futures at 29467.5 stand 194 points above the cash index at 29273.4 which marks the widest premium among equity contracts and signals stronger front-month conviction in higher-beta names. Dow E-mini futures at 52528.0 sit 166.4 points above cash at 52361.6 which adds further breadth to the positive basis picture. Russell 2000 E-mini futures at 2795.0 hold an 8.6 point premium over cash at 2786.4 which shows the basis steepens with index beta as larger contracts command wider premiums.
Implied Carry and Real-Money Signals
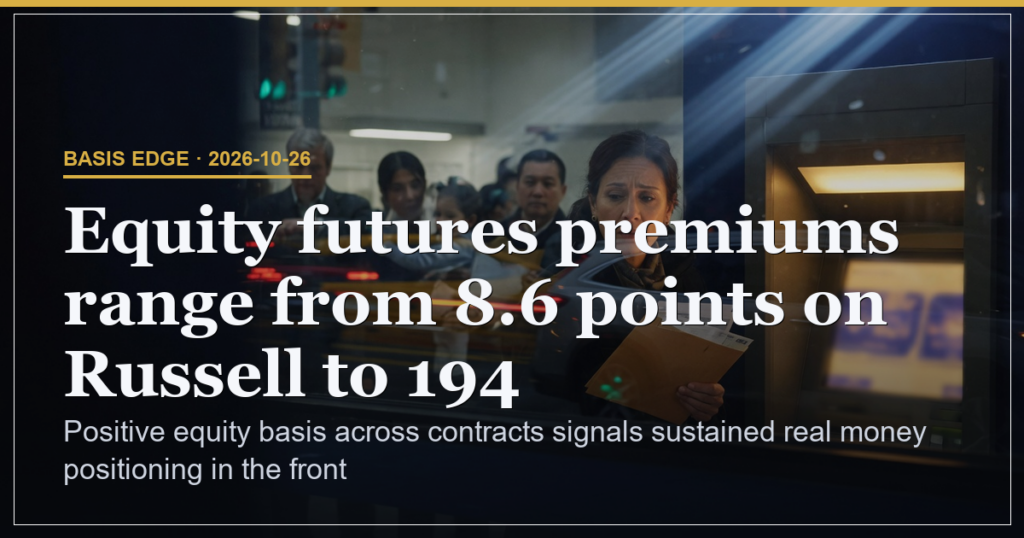
The 37.7 point S&P premium combined with the 194 point Nasdaq premium means positive carry accrues to holders of futures versus cash because the structure rewards rolling exposure into expiry. Equity futures premiums range from 8.6 points on Russell to 194 on Nasdaq which means basis steepens with index beta and therefore higher-beta contracts embed stronger conviction on the session. No term structure data beyond front month is provided so further curve analysis cannot be completed.
| Contract | Premium (points) | Implication |
|---|---|---|
| S&P 500 E-mini | 37.7 | Positive basis supports carry into expiry |
| Nasdaq 100 E-mini | 194 | Widest premium signals front-month conviction |
| Russell 2000 E-mini | 8.6 | Steepens with lower beta exposure |
Cash Index Levels and Structure
S&P cash holds support at 7639.7 and faces resistance at 7702.1 which means a break above resistance would extend the positive basis into the next session because price would clear the prior high. Nasdaq cash holds 29011.9 support which aligns with the 194 point futures premium and therefore keeps the term structure anchored to higher-beta leadership. Crude at 101.25 and gold at 4031.0 show mixed commodity signals that do not alter the equity basis read.
Cross-Asset Context and Positioning Alignment
Positioning Pressure shows call heavy whale flow concentrated in NVDA plus put call ratio of 0.782 supports bullish options positioning which aligns with the positive equity basis across contracts. Ten-year note futures at 106.0938 register a modest 0.06 percent decline which means fixed-income tone remains neutral and does not counteract the equity premium structure. Volatility at 18.39 below the 19.39 five-day average signals subsiding stress and therefore a calmer tape that sustains basis carry.
| Metric | Value | Meaning |
|---|---|---|
| S&P cash support | 7639.7 | Level that would compress basis if breached |
| Nasdaq cash support | 29011.9 | Anchor for 194 point premium |
| Volatility level | 18.39 | Below average supports carry stability |
Scenario Triggers and Working Odds
A close above 7702.1 resistance carries 40 percent odds because that level would validate the 37.7 point S&P premium and extend carry. A hold between 7639.7 and 7702.1 carries 35 percent odds because the current 37.7 point basis would persist without directional expansion. A break below 7639.7 carries 25 percent odds because that move would compress the entire equity premium structure and shift term structure toward discount.
Risk and Experience Watchpoints
Risk stands at 28 percent driven by the absence of term structure data beyond front month which leaves the curve slope unconfirmed.
| Level | Watch on Tape |
|---|---|
| Beginner | Track how futures premiums move with cash index closes each session |
| Intermediate | Compare premium width across beta tiers to gauge conviction strength |
| Advanced | Monitor basis reaction at 7702.1 and 7639.7 for curve slope shifts |
Positive equity basis across contracts signals sustained real money positioning in the front month.
This is analysis, not financial advice. Always manage your risk.