Microsoft (MSFT) – Daily Read
10 October 2026 | Stock | Titan Macro Desk
$535.07
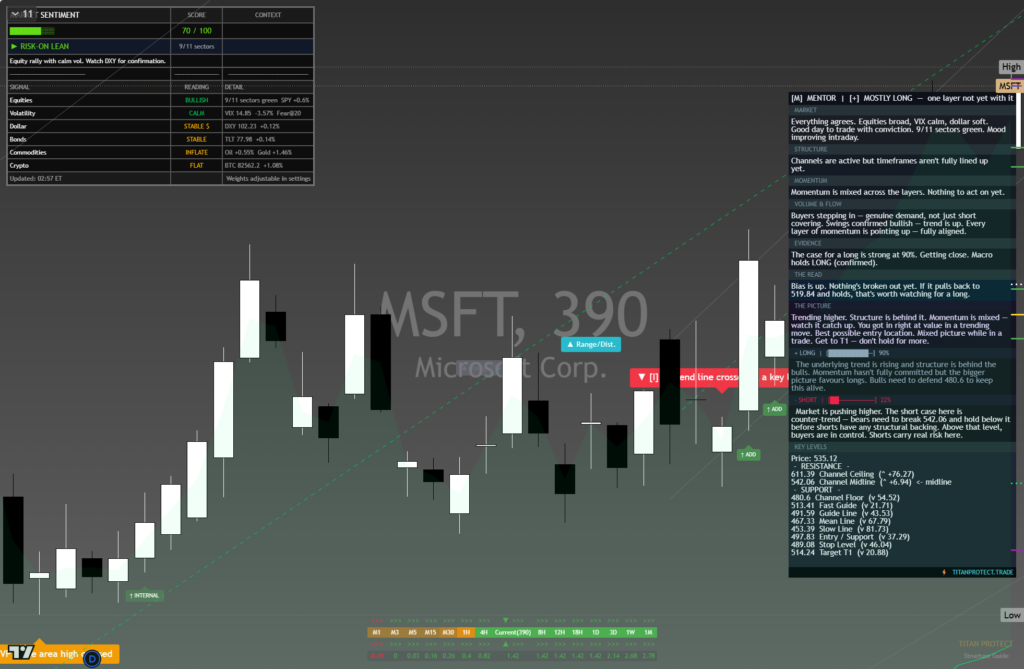
Microsoft is testing the ceiling of its recent range, and the balance of evidence favors continuation rather than immediate exhaustion. The last price is $535.07, 2.4 percent higher on the day, leaving the stock pressing the top of its one-month range. That matters because strength near a range boundary shows buyers are willing to maintain exposure at demanding prices. The clear view is constructive while the stock holds its nearby handles, but conviction should increase only when the market proves it can convert the range ceiling into support.
The macro backdrop remains important because Microsoft sits at the intersection of durable growth, enterprise spending, cloud demand, and enthusiasm around artificial intelligence. Its scale and recurring revenue profile can attract capital when investors want growth with perceived resilience, while its valuation sensitivity can become a liability when risk appetite weakens or expectations are questioned. The immediate catalyst is therefore the price response to sustained demand rather than a single headline. Momentum is roughly 3.7 percent up over the last two weeks, while the one month average is $509.52. Price is above it, and the structure reads as a clean uptrend, with price above both its one-month and longer averages. That alignment suggests dips are still being treated as opportunities rather than warnings.
The month swing high at $537.22 is about 0.4 percent above the current price, making it the immediate decision point. It represents the level where recent buying previously stopped, so a close and hold above it would show that available supply has been absorbed. The nearer round number handle at $540.00 is the next psychological test, where profit-taking and fresh breakout demand could collide. The $530.00 handle is the first practical defense beneath the market. Holding it would preserve the sense of controlled pressure against the highs, while losing it would suggest the breakout attempt is becoming less orderly. Beneath that, the shelf of support at $486.00, about 9.2 percent below, is the more important structural defense. The three month range is $355.43 to $537.22, which highlights both the scale of the advance and the thin margin for hesitation at the upper boundary.
The bull path is straightforward: if buyers deliver a decisive move above $537.22, then the path opens toward $540.00. If that move holds and pullbacks remain supported above the former ceiling, then the market can begin treating the breakout as accepted rather than speculative. The bear path begins if rejection near the high pushes price below $530.00. If selling then deepens and $486.00 is lost, that would expose $355.43 and signal that the broader advance has suffered a serious structural failure.
The main risk is a failed breakout caused by weaker equity appetite, concern over growth expectations, or an adverse reassessment of technology valuations. The constructive read is invalidated by sustained trade below $486.00, not by routine hesitation near the highs. Net, Microsoft remains bullish but tactically stretched: buyers have control, although $537.22 must break cleanly before the next leg deserves full confidence.
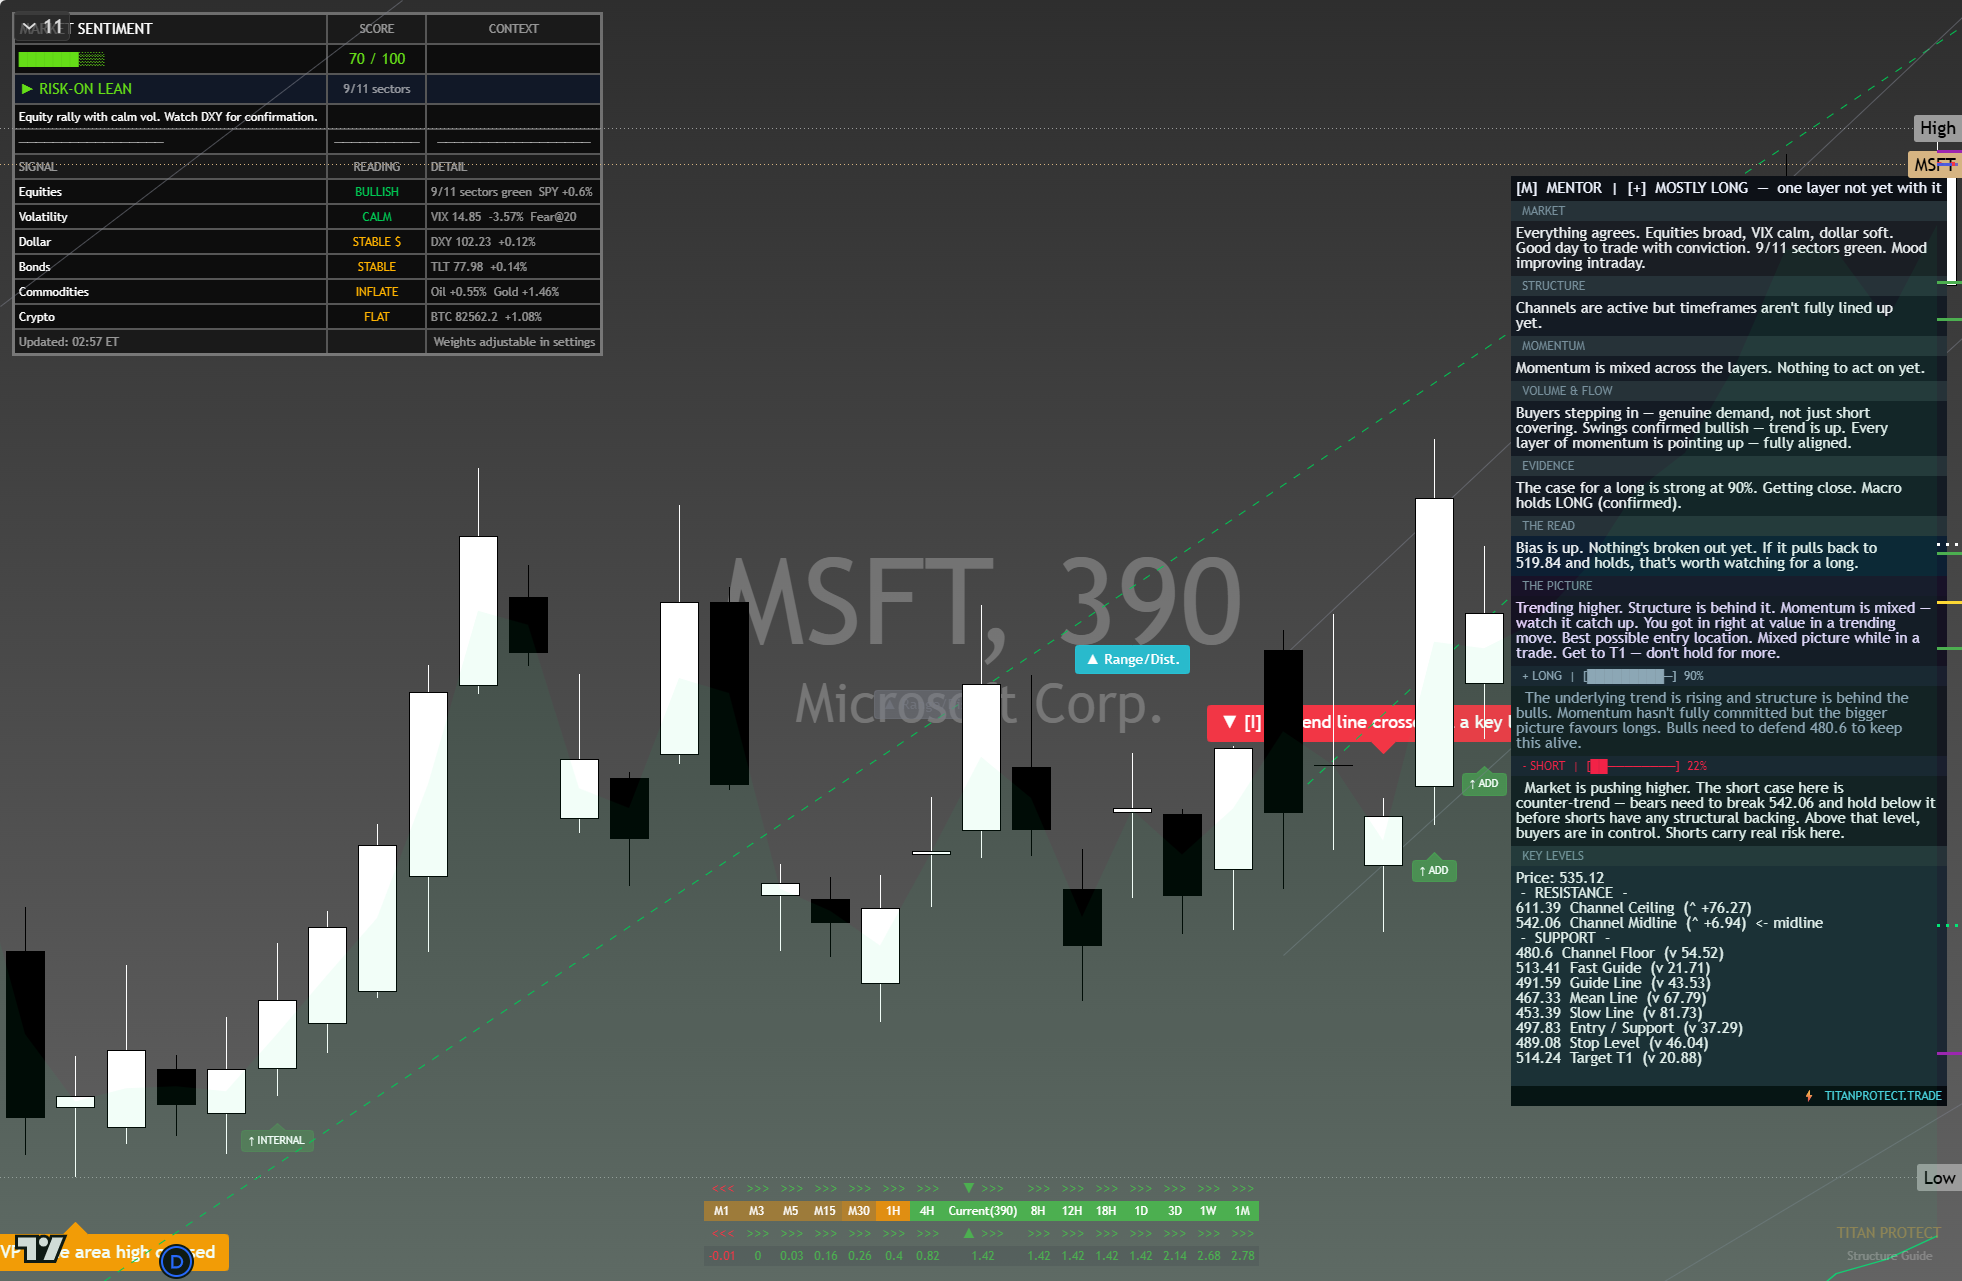
The chart above is the full daily read: structure, momentum, the levels that matter, and where the current price sits against them. Read it top to bottom for the complete picture, and pair it with our session briefs for the wider market context.
This is analysis, not financial advice. It reflects our multi-factor framework and is not a recommendation to buy or sell. Always do your own research and manage your risk.