[TP] Relative Strength - Mentor
Example read, NVDA daily vs QQQ, closes to 29 Oct 2026 (our design check)Down, moderate. NVDA is about 3.3% behind QQQ this month, though still about 2.4% ahead over three months. About $221 would erase the month's lag; the July low near $209 is the next level down.
Wrong if: a close above about $221, with QQQ where it closed.
Is a stock leading its market or lagging it? This reads relative strength against a fair benchmark and says it in plain words: over one, three and six months, whether the lead is growing or fading, and the price that would change the read.
A stock can rise and still fall behind its market, or drop less than everything around it. The raw ratio line most tools draw is hard to read. This one shows how far ahead or behind the stock is since a clear start, with zero as level, and writes the read on a card.
On TradingView from 18 Nov (members)
For members on TradingView from 18 Nov. Leave your email and we will tell you the day it is out.
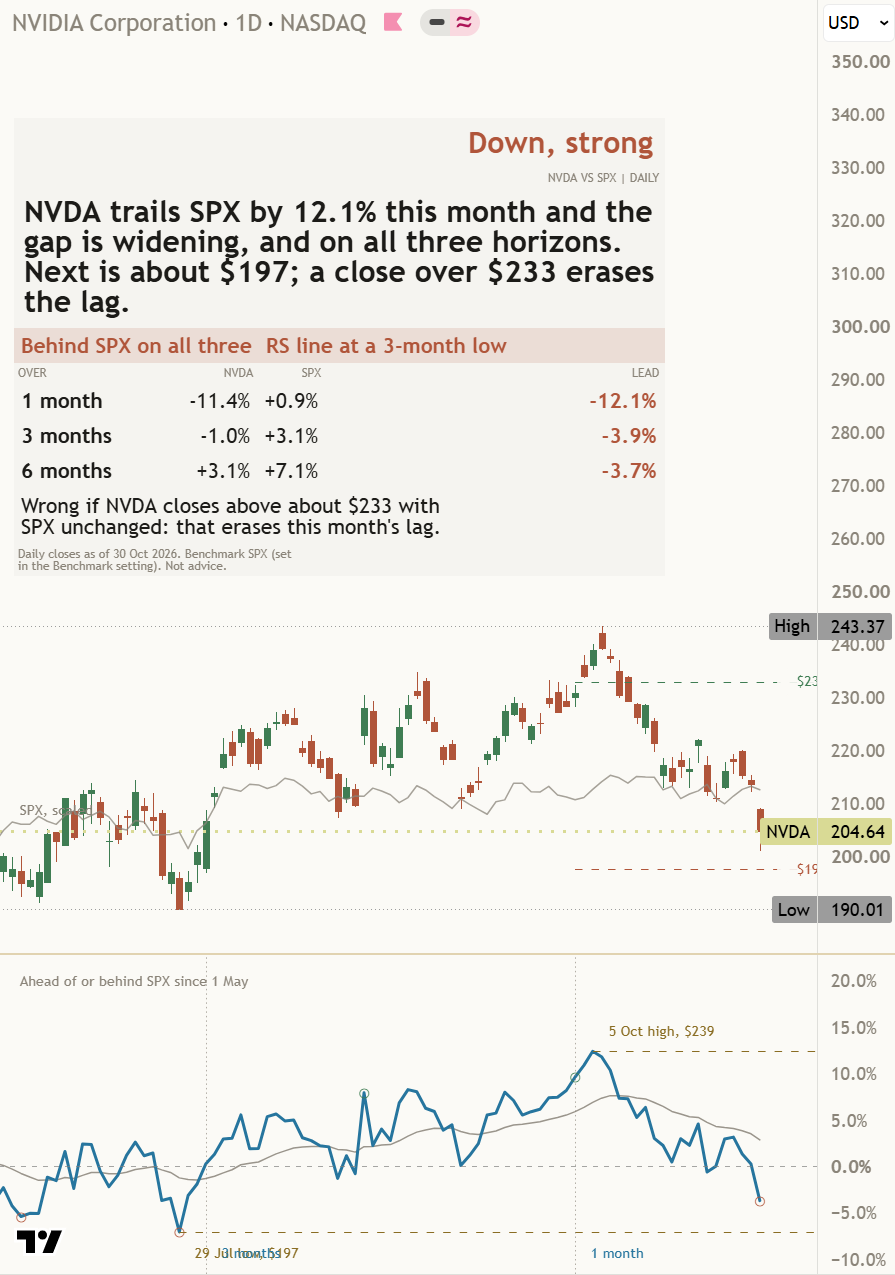
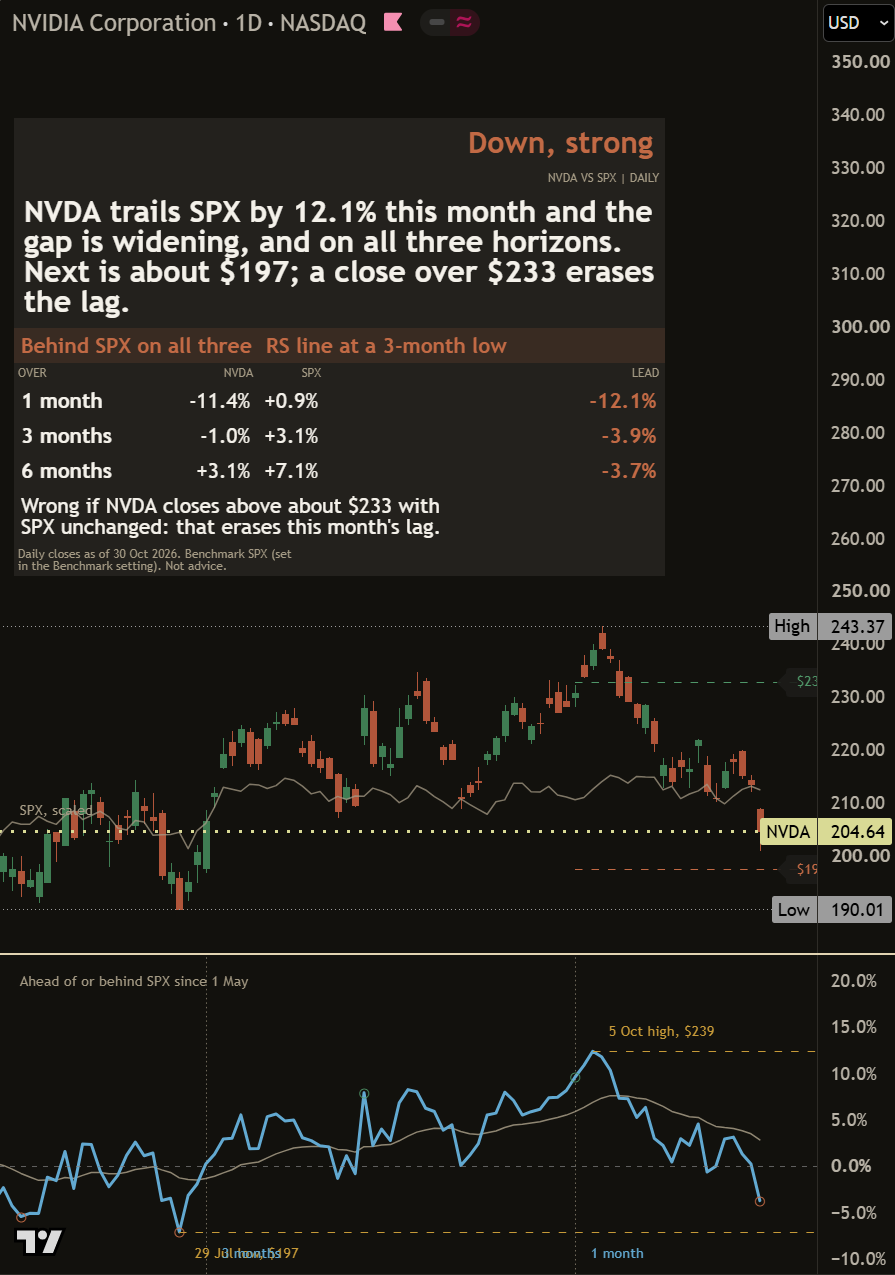
What you see on the chart
Every part of the indicator, in the order you will meet it.
- The readUp, Down or Sideways with a strength, at the top of the card. It changes only after two closes agree.
- The headlineUp to four lines in plain words: why the read is what it is, the price that matters next, and what would change it.
- The 1, 3 and 6 month rowsHow the stock moved, how the benchmark moved, and the lead between them, for each horizon.
- The sector rowsThe same lead against the stock's sector fund, for US-listed stocks, such as chip stocks for NVIDIA.
- The RS line paneA lower pane showing how far the stock is ahead of or behind its benchmark since the pane start. Zero means level.
- RingsA mark on the line at a new three-month high or low. A filled ring means the line got there before price did.
- Price levelsDashed lines on the price chart for the price that would erase this month's lead or lag, assuming the benchmark stays where it closed.
- Wrong ifThe close that would prove the read wrong, always on the card.
What it is in 30 seconds
It answers one question: is this stock doing better or worse than the market it belongs to? It is not the RSI, and it does not say where price goes next.
Against what
It picks a fair benchmark by itself: QQQ for US-listed tech, SPY for other US stocks, and the home index for other markets. You can set your own.
Over how long
One, three and six months side by side, so you can see whether a lead is growing, holding or fading.
What would change it
Every read names a price, worked out with the benchmark held where it closed, so you know what the stock would need to do.
How the read is made
Four pieces of this chart's own evidence vote. Nothing comes from outside the chart.
The one-month lead
Ahead or behind the benchmark over the last month, by more than half a percent.
The three-month lead
Ahead or behind over three months, by more than one percent.
The line against its average
Whether the RS line sits above or below its own one-month average.
The trend of the lead
Whether this month's lead is bigger or smaller than it was two weeks ago.
When one side has at least two more votes, the read is Up or Down. Four agreeing pieces make it strong, three moderate, two or fewer slight. If the votes are close, a one-month lead of 1.5% or more decides it; otherwise the read is Sideways. A change waits for two closes, and the card says "May turn" while it waits.
On this chart
The card looks back at earlier times this pair was in the same state, such as a new three-month high in the line, at least a month apart. It says in words what the line did a month later in those cases. When there are fewer than eight past cases, it says there are too few to count. All of it comes from the closes on your chart, so it describes this pair's past, not a forecast.
Honest about the data, honest about limits
Every read uses closed candles. On intraday charts it reads completed daily closes and says so on the card, so the read does not move while a candle is forming.
Dollar levels assume the benchmark stays at its last close. If the benchmark moves, the level moves with it, and the hover text says so.
The sector row covers US-listed stocks only. Funds, indexes, CFDs and crypto get no sector row.
A rank in a named basket, such as 3rd of 12 sector funds. It is not a market-wide rating.
Settings
The defaults work out of the box. These are the ones worth knowing.
| Setting | What it does | Default |
|---|---|---|
| Benchmark / Sector fund | Auto picks a fair benchmark and sector fund. Type any symbol to use your own. | Auto; Auto |
| Peer rank basket | Sector funds, Mega caps, World markets, your own list, or Off. | Sector funds |
| Pane starts / Average length | Where the RS line pane starts, and the length of its average (0 means one month). | Auto; 0 |
| Rings / RS levels / Horizon starts | New three-month highs and lows, the levels that matter, and where each horizon begins. | On; On; On |
| Benchmark on price / Dollar levels | A faint scaled benchmark line on the price chart, and the price levels in dollars. | On; On |
| Panel detail / text size / position | Full or Compact card, four text sizes, nine positions. | Full; Small; Bottom Right |
| Theme / Line width | Auto follows the chart background (Paper or Ink); rows wrap at 44 characters for phones. | Auto; 44 |
Every setting has a small (i) next to it that explains it in plain words on your chart. If candles draw over the card, right-click the indicator, then Visual order, then Bring to front.
Learn more
Momentum investing
Why trends persist, how relative strength works and why rules-based exits matter. Free.
Open the lesson The Titan suiteOne angle here, the rest of the picture there
Every indicator page, the free Mentors and the member versions, in one place, each read in the same plain-English voice.
See all indicatorsQuestions
Is this the RSI?
No. The RSI compares a market with its own recent moves. Relative strength compares a stock with its benchmark, such as NVIDIA against QQQ.
How do I get it?
It is for members on TradingView from 18 November 2026. Leave your email at the top of this page and we will tell you the day it is out.
Does it repaint?
No. Reads, rings and levels are set on closed candles and do not change afterwards.
Which markets does it work on?
US stocks and funds, index CFDs and futures, crypto, and the main markets in India, the UK, Hong Kong, Japan, Germany and Australia. Elsewhere, set the benchmark yourself.
Which timeframes?
All of them. Daily, weekly and monthly charts read their own candles; intraday charts read completed daily closes and say so on the card.
Does it tell me when to act?
No. It tells you whether a stock is ahead of or behind its market, how that is changing and the price that would change the read. Decisions stay with you.