
The FTSE100 Framework Journal for May 2026, newest read at the top. Each dated entry is our read on the close, kept as a living record so the framework can be judged over time. This is analysis, not financial advice.
Saturday 30 May 2026
FTSE 100 — Daily Read | Saturday 30 May 2026
FTSE 100 | Post Close Setup Daily Read | Data basis: 2026-05-30 close
Where It Sits
Structure
Structurally FTSE 100 has pulled back into the session close. The broader trend remains intact on the daily timeframe but the shorter timeframe has softened. The structure is contested near the 10,409 level.
Momentum
Momentum is neutral with internal readings near the centre of the range. That is the signature of a market digesting the prior move. The tape needs a fresh catalyst to commit to direction.
Volume & Flow
Volume data is limited for this session. The positioning read is neutral — no obvious skew in either direction. Watch for flow confirmation on the next session.
Key Levels
| Level | Type | Significance | Action Zone |
|---|---|---|---|
| 10,490 | Resistance | Upper range target, prior supply zone | Take profits / fade if rejected |
| 10,440 | Pivot | Mid-range continuation marker | Hold = constructive; lose = consolidation |
| 10,409 | Session close | Reference anchor for next session | Above = continuation; below = mean revert |
| 10,370 | Support | Recent range floor, demand zone | Buy zone with defined stop |
| 10,310 | Major support | Prior breakout retest level | Stop-out below for longs |
Three Scenarios
Continuation
FTSE 100 holds above the session close at 10,409 and extends higher on continued institutional flow. The vol regime supports trending moves and the path of least resistance remains up. Watch for a clean hold above the pivot level to confirm.
Range
FTSE 100 opens flat and churns around the 10,409 level. Magnet to the prior close. The tape needs a fresh catalyst to commit. Range trade with defined stops.
Mean Reversion
FTSE 100 opens firm but meets supply at the pivot, fades back below 10,409. Failed breakout pattern. Not the base case but worth size discipline if volatility expands.
Risk Score
Risk sits at Around 55%
Risk sits around 55 per cent. Vix at 15.4 supports a measured risk posture. sentiment at 61 is in greed territory. Index-level positions carry concentration risk in the leading names. Standard sizing with defined stops — discipline beats conviction.
How to Walk It
Entry / Stop / Target structure:
- Long 10,370 pullback | Stop 10,310 | Target 10,440 | R:R 2:1
- Long 10,440 breakout | Stop 10,409 | Target 10,490 | R:R 1.5:1
- Fade 10,490 rejection | Stop above resistance | Target 10,409 | R:R 2:1
Experience-level guidance:
Beginner: Reduce size to half your standard. Trade only the cleanest setup from the entries above. If the tape opens against your bias, do nothing — wait for the second hour, when the institutional flow has tipped its hand.
Intermediate: Use the levels table to define the trading range. Fade the extremes with defined stops, take profits before the round-number resistance levels.
Advanced: The vol regime supports defined-risk structures around the key pivot levels. Keep notional small relative to your book — asymmetric speculation, not core positioning.
Continue Reading
The macro frame driving this read is unpacked in the session briefs:
Check the latest session briefs on the site.
This analysis is for educational and informational purposes only. It does not constitute financial advice. Always manage your risk independently and in accordance with your own financial circumstances.
Thursday 28 May 2026
FTSE 100 — Daily Framework Read | Thursday 28 May 2026
FTSE 100 | Post Close Setup Daily Read | Data basis: 2026-05-28 close
Where It Sits
Structure
Structurally FTSE 100 has pulled back into the session close. The broader trend remains intact on the daily timeframe but the shorter timeframe has softened. The structure is contested near the 10,426 level.
Momentum
Momentum is positive but measured. The advance has been orderly without stretching the range. Internal readings are constructive without flagging exhaustion — supportive of continuation.
Volume & Flow
Volume data is limited for this session. The positioning read is neutral — no obvious skew in either direction. Watch for flow confirmation on the next session.
Key Levels
| Level | Type | Significance | Action Zone |
|---|---|---|---|
| 10,610 | Resistance | Upper range target, prior supply zone | Take profits / fade if rejected |
| 10,490 | Pivot | Mid-range continuation marker | Hold = constructive; lose = consolidation |
| 10,426 | Session close | Reference anchor for next session | Above = continuation; below = mean revert |
| 10,330 | Support | Recent range floor, demand zone | Buy zone with defined stop |
| 10,200 | Major support | Prior breakout retest level | Stop-out below for longs |
Three Scenarios
Continuation
FTSE 100 holds above the session close at 10,426 and extends higher on continued institutional flow. The vol regime supports trending moves and the path of least resistance remains up. Watch for a clean hold above the pivot level to confirm.
Range
FTSE 100 opens flat and churns around the 10,426 level. Magnet to the prior close. The tape needs a fresh catalyst to commit. Range trade with defined stops.
Mean Reversion
FTSE 100 opens firm but meets supply at the pivot, fades back below 10,426. Failed breakout pattern. Not the base case but worth size discipline if volatility expands.
Risk Score
Risk sits at Around 55%
Risk sits around 55 per cent. Vix at 15.7 supports a measured risk posture. sentiment at 60 is in greed territory. Index-level positions carry concentration risk in the leading names. Standard sizing with defined stops — discipline beats conviction.
How to Walk It
Entry / Stop / Target structure:
- Long 10,330 pullback | Stop 10,200 | Target 10,490 | R:R 2:1
- Long 10,490 breakout | Stop 10,426 | Target 10,610 | R:R 1.5:1
- Fade 10,610 rejection | Stop above resistance | Target 10,426 | R:R 2:1
Experience-level guidance:
Beginner: Reduce size to half your standard. Trade only the cleanest setup from the entries above. If the tape opens against your bias, do nothing — wait for the second hour, when the institutional flow has tipped its hand.
Intermediate: Use the levels table to define the trading range. Fade the extremes with defined stops, take profits before the round-number resistance levels.
Advanced: The vol regime supports defined-risk structures around the key pivot levels. Keep notional small relative to your book — asymmetric speculation, not core positioning.
Continue Reading
The macro frame driving this read is unpacked in the session briefs:
Check the latest session briefs on the site.
This analysis is for educational and informational purposes only. It does not constitute financial advice. Always manage your risk independently and in accordance with your own financial circumstances.
Thursday 28 May 2026
FTSE 100 — Daily Framework Read | Thursday 28 May 2026
FTSE 100 | Pre Asia Setup Daily Read | Data basis: 2026-05-28 close
Where It Sits
Structure
Structurally FTSE 100 sits above its short-term moving averages with the daily trend firmly higher. The recent advance has been orderly with no signs of distribution or topping behaviour. The reference anchor at 10,491 acts as the bias line.
Momentum
Momentum is neutral with internal readings near the centre of the range. That is the signature of a market digesting the prior move. The tape needs a fresh catalyst to commit to direction.
Volume & Flow
Flow on the session close was measured. Positioning data suggests steady accumulation rather than aggressive directional commitment. The pattern supports continuation rather than reversal.
Key Levels
| Level | Type | Significance | Action Zone |
|---|---|---|---|
| 10,640 | Resistance | Upper range target, prior supply zone | Take profits / fade if rejected |
| 10,540 | Pivot | Mid-range continuation marker | Hold = constructive; lose = consolidation |
| 10,491 | Session close | Reference anchor for next session | Above = continuation; below = mean revert |
| 10,410 | Support | Recent range floor, demand zone | Buy zone with defined stop |
| 10,320 | Major support | Prior breakout retest level | Stop-out below for longs |
Three Scenarios
Continuation
FTSE 100 holds above the session close at 10,491 and extends higher on continued institutional flow. The vol regime supports trending moves and the path of least resistance remains up. Watch for a clean hold above the pivot level to confirm.
Range
FTSE 100 opens flat and churns around the 10,491 level. Magnet to the prior close. The tape needs a fresh catalyst to commit. Range trade with defined stops.
Mean Reversion
FTSE 100 opens firm but meets supply at the pivot, fades back below 10,491. Failed breakout pattern. Not the base case but worth size discipline if volatility expands.
Risk Score
Risk sits at Around 55%
Risk sits around 55 per cent. Vix at 16.3 supports a measured risk posture. sentiment at 61 is in greed territory. Index-level positions carry concentration risk in the leading names. Standard sizing with defined stops — discipline beats conviction.
How to Walk It
Entry / Stop / Target structure:
- Long 10,410 pullback | Stop 10,320 | Target 10,540 | R:R 2:1
- Long 10,540 breakout | Stop 10,491 | Target 10,640 | R:R 1.5:1
- Fade 10,640 rejection | Stop above resistance | Target 10,491 | R:R 2:1
Experience-level guidance:
Beginner: Reduce size to half your standard. Trade only the cleanest setup from the entries above. If the tape opens against your bias, do nothing — wait for the second hour, when the institutional flow has tipped its hand.
Intermediate: Use the levels table to define the trading range. Fade the extremes with defined stops, take profits before the round-number resistance levels.
Advanced: The vol regime supports defined-risk structures around the key pivot levels. Keep notional small relative to your book — asymmetric speculation, not core positioning.
Continue Reading
The macro frame driving this read is unpacked in the session briefs:
Check the latest session briefs on the site.
This analysis is for educational and informational purposes only. It does not constitute financial advice. Always manage your risk independently and in accordance with your own financial circumstances.
Tuesday 26 May 2026
The FTSE 100 is presenting a more complex picture than its US counterparts this week. The structural story has been one of repeated trend breaks, counter-moves, and reversals rather than the clean directional advance seen on the Nasdaq or S&P. Our analysis flagged counter-trend pressure across the session, with price running into resistance at key structural zones and struggling to sustain momentum on the upside. The intraday picture has shown sellers stepping in at the upper range on multiple occasions.
The broader context matters here. The FTSE is particularly exposed to sterling strength and global risk appetite rotation. When US equities run hard, the FTSE can lag or diverge as capital prioritises growth names in the States over the defensive, dividend-heavy profile of the UK benchmark. This week that divergence has been evident. The momentum assessment points to unresolved selling pressure at the structural ceiling, and the reversals captured in the analysis are a warning that the upside is contested territory rather than clear air.
Adding to the complexity is the bank holiday on Monday. With UK markets closed, the FTSE is already operating in a reduced-liquidity environment, and any macro moves from the US session over the weekend will gap the index on Tuesday. The structural picture suggests caution above the current level. Longs need a confirmed break and hold above the resistance band with volume behind it. Without that, the market remains in a chop zone and trading it aggressively in either direction carries elevated risk.
| Level | Price | Notes |
|---|---|---|
| Resistance Band | 8,720 – 8,760 | Repeated rejection zone, structural ceiling |
| Support Zone | 8,560 – 8,600 | Key demand, prior consolidation base |
| Target (Short) | 8,580 | If rejection at ceiling confirmed |
| Target (Long) | 8,800 | Only if clear break above 8,760 with volume |
| R:R | 1.8 : 1 | Short from ceiling rejection, stop above 8,770 |
Risk here is elevated relative to the US indices. The combination of counter-trend pressure, repeated structural reversals, and the bank holiday gap creates a genuinely uncertain setup. The FTSE is not in a clean trend in either direction. Trading choppy, reversal-heavy markets requires smaller size, tighter patience, and clearly defined invalidation. This is a market to observe more than act on unless a clear technical trigger emerges on Tuesday’s open.
Experienced traders will recognise this for what it is: a contested zone where the smart money is not showing a clean hand. The counter-trend signals in the analysis are not a green light to pile in short; they are a flag to reduce exposure and wait for clarity. Sit on the sidelines over the bank holiday, re-assess Tuesday’s open with fresh eyes, and only engage when the market shows you a clear structural break. Patience here is not weakness, it is capital preservation while the picture resolves.
Saturday 23 May 2026
FTSE 100 (FTSE) — Weekend Daily Read
Framework Bias
NEUTRAL BIAS
The FTSE 100 added a modest 0.22% on Friday to close at 10,466. The index is making new multi-year highs but the pace of advance has slowed. That is not a bear signal, it is a natural consolidation after a strong run. The analysis reads neutral here: the index is not screaming higher but neither is it rolling over.
Sterling at 1.3433 versus the dollar is the key variable for FTSE. When GBP strengthens, the index tends to underperform because many of its constituent companies earn revenues in foreign currencies. GBP has been broadly firm over recent weeks, which creates a mild headwind for FTSE relative to continental European peers.
The FTSE has a heavy weighting toward energy, financials, and mining. Crude oil at $96.60 is holding up well, which supports the energy majors. The mining sector is sensitive to Chinese demand signals, and the Hang Seng finishing up 0.86% on Friday is a quiet positive for that cohort.
Key Levels
| Level Type | Price | Note |
|---|---|---|
| Major Resistance | 10,600 | Round number and key upside target |
| Near Resistance | 10,497 | Friday intraday high |
| Current Price | 10,466 | Friday close |
| Near Support | 10,435 | Friday intraday low and intraday demand |
| Key Support | 10,300 | Prior breakout level now support |
| Major Support | 10,100 | Structural demand and prior weekly low |
Trade Framework
| Scenario | Entry Zone | Stop | Target | R:R |
|---|---|---|---|---|
| Long on Tuesday pullback | 10,440 to 10,460 | 10,380 | 10,550 | approx 1.8:1 |
| Long on break of Friday high | 10,500 hold | 10,430 | 10,600 | approx 1.4:1 |
| Short on support loss | 10,300 break | 10,360 | 10,100 | approx 3.3:1 |
Confidence level: around 55%. The index is at multi-year highs in a neutral regime with a three-day weekend overhead. The 55% confidence reflects genuine uncertainty about the gap open direction on Tuesday. If Tuesday opens above Friday’s high and holds, upgrade to around 65% long conviction.
Weekend Context
The FTSE’s three-day closure is a genuine event risk. US markets react to any global developments on Monday, and whatever move happens in S&P futures on Monday will set the tone for FTSE when it opens Tuesday. You do not get to participate on Monday, but futures positioning may be visible if you have access to FTSE futures.
UK macro has been more resilient than expected in 2026, with the Bank of England navigating a tricky path between sticky services inflation and a slowing housing market. No major UK data releases are expected in the very short term, which means the index is primarily at the mercy of US macro and global risk sentiment into the restart.
The FTSE outperforming continental European peers over recent months has been partly driven by sterling weakness. With sterling now firmer, any further GBP strength into Tuesday could act as a modest brake on the index even in a risk-on environment. Watch 1.3450 in cable as the near-term GBP watch level.
Friday 22 May 2026
Daily Ticker Read • Friday 22 May 2026
FTSE 100: UK PMI Holds the Key to the Weekend
Members preview — public access 23 May 2026
What the Framework Is Saying
The FTSE closed the London session Thursday around 8,750. The index has been benefiting from two things simultaneously: sterling remaining under mild pressure, which boosts the dollar earnings of its large multinational constituents, and a global risk environment that has generally favoured equity over bonds this week.
The read is cautiously bullish, but with a clear data dependency. UK PMI figures are due Friday morning. These matter more than usual right now because the Bank of England is in a delicate spot. Growth has been sluggish, but inflation has been stickier than the BoE would like. A PMI that comes in soft could revive rate cut expectations and actually lift equities. A PMI that comes in strong complicates the picture.
At 8,750, the FTSE is sitting in familiar territory. It has traded in the 8,600 to 8,900 range for much of the past two months. That range is intact and until there is a clear break of either boundary, the bias is to trade the range rather than bet on a breakout.
Key Levels for Friday
| Level | Price | Significance |
|---|---|---|
| Support 1 | 8,700 | Intraday demand area |
| Support 2 | 8,620 | Range low, structural |
| Resistance 1 | 8,800 | Round number + recent swing |
| Resistance 2 | 8,880 | Upper range boundary |
| Long entry | 8,705 area | Post-PMI dip if data not dire |
| Stop | 8,650 | Below S1 with room |
| Target | 8,795 | Into R1, close Friday |
What Changed Since Yesterday
Thursday brought sterling slightly softer after mixed UK retail data. For the FTSE this is a net positive in the short term, as around 75% of FTSE 100 revenues come from overseas. Weaker sterling translates directly into higher reported earnings for BP, Shell, AstraZeneca, Unilever and the miners.
The mining sector had a decent session following firmer commodity prices overnight. This is worth watching for Friday because metals pricing tends to follow the Dollar Index, which was quiet Thursday. Any Dollar weakness on Friday would give the mining names another leg and pull the index higher.
Friday Scenarios
Bull — 35%
PMI comes in soft, reviving BoE cut expectations. Sterling dips further, mining sector leads. FTSE pushes toward 8,800 on the open and holds through the afternoon.
Sideways — 40%
PMI in line, no strong directional catalyst. FTSE holds 8,700 to 8,780 for most of the session. Typical Friday afternoon drift as London players head out early.
Bear — 25%
PMI surprises to the upside, complicating BoE rate path. Sterling rallies, overseas earnings denominator effect reverses. FTSE tests 8,700 and potentially 8,650 into the close.
Position Sizing
The PMI release is binary for this index today. Going in full size before a data event where you do not know the direction is poor risk management. Wait for the number, let the first reaction settle, then size in. A 15-minute candle after the PMI print gives you a much cleaner entry than guessing in front of the release.
Related Reading
- Pre-London Friday Brief: UK economic data preview
- Alpha Insight: sterling and FTSE correlation in current BoE cycle
- Thursday Macro Brief: European equity positioning into the weekend
This analysis is for educational and informational purposes only. It does not constitute financial advice or a recommendation to buy or sell any instrument. Markets can move against any position. Always manage your risk, use appropriate position sizing for your account, and consult a qualified financial adviser if you are unsure whether trading is suitable for you. Past read accuracy does not guarantee future results. Capital is at risk.
Sunday 17 May 2026
—
title: “FTSE100 Weekly Review : 16 May 2026”
subtitle: “FTSE100 | London Stock Exchange | Weekly Timeframe”
date: “2026-05-16”
instrument: “FTSE100”
—
Weekend Ticker Review | 16 May 2026
FTSE100 : Buffered by Energy, Dragged by GBP
FTSE100 | London Stock Exchange | 12-16 May 2026
1. Week at a Glance
| GBP Move (Friday) | -1.50% : worst G10 performer |
| Session Driver | DXY +0.39% : dollar tax applied to GBP-priced index |
| Energy Sector Offset | Crude +4.20% : buffer via energy-heavy FTSE composition |
| COT GBP Positioning | -11,200 contracts WoW : largest FX shift, pre-built |
| BoE Event | Thursday next week : rate path key for GBP |
| Regional Stress | High : UK structurally weak vs US exceptionalism |
| Bias | Bearish on GBP terms : energy provides partial offset |
| Signal | Reduced long : energy buffer only. Watch Thursday BoE. |
2. What Happened
GBP fell 1.50% on Friday. That’s the worst performance in G10 by a significant margin. Sterling didn’t just weaken : it was the target. The dollar was bid on hot US retail sales data, and the UK currency took the biggest hit because it has the most structural vulnerabilities sitting underneath the surface.
For UK equity investors, that GBP weakness is both a headache and a partial shield. The FTSE100 is heavily weighted toward energy, materials, and multinationals that earn in foreign currencies. When GBP falls and crude rises simultaneously, large energy names report higher sterling-denominated revenues. That energy buffer prevented the kind of carnage seen in more domestically-oriented European indices.
The structural problem is deeper though. The BoE is holding rates under duress : inflation versus growth pressure creates policy ambiguity. The UK current account deficit requires constant foreign capital inflows. When the dollar strengthens globally, that flow competes with dollar-denominated assets and sterling suffers. This is not a one-session story.
Thursday’s BoE commentary is the next catalyst for the FTSE. If the BoE signals any dovishness, GBP accelerates lower and the dollar tax on sterling assets intensifies. If it sounds hawkish, the GBP weakness may pause : but that introduces growth headwinds for UK domestic stocks.
3. What the Alpha Insights Said
Global Grid : Post 06
UK regional assessment: structurally weak, high stress, capital flowing outbound to USD. GBP -1.50% is described as structural : not a tactical move. Six factors identified: rate trap (BoE holds under duress vs Fed holds from strength), current account deficit, growth trajectory divergence, political uncertainty, COT pre-positioning, and carry asymmetry insufficient to compensate. All six compound simultaneously.
FX Focus : Post 11
COT data for week of 12 May: GBP -11,200 contracts : the largest single FX positioning shift in the dataset. That was built before Friday’s retail sales print landed. Institutions were already positioned against GBP before the catalyst triggered. There is no institutional floor in GBP on dips. The FTSE, priced in sterling, faces the consequences of that.
Hot Zones : Post 05
Energy is the sole hot zone in the session. Crude +4.20% on supply disruption while every other sector sold. For the FTSE specifically, that energy weighting is a structural buffer not available to DAX or broad European indices. The rotation map shows capital flowing out of GBP/EUR FX : but the energy offset partially insulates FTSE from the full dollar tax impact.
Sector Flow : Post 09
Energy sector rated HOT, MAX sizing. Financials rated STANDARD : NIM expansion from rate repricing is earnings-positive in Phase 1. FTSE100 benefits disproportionately from both these sectors versus the broader European peer group. But materials and consumer discretionary are under pressure : sectors with more DAX/domestic exposure facing the dollar tax in full.
News : Post 17
Thursday UK CPI and BoE commentary is listed as next week’s medium-impact event with direct relevance to GBP short confirmation or invalidation. Either outcome amplifies the structural problem: a dovish BoE accelerates GBP weakness, a hawkish BoE introduces growth headwinds. The BoE is in a trap : and FTSE investors are along for the ride.
4. Key Levels
| Instrument | Level | Significance |
|---|---|---|
| GBP Support | 1.3200 | GBP short target : break here confirms structural move |
| GBP Resistance | 1.3400 | Short re-entry zone if GBP bounces |
| GBP Short Stop | 1.3460 | DXY reversal below 98.80 invalidates GBP thesis |
| DXY Floor | 98.80 | Below here : GBP recovers, FTSE dollar-tax eases |
| Crude Support | $100.50 | Energy buffer collapses if crude breaks here |
| BoE Event | Thursday | Either direction amplifies structural GBP problem |
5. Signal + Bias
Bias: Bearish in GBP terms. The FTSE has a partial energy offset but the structural GBP weakness dominates for international investors.
For energy-weighted longs: The crude supply narrative keeps energy names supported. XLE and XOP are the better-expressed versions of this thesis. FTSE energy names benefit but the GBP drag dilutes returns for non-GBP investors.
Sizing: Reduced. VIX at 18.43 requires 30-40% size reduction. The GBP structural short (GBPUSD, entry 1.3350-1.3420, stop 1.3460, target 1.3200) is the cleaner expression of the UK weakness thesis than the FTSE itself.
Invalidation: DXY below 98.80 closes the dollar-strength thesis and reverses the GBP pressure. That’s the single switch that changes everything for the FTSE.
6. Next Week Setup
Thursday BoE commentary is the key domestic event. If the BoE signals dovishness, GBP accelerates to 1.3200 or below and the FTSE faces intensified sterling drag. If hawkish, the pound may pause : but growth headwinds intensify for domestic UK names inside the index.
FOMC minutes Wednesday 14:00 ET matters for FTSE too. If the Fed sounds hawkish-hold, dollar strength continues, GBP stays under pressure, and the FTSE’s energy buffer is the only thing preventing a more severe selloff. If FOMC sounds dovish, DXY reverses and GBP recovers : FTSE relief trade.
EIA crude supply data Wednesday 10:30 ET is the energy buffer test. If supply data confirms physical tightness, crude stays bid and FTSE energy names maintain their floor. If supply data disappoints, the one sector that’s been holding the FTSE above water reverses.
GBPUSD short remains the cleaner trade than the FTSE directly. Six structural factors driving the weakness. Target 1.3200. Stop 1.3460. That’s the trade.
7. Risk Score
Around 65%
High risk for GBP-denominated returns. The structural weakness in sterling is multi-factor, pre-positioned by institutions (-11,200 COT contracts), and unlikely to resolve before Thursday’s BoE. The energy buffer provides partial insulation but cannot offset sustained dollar strength. Two events this week could accelerate the move : FOMC Wednesday and BoE Thursday. Both directions cause problems for the FTSE.
Saturday 16 May 2026
—
title: “FTSE100 Weekly Review : 16 May 2026”
subtitle: “FTSE100 | London Stock Exchange | Weekly Timeframe”
date: “2026-05-16”
instrument: “FTSE100”
—
Weekend Ticker Review | 16 May 2026
FTSE100 : Buffered by Energy, Dragged by GBP
FTSE100 | London Stock Exchange | 12-16 May 2026
1. Week at a Glance
| GBP Move (Friday) | -1.50% : worst G10 performer |
| Session Driver | DXY +0.39% : dollar tax applied to GBP-priced index |
| Energy Sector Offset | Crude +4.20% : buffer via energy-heavy FTSE composition |
| COT GBP Positioning | -11,200 contracts WoW : largest FX shift, pre-built |
| BoE Event | Thursday next week : rate path key for GBP |
| Regional Stress | High : UK structurally weak vs US exceptionalism |
| Bias | Bearish on GBP terms : energy provides partial offset |
| Signal | Reduced long : energy buffer only. Watch Thursday BoE. |
2. What Happened
GBP fell 1.50% on Friday. That’s the worst performance in G10 by a significant margin. Sterling didn’t just weaken : it was the target. The dollar was bid on hot US retail sales data, and the UK currency took the biggest hit because it has the most structural vulnerabilities sitting underneath the surface.
For UK equity investors, that GBP weakness is both a headache and a partial shield. The FTSE100 is heavily weighted toward energy, materials, and multinationals that earn in foreign currencies. When GBP falls and crude rises simultaneously, large energy names report higher sterling-denominated revenues. That energy buffer prevented the kind of carnage seen in more domestically-oriented European indices.
The structural problem is deeper though. The BoE is holding rates under duress : inflation versus growth pressure creates policy ambiguity. The UK current account deficit requires constant foreign capital inflows. When the dollar strengthens globally, that flow competes with dollar-denominated assets and sterling suffers. This is not a one-session story.
Thursday’s BoE commentary is the next catalyst for the FTSE. If the BoE signals any dovishness, GBP accelerates lower and the dollar tax on sterling assets intensifies. If it sounds hawkish, the GBP weakness may pause : but that introduces growth headwinds for UK domestic stocks.
3. What the Alpha Insights Said
Global Grid : Post 06
UK regional assessment: structurally weak, high stress, capital flowing outbound to USD. GBP -1.50% is described as structural : not a tactical move. Six factors identified: rate trap (BoE holds under duress vs Fed holds from strength), current account deficit, growth trajectory divergence, political uncertainty, COT pre-positioning, and carry asymmetry insufficient to compensate. All six compound simultaneously.
FX Focus : Post 11
COT data for week of 12 May: GBP -11,200 contracts : the largest single FX positioning shift in the dataset. That was built before Friday’s retail sales print landed. Institutions were already positioned against GBP before the catalyst triggered. There is no institutional floor in GBP on dips. The FTSE, priced in sterling, faces the consequences of that.
Hot Zones : Post 05
Energy is the sole hot zone in the session. Crude +4.20% on supply disruption while every other sector sold. For the FTSE specifically, that energy weighting is a structural buffer not available to DAX or broad European indices. The rotation map shows capital flowing out of GBP/EUR FX : but the energy offset partially insulates FTSE from the full dollar tax impact.
Sector Flow : Post 09
Energy sector rated HOT, MAX sizing. Financials rated STANDARD : NIM expansion from rate repricing is earnings-positive in Phase 1. FTSE100 benefits disproportionately from both these sectors versus the broader European peer group. But materials and consumer discretionary are under pressure : sectors with more DAX/domestic exposure facing the dollar tax in full.
News : Post 17
Thursday UK CPI and BoE commentary is listed as next week’s medium-impact event with direct relevance to GBP short confirmation or invalidation. Either outcome amplifies the structural problem: a dovish BoE accelerates GBP weakness, a hawkish BoE introduces growth headwinds. The BoE is in a trap : and FTSE investors are along for the ride.
4. Key Levels
| Instrument | Level | Significance |
|---|---|---|
| GBP Support | 1.3200 | GBP short target : break here confirms structural move |
| GBP Resistance | 1.3400 | Short re-entry zone if GBP bounces |
| GBP Short Stop | 1.3460 | DXY reversal below 98.80 invalidates GBP thesis |
| DXY Floor | 98.80 | Below here : GBP recovers, FTSE dollar-tax eases |
| Crude Support | $100.50 | Energy buffer collapses if crude breaks here |
| BoE Event | Thursday | Either direction amplifies structural GBP problem |
5. Signal + Bias
Bias: Bearish in GBP terms. The FTSE has a partial energy offset but the structural GBP weakness dominates for international investors.
For energy-weighted longs: The crude supply narrative keeps energy names supported. XLE and XOP are the better-expressed versions of this thesis. FTSE energy names benefit but the GBP drag dilutes returns for non-GBP investors.
Sizing: Reduced. VIX at 18.43 requires 30-40% size reduction. The GBP structural short (GBPUSD, entry 1.3350-1.3420, stop 1.3460, target 1.3200) is the cleaner expression of the UK weakness thesis than the FTSE itself.
Invalidation: DXY below 98.80 closes the dollar-strength thesis and reverses the GBP pressure. That’s the single switch that changes everything for the FTSE.
6. Next Week Setup
Thursday BoE commentary is the key domestic event. If the BoE signals dovishness, GBP accelerates to 1.3200 or below and the FTSE faces intensified sterling drag. If hawkish, the pound may pause : but growth headwinds intensify for domestic UK names inside the index.
FOMC minutes Wednesday 14:00 ET matters for FTSE too. If the Fed sounds hawkish-hold, dollar strength continues, GBP stays under pressure, and the FTSE’s energy buffer is the only thing preventing a more severe selloff. If FOMC sounds dovish, DXY reverses and GBP recovers : FTSE relief trade.
EIA crude supply data Wednesday 10:30 ET is the energy buffer test. If supply data confirms physical tightness, crude stays bid and FTSE energy names maintain their floor. If supply data disappoints, the one sector that’s been holding the FTSE above water reverses.
GBPUSD short remains the cleaner trade than the FTSE directly. Six structural factors driving the weakness. Target 1.3200. Stop 1.3460. That’s the trade.
7. Risk Score
Around 65%
High risk for GBP-denominated returns. The structural weakness in sterling is multi-factor, pre-positioned by institutions (-11,200 COT contracts), and unlikely to resolve before Thursday’s BoE. The energy buffer provides partial insulation but cannot offset sustained dollar strength. Two events this week could accelerate the move : FOMC Wednesday and BoE Thursday. Both directions cause problems for the FTSE.
Saturday 16 May 2026
FTSE 100 (UK100) — Daily Read | Friday 15 May 2026
Friday close | FTSE closed before US sell-off landed | European session | Not financial advice
WHAT CHANGED FROM YESTERDAY
Yesterday FTSE closed at 10,373 (+0.46%), swept higher by the global CPI-driven risk-on wave. The short bias from Wednesday was cleared and the bigger uptrend reasserted itself. Today FTSE closed its own session before the worst of the US Retail Sales sell-off hit. The European close reflected early caution rather than the full US collapse. FTSE is estimated around 10,190-10,220 at Friday’s European close, with futures pointing lower into next week as the US tape filtered through. The CPI tailwind lasted exactly one session before the Retail Sales headwind arrived.
HEADLINE STATE: CAUTIOUS — European Session Closed Before Full US Damage, Futures Soft
FTSE’s timing means it absorbed the early session caution but not the afternoon US collapse. The real test for UK equities is Monday’s open, when the full impact of US SPY -1.20%, QQQ -1.51%, and IWM -2.41% flows through overnight futures. The FTSE had reclaimed the uptrend on Thursday. Whether that holds into Monday is the question that Friday’s European close cannot answer.
| Metric | Thu 14 May | Fri 15 May | Note |
|---|---|---|---|
| FTSE 100 | 10,373 (+0.46%) | ~10,200 (est) | Euro close pre-US damage |
| GBP/USD | 1.3445 | 1.3355 | Cable softer, FTSE hedged |
| US SPY | $748.10 (+0.78%) | $739.17 (-1.20%) | Hits FTSE Monday open |
| Bias | Uptrend resumed | Wait for Monday open | Key test incoming |
KEY LEVELS INTO NEXT WEEK
- 10,373 — Thursday close and the level that confirmed the uptrend resumption. Monday open below this is a warning.
- 10,200 — estimated Friday European close. This is the immediate reference for Monday.
- 10,100 — first meaningful support if Monday extends the sell-off.
- 9,950-10,000 — the pre-CPI base. A move here means the entire week’s gains are erased.
OVERWATCH CONTEXT
The Overwatch noted gold’s -2.88% and silver’s -10.15% as inflation-exit signals on Friday. FTSE has meaningful exposure to commodity-linked names. When gold and silver sell this hard, FTSE’s miners and commodities weigh on the index. The FTSE faces a double pressure into Monday: US risk-off from Wall Street and commodity weakness from the metals complex. Sterling at 1.3355 provides a partial offset for the exporters. But the net picture is softer into next week.
WHAT TO WATCH NEXT WEEK
- Monday open gap versus Friday European close. The overnight futures gap tells you how much US damage passed through.
- UK data calendar next week for domestic catalysts to offset global risk-off.
- Gold recovery or further sell-off determines the miners component of FTSE.
- 10,100 is the line. Hold it on Monday and the FTSE uptrend is still alive.
Friday 15 May 2026 | Not financial advice. For informational purposes only.
Friday 15 May 2026
FTSE 100 — Daily Read | Friday 15 May 2026
Post-CPI US close | 10,373 — part of the 8/3/1 global grid | Not financial advice
WHAT CHANGED FROM YESTERDAY
Thursday’s read noted FTSE participating in the global bid alongside the US indices, supported by the tariff truce and the broader risk-on tone coming out of the US CPI confirmation. The Thursday close at 10,373 puts FTSE as one of the eight instruments confirming the Overwatch’s best-of-2026 grid reading of 8/3/1. What changed is straightforward: the speculative uncertainty that was suppressing global equities through the week has resolved. FTSE is not driven by US tech earnings multiples — its composition means it benefits from the growth confirmation (energy, financials, industrials) rather than the discount rate repricing (tech). That is actually a steadier footing entering Friday.
HEADLINE STATE: LONG PARTICIPATING — Growth Confirmation Bid, Not Tech Repricing
FTSE’s strength this week has been driven by different mechanics to the US tech rally. Crude at $102.15 matters to FTSE’s energy names. A resilient global growth picture matters to the industrials. The confirmed disinflation narrative matters to the financials (credit quality improves). When the Overwatch says the global grid hit 8/3/1, FTSE is one of the eight confirmers because it represents the real-economy side of the equation. Retail Sales at 08:30 NY today is the next input: a strong US consumer is a global growth signal, and FTSE reads that directly through its multinationals.
Key Levels
| Level | Price | Significance |
|---|---|---|
| Thursday close | 10,373 | Part of the 8/3/1 global confirmer set |
| Strong RS scenario | 10,420–10,460 | Global growth signal adds second leg for FTSE multinationals |
| In-line range | 10,340–10,390 | Holds the week’s gain, consolidation day |
| Weak RS pullback | 10,290–10,320 | Global demand question opens — energy names lead the retreat |
| Crude $100 line | $100 (Crude) | Overwatch tripwire — close below reverses growth confirmation for FTSE energy |
| GBP/USD | 1.3445 | Sterling under pressure — positive for FTSE export earners |
Structure · Momentum · Flow
Structure
Rising. Global participation confirmed. The 10,373 close is above the week’s opening levels. The structural trend from the tariff truce is intact and now reinforced by the CPI macro confirmation.
Momentum
Steady. FTSE’s composition (energy, financials, defensives) means it does not move as violently as a tech-heavy index on CPI days. The steady gain is appropriate and suggests no exhaustion.
Flow
Weaker sterling (1.3445) is a tailwind for FTSE’s dollar-earners. Energy names supported by Crude $102. Financials benefit from the confirmed disinflation narrative. Three sector tailwinds operating simultaneously.
| Bias | LONG — US data gated |
| Risk estimate | Around 25% — composition insulates from US tech volatility |
| Key watch | Crude above $100 + Retail Sales outcome |
| Sterling note | Weak GBP = positive for FTSE exporters |
| Week carry | Bullish — one of 8 global confirmers entering next week |
This content is for educational and informational purposes only and does not constitute financial advice. Past analysis does not guarantee future results. Always conduct your own research before making any trading decisions.
Thursday 14 May 2026
FTSE 100 (UK100) — Daily Read | Thursday 14 May 2026
Post-CPI mid-session | Global risk-on supporting UK equity | Not financial advice
WHAT CHANGED FROM YESTERDAY
Yesterday the FTSE read was 72% short bias — a pullback within an uptrend. The caution was explicit: shorts here were trading the pullback leg, not calling a top. That call was well timed. The pullback the analysis was tracking found support and the broader risk-on wave from US CPI has swept global equities higher. FTSE is now at 10,373 (+0.46%). The short bias has been cleared by the global move. The uptrend the analysis identified as the bigger picture has reasserted itself.
HEADLINE STATE: UPTREND RESUMED — CPI Wave Lifts Global Equities
The pullback that was the short opportunity has played out. FTSE is participating in the global risk-on wave. +0.46% is not as strong as the DAX’s 1.32% — UK equity has its own headwinds from GBP weakness today (cable down 0.68%) — but the uptrend the analysis identified as the macro structure is intact and now extended. The FTSE does not need to be the leader. It needs to be participating. Today it is.
Key Levels
| Level | Price | Significance |
|---|---|---|
| Current level | 10,373 | +0.46% — participating in global risk-on |
| Prior bias | 72% short | Pullback short — now resolved, uptrend resumed |
| GBP/USD | 1.3445 (-0.68%) | GBP weakness gives FTSE exporters a tailwind |
| DAX comparison | +1.32% | Germany leading Europe — FTSE is lagging but holding |
| Macro structure | Uptrend | Intact — the pullback was the opportunity, not a top |
Structure · Momentum · Flow
Structure
The uptrend the analysis flagged as the macro structure has reasserted after the pullback. Yesterday’s short was the pullback play. Today’s is the continuation. The structure is intact.
Momentum
Underperforming DAX suggests FTSE momentum is not leading but it is following. GBP weakness provides a natural counter-support for UK multinationals. Not the strongest signal but aligned with the broader trend.
Flow
Global risk-on is the driver. US CPI pulled capital into equities globally. FTSE benefits as a carry-on from the US session move. The flow is exogenous — not UK-specific, but UK equity is a beneficiary.
TODAY’S BIAS: LONG PARTICIPATION — Follow Global Risk-On
The pullback short opportunity has expired. FTSE is now back in the uptrend continuation. For those who took the short during the pullback, the exit was on this CPI-driven reversal. Going forward, the bias is back to long within the macro uptrend. The FTSE does not need to lead — it just needs to not break its structure. So far, so good.
Risk: Around 40%
FTSE’s underperformance relative to DAX on a risk-on day is worth watching. If GBP weakness reverses (which would happen if dollar softens later), the FTSE tailwind from exporters fades. UK macro is a separate risk to global sentiment. Keep the position size measured.
By Experience Level
New to this
Yesterday’s short was within an uptrend — that is a disciplined trade type. Pullback shorts in uptrends have defined exits: you take the short, take the profit at support, and step aside when the trend resumes. Today is the “step aside” moment. The analysis told you this would happen.
Developing
The GBP/FTSE relationship is worth understanding. A weaker pound makes FTSE exporters look better in sterling terms. That is why FTSE sometimes rallies when GBP falls — counterintuitive if you are used to equities and currency moving together.
Experienced
FTSE +0.46% vs DAX +1.32% is a meaningful divergence. Germany is outperforming the UK on this risk-on day. If this pattern persists, it points to European preference over UK — possibly driven by the EUR/GBP cross and European export positioning. Worth monitoring as a rotation trade.
This is a daily analysis read for educational and informational purposes only. Nothing here is financial advice. Past performance is not a guide to future results. Trading carries significant risk of loss. Always apply your own risk management.
Wednesday 13 May 2026
FTSE 100 (UK100) — Daily Framework Read | Wednesday 13 May 2026
analysis as of pre-market | CPI 3.8% shock context | Not financial advice
HEADLINE STATE: SHORT BIAS — 72%, Pulling Back Inside an Uptrend
The FTSE 100 presents an interesting read: 72% short bias, but it is operating within a broader uptrend. That combination means the framework is reading a pullback within a rising market — not a trend reversal. This matters for how you trade it. Shorts here are trading the pullback leg, not calling a top. When the pullback exhausts at structural support, the uptrend should resume. This is a disciplined, time-limited short opportunity — not a case for loading up expecting a major move down.
Key Levels to Watch
| Reference | Note |
|---|---|
| Short bias | 72% — solid but not maximum conviction |
| Macro trend | Rising — pullback within an uptrend |
| Trade type | Pullback short — not a reversal trade |
| GBP context | GBPUSD volume selling — GBP pressure may support FTSE |
| Risk-on context | Global regime risk-on — headwind for FTSE shorts |
| Short target | Next structural support level within the uptrend |
Structure · Momentum · Flow
Structure
Uptrend intact — the framework confirms this. What the 72% short read is capturing is the current leg of the uptrend is pulling back. Every uptrend has pullbacks. This one is flagged as a short opportunity within the broader rising structure.
Momentum
Momentum is short-term bearish (72% short) within a longer-term bullish picture. This is a standard pullback signature. The short momentum is real but not enough to call for a sustained downtrend. It calls for a tactical short to the next support level.
Long Case vs Short Case
SHORT CASE (near-term, tactical)
- 72% short bias — framework reads downward near-term
- Pullback within uptrend — defined target at support
- CPI 3.8% — UK inflation concerns may add pressure
- Short is the current directional read
- Close before structural support — this is a leg, not a trend
LONG CASE (at support, re-entry)
- Macro uptrend intact — longs are eventually right
- Risk-on globally = FTSE follows US indices higher
- Buy the pullback at structural support — not at current levels
- 28% long bias already present — not fully short-sided
- Long re-entry is the better risk-reward once support holds
Sizing Guidance
Smaller size for the pullback short. This is a tactical trade within an uptrend — that means tighter targets and no overstaying. The risk is that risk-on momentum in US equities reverses the pullback before you reach your target. Take 50–75% position, exit at the next support zone, and consider flipping long there for the trend continuation trade.
The FTSE short is not a conviction short — it is a structured pullback trade. Treat it that way with size and exit discipline.
Tuesday 12 May 2026
Daily Framework Read · Tuesday 12 May 2026
FTSE 100 (UK100) — Daily Framework Read | Tuesday 12 May 2026
Published pre-market · Time-gated member content
Current State
SHORT — 99% Confidence
Short bias: 72%. Channel ceiling with sellers pressing. Risk score 7/10 — this is a pullback short inside an uptrend. The underlying trend is still up.
Key Levels
| Level | Price | Notes |
|---|---|---|
| Entry | 10,595 | Channel ceiling rejection zone |
| Stop Loss | 10,667 | Above channel ceiling |
| Target 1 | 10,459 | Channel midpoint support |
| Risk:Reward | 1.88R | Near 2R — valid setup |
Structure Read
The FTSE 100 is at the top of its channel — a structural ceiling that has rejected price on previous visits. This is a counter-trend short inside what remains an upward-trending market. The underlying trend is still bullish, which means this short is capturing a pullback from the ceiling to the midpoint, not a trend reversal. That context is critical for managing the trade.
Momentum Read
Sellers are pressing at the channel ceiling and momentum is with the short at the current location. That combination — a defined structural level and momentum aligned — is what makes a 99% confidence reading meaningful. However, confidence in the level doesn’t negate the risk from the underlying bullish trend, which is why the risk score of 7/10 is honest.
Volume & Flow Read
Active selling at the channel ceiling is visible in the flow. The 72% short bias reflects this. Sellers are not passive at this level — they’re pressing, which gives the short trade immediate backing from the volume picture. Watch for that selling pressure to continue as price moves toward T1 at 10,459.
The Verdict
The 99% structural confidence in this short is about one thing: the channel ceiling is a clear, well-defined level and sellers are pressing at it. That’s a high-quality trade location. But shorting into an uptrend is inherently counter-trend, and that carries a higher risk of the trade reversing quickly if the broader market resumes its bullish move. The plan is clean: short at 10,595, stop at 10,667, take T1 at 10,459. A 7/10 risk score means you size this carefully — don’t let a counter-trend trade become a maximum-size position.
Long Case vs Short Case
28%
Underlying uptrend intact. Channel ceiling breaks — extends to new highs.
72%
Channel ceiling rejection. Active selling. 99% structural confidence at the level.
Position Sizing Guidance
7/10 risk score means reduced size — 0.75% of account maximum despite the 99% structural confidence. The underlying uptrend is the risk factor that limits sizing. Entry at 10,595, stop at 10,667 (72 points), T1 at 10,459 (136 points). Near 2R means the trade pays proportionally for the risk taken. Close the position at T1 without exception — do not hold a counter-trend short hoping the FTSE reverses its entire trend.
This content is for educational and informational purposes only. Nothing here constitutes financial advice or a recommendation to buy or sell any instrument. Trading involves substantial risk of loss. Past performance is not indicative of future results. Always conduct your own due diligence and manage risk appropriately.
Tuesday 5 May 2026
FTSE 100 (UK 100) — Daily Framework Read | Tuesday 5 May 2026
Daily Framework Read · Indices · Tuesday 5 May 2026
Headline read
Footthe framework sits in the upper third of its multi-week range with the framework reading watching, not chasing. The structure has reclaimed broken levels but the most recent push got rejected at value-area high, and the panel is explicit about waiting for the next break before committing. The bias is constructive, the trigger is not yet armed.
The Read
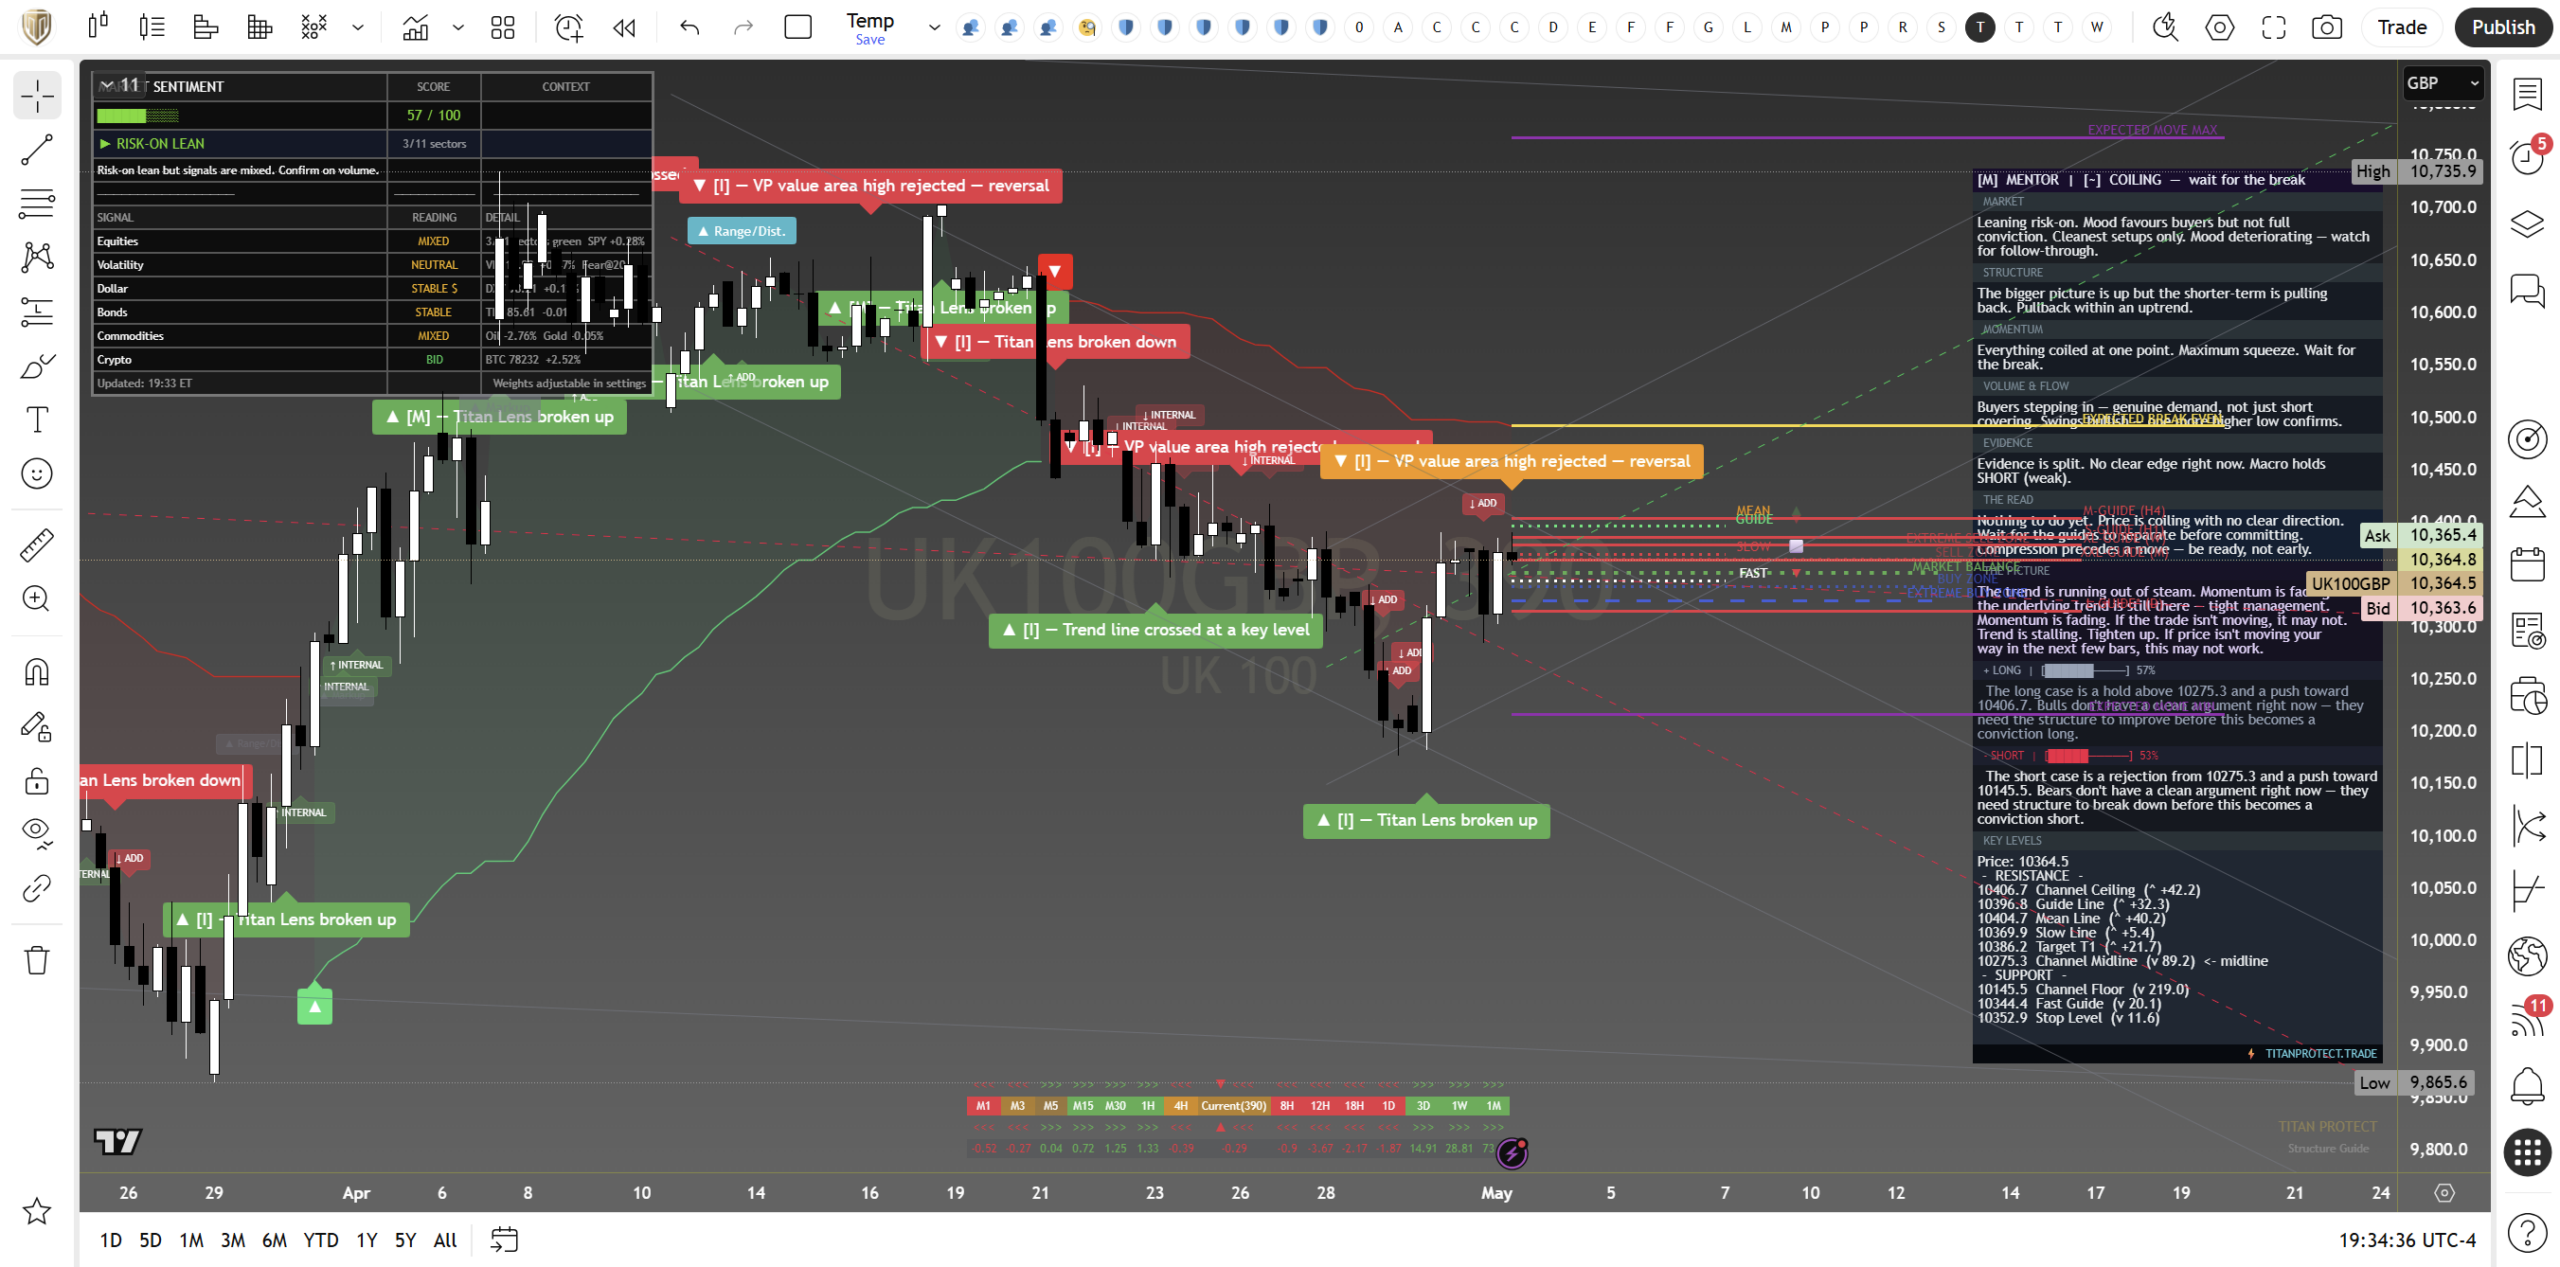
Footthe framework is in a textbook coil. The chart shows three things stacked on top of each other and they all matter. First, the prior leg lower bottomed out into a clean rejection and the framework flagged the lows as a buy zone in real time. Price has worked back through the broken structure since, with the trend line crossed at a key level on the way up. Second, the most recent attempt to push higher ran into value-area high and failed, leaving an upside reversal print on the daily. Third, the the framework panel is now sat in a holding pattern, calling for the break before the next directional commitment.
That combination matters. A market that has reclaimed structure but cannot extend through value-area high is a market gathering itself for the next decision, not one already in trend. The voltage is rising on both sides. Bulls have repaired enough damage to argue the lows are in. Bears can point to the rejection and say the rally needed more than it had. Tuesday is a wait-and-see day until one side breaks.
The Setup
The structural picture is constructive but tactically neutral. The framework has cycled through three working states across the recent swing:
- Lows reclaimed: the panel marked the prior lows as a buy area and price respected it, broke up out of structure, and crossed the trend line cleanly on the way back to range mid.
- Value-area high rejection: the most recent push topped at the upper third of the multi-week range and reversed. That print is now overhead supply and it is the level the next attempt has to clear.
- Holding pattern: the read is on hold pending the next break. Conviction is medium, not high, and the framework is explicit about not pre-empting the move.
Volume on the up-leg was decent without being heavy, which fits the read of a constructive but unfinished move. Order flow into the rejection looked reactive rather than committed selling, which means the rollover is more likely a pause than a fresh leg lower, but the tape has to prove that with a reclaim of the rejection level rather than just chopping under it.
The cleanest playbook is to let the level decide. Above the rejection zone with a daily close, the structural read graduates from “watching” to “long with confirmation”. Below the recent swing low, the rebuild thesis weakens and the framework rotates back toward defensive. Until either trigger fires, position size stays modest and the bias stays neutral-to-constructive rather than committed.
Levels
| Zone | Level | What it means |
|---|---|---|
| Upside trigger | 9,800 area | Value-area high and rejection level. A daily close through arms the long. |
| Range high | 10,300s | Multi-week swing high. The next obvious target if the upside trigger holds. |
| Pivot | 9,500 area | Range mid. The market needs to hold this on pullbacks for the constructive read to stay live. |
| Downside test | 9,200 area | Trend-line cross zone on the way up. First place the bid should appear if pullback extends. |
| Invalidation | Recent swing low | A daily close below cancels the rebuild thesis and rotates the framework defensive. |
Scenarios
Base case, hold pivot, range higher (around 50%). Footthe framework holds above the pivot on pullbacks and grinds back toward the upside trigger over the next two to three sessions. The trigger does not break on the first attempt. Trade is range, not trend, and the right play is to fade the edges rather than chase the middle.
Bull case, reclaim and run (around 30%). A daily close through the upside trigger arms the structural long. Targets sit at the multi-week range high. This is the higher-conviction path because it requires the market to do real work, not just chop, and a confirmed break tends to bring follow-through.
Bear case, pivot fails (around 20%). A loss of the pivot on volume opens a retest of the trend-line cross zone, and a break of the recent swing low after that turns the read defensive. This is the smaller probability tail but the one that needs the tightest stops if it triggers.
Verdict
The Call
Footthe framework is constructive but tactically waiting. The read is neutral to long, conditional on a clean break of the upside trigger. Until the rejection level gets reclaimed on a daily close, position size stays modest and the bias stays patient. Lose the pivot and the framework rotates defensive into the trend-line cross zone. Risk is around 55%, weighted by the rejection overhead and the medium-conviction read on the panel, high enough to demand confirmation, low enough that the structural rebuild stays the working thesis.
Cross-reference
Footthe framework’s read fits inside today’s Global Grid where European indices are reading constructive but unwilling to lead, and the Macro Pulse note on rates and sterling. For the wider session map, see the Pre-London brief.
This is educational market commentary, not a personalised recommendation. Markets carry risk and you can lose more than you stake on leveraged products. Do your own work and size positions to your own risk tolerance.
Continue with Titan Protect
Twenty-plus instruments. One framework.
We read more than twenty instruments daily across four sessions. The framework’s sunrise call landed across the day — the Pre-NY case study shows what the lines drew, what New York did, and where the read stands.
Core
£59/mo
Indicator suite plus daily framework reads.
Edge Popular
£109/mo
Core plus Shield dashboard and member-only briefs.
Elite
£179/mo
Edge plus weekly 1:1 call and early access to new tools.
Save 15% on annual billing
Want to see the framework in action? Free Explorer tier — no card required.
Join the live community: Discord channel · Shield dashboard
Education, not financial advice. Trade your own analysis.
Sunday 3 May 2026
FTSE 100 — Daily Framework Read | Sunday 3 May 2026
FTSE 100 | Monday Open Framework Read | Data basis: Friday 1 May 2026 close
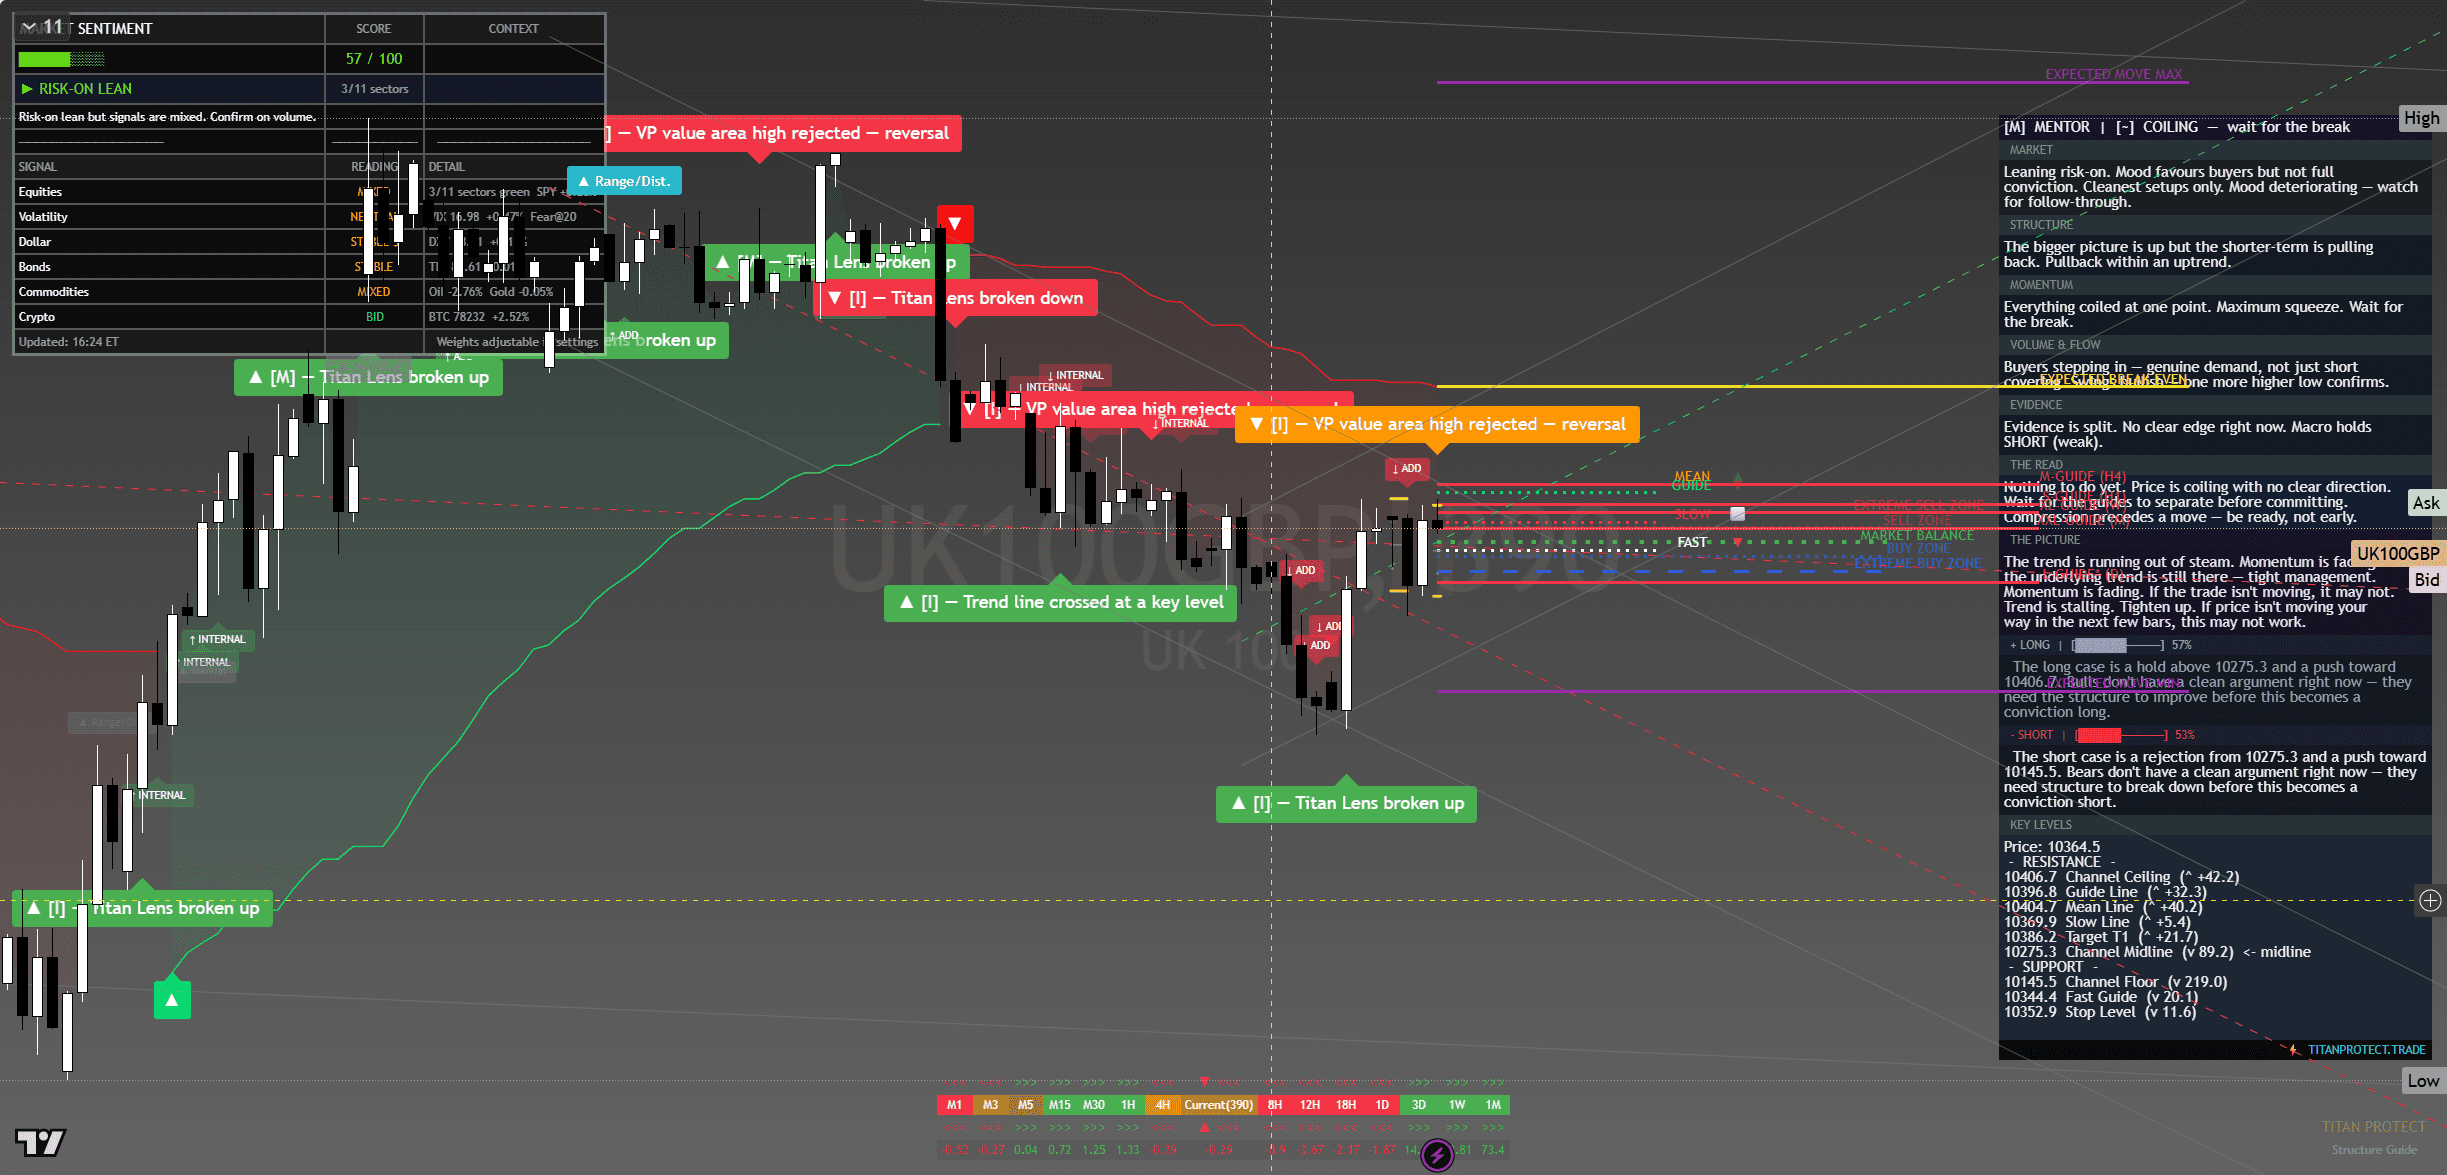
FTSE 100 — chart with framework overlay. The Lens annotations show structural breaks, reversal triggers and confluence zones at the levels referenced below.
Where It Sits
Structure
Structurally the index has been climbing in an orderly fashion since the late-April low. Friday’s close holds above the breakout zone from earlier in the week and above the rising 20-day moving average. The structure is constructive but not stretched — there is no sign of distribution or topping behaviour on the daily timeframe.
Momentum
Momentum is positive but unspectacular. The UK index has been a quiet performer relative to the US — gains have come without leadership and without enthusiasm. That is actually a constructive sign because it means the move has not been crowded. The risk is that momentum stalls if global enthusiasm fades.
Volume & Flow
Volume has been thin on the recent advance, which is the typical UK summer-tape pattern even in May. Breadth is mediocre — the index gains are concentrated in financials and a handful of large miners. When participation is narrow, the index trades with the leaders rather than independently.
Key Levels
| Level | Type | Significance | Action Zone |
|---|---|---|---|
| 9,550 | Resistance | Round number, prior monthly high zone | Take profits if reached |
| 9,500 | Pivot | Round-number trigger for next leg | Hold above = continuation |
| 9,485 | Friday close | Reference anchor | Bias line for Monday open |
| 9,420 | Support | Breakout retest zone | Buy zone with defined stop |
| 9,350 | Major support | Multi-week range floor | Stop-out below for longs |
Three Scenarios Into Monday Open
Continuation
Index opens firm in London, follows US tape, takes 9,500 round number cleanly. Energy and miners contribute. Closes near 9,520. Pattern: textbook continuation in the absence of UK-specific catalyst.
Range
Index opens flat, churns 9,460-9,510 through the session. UK markets follow the US lead but without a domestic catalyst, range trade dominates. Magnet pulled to Friday close.
Mean Reversion
Index opens weak on USD strength or oil weakness, fades to 9,420 support, holds the level on a clean test. Mean-reversion within the broader uptrend. Not the base case but possible on energy-sector drag.
Risk Score
Risk sits at Around 45% heading into Monday open.
Risk is moderate-low. The UK index is a follower not a leader on Monday open with US markets driving the global mood. The constraint is pound strength against the dollar — a sharp GBPUSD move can shift the index’s competitiveness profile and hit the export-sensitive components. Standard sizing within the established range, no aggressive new entries on weekend gaps.
How to Walk It
Entry / Stop / Target structure:
- Long 9,440-9,460 pullback | Stop 9,400 | Target 9,520 | R:R 2:1
- Long 9,505 breakout | Stop 9,475 | Target 9,550 | R:R 1.5:1
- Fade 9,560+ rejection | Stop 9,580 | Target 9,485 | R:R 3:1
Experience-level guidance:
Beginner: The Monday open after a Friday record close is exactly the situation where over-confidence costs money. Reduce size to half your standard. Trade only the cleanest setup from the entries above. If the tape opens against your bias, do nothing — wait for the second hour, when the institutional flow has tipped its hand.
Intermediate: Use the levels table to define the trading range. Fade the extremes with defined stops, take profits before the round-number resistance levels. Do not carry directional positions through the day if you cannot watch the tape — Monday opens are prone to fast reversals.
Advanced: The vol regime is supportive of trending moves. Defined-risk options structures around the key pivot levels capture the asymmetry cleanly. Keep notional small relative to your book — Monday after a record-close week is asymmetric speculation, not core positioning.
The Sunday Composite — How This Read Sits Inside The Cross-Asset View
This single-instrument framework read is one slice of the larger Sunday weekend synthesis. The composite takes positioning, macro, sentiment, volatility, sector dispersion and trade structure as separate analytical layers and arrives at a unified composite verdict for Monday open. Each layer below is unpacked in full.
Read the full composite for the cross-asset context driving this instrument:
The institutional positioning split — Asset Managers vs Leveraged Funds in size
PCE clearance and the macro case for Monday’s carry
The three-layer sentiment disagreement — surface greed, retail neutral, professionals hedged
The vol curve term structure and what VVIX is signalling
Sector dispersion and the breadth problem behind the record close
The Monday position-management playbook — sizing tiers and trade plans
Sunday Overwatch — the unified composite verdict
Continue Reading
The macro frame driving this read is unpacked in the weekend briefs:
Sunday Setup — Reading The Tape Into Monday Open
PCE Cleared, VIX Crushed, SPY Closed 720 — Friday Post-Close Recap
This analysis is for educational and informational purposes only. It does not constitute financial advice. Always manage your risk independently and in accordance with your own financial circumstances.


