Index Performance and Session Drivers
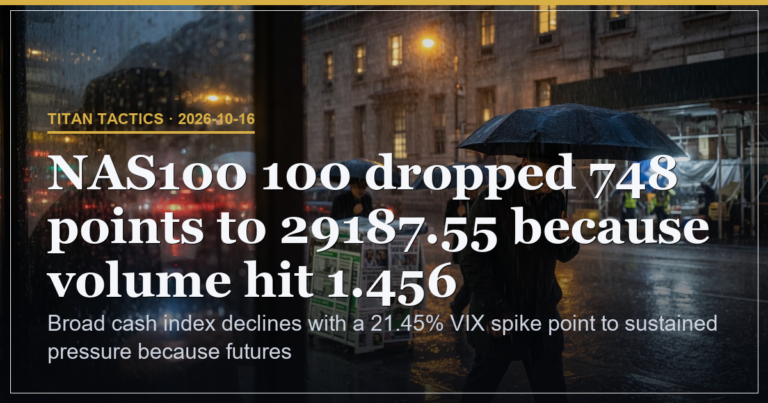
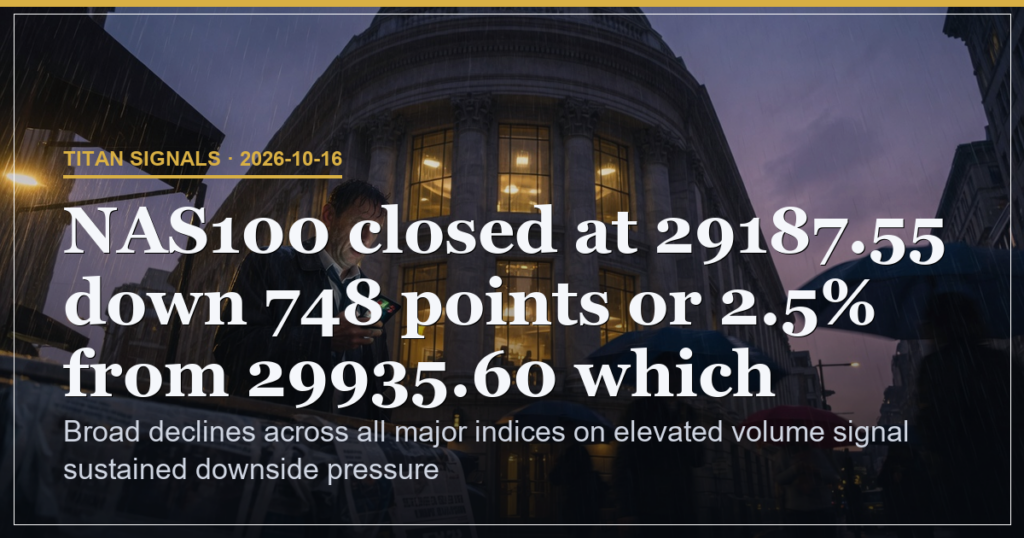
SPY closed at 763.25 down 1.11 percent from 771.79 because the index opened at 773.24 and fell to a low of 760.64 which means sellers maintained control from the first print through the close. QQQ dropped 2.5 percent to 709.80 on 64.1 million shares because the open at 725.48 gave way to a low of 707.23 which means tech weakness set the tone for the broader tape. Nasdaq finished at 29187.55 down 748 points or 2.5 percent from 29935.60 which means the session produced the largest point and percentage decline across the major indices. SPX closed at 7659.44 down 1.09 percent because volume reached 3.32 billion shares while the low at 7631.77 confirmed the breadth of the move lower.
Volume Confirmation Across Indices
SPY turnover hit 59.2 million shares which means the decline occurred on participation well above recent averages and leaves little room for immediate reversal without fresh demand. QQQ volume of 64.1 million shares aligned with the 2.5 percent drop which means liquidity supported the tech-led selloff rather than absorbing it. DIA volume reached 4.94 million shares which means even the blue-chip index could not escape the uniform pressure despite its smaller 0.4 percent loss. Russell 2000 fell 1.66 percent to 2721.37 on the session because the low at 2716.23 extended the range without any counter bids appearing in size.
| Index | Close / Change | Volume Implication |
|---|---|---|
| SPY | 763.25 / -1.11% | 59.2m shares confirm seller control from open to low of 760.64 |
| QQQ | 709.80 / -2.5% | 64.1m shares tie tech weakness directly to the 18.2 point drop |
| Nasdaq | 29187.55 / -2.5% | 1.456bn shares mark the session’s largest percentage decline |
Key Levels and Structural Context
SPY support rests at 760.64 with resistance at 773.24 because the day’s range established those prints as the immediate boundaries which means any reclaim must first clear the open gap. QQQ support sits at 707.23 and resistance at 725.94 because the low and open defined the session extremes which means continuation lower stays possible while price remains below the open. The 6.72 point gap between SPY spot and max pain at 770.00 persists on zero-day expiry which means pinning risk limits immediate downside only if value holds exactly at that strike into settlement.
| Index | Support / Resistance | Session Range Meaning |
|---|---|---|
| SPY | 760.64 / 773.24 | Open at 773.24 and low at 760.64 set the boundaries for next move |
| QQQ | 707.23 / 725.94 | Low at 707.23 and open at 725.48 frame continuation risk |
Positioning and Overnight Offset
Positioning Pressure shows mixed whale flow and SPY max pain above spot keep pressure neutral until next expiry cluster shifts because aggregate gamma exposure stays fragmented across listed names. Futures offered only partial overnight offset which means the cash session’s uniform decline leaves no sector leadership intact and raises the odds of follow-through pressure into the next print.
Scenario Triggers and Probability Weights
Reclaim of 773.24 in SPY carries 25 percent odds because that level would restore the session open and shift momentum back toward the prior close. Extension below 760.64 holds 45 percent odds because the low already acted as support failure and volume confirmed seller presence. A Nasdaq reclaim above 29935.60 carries 30 percent odds because that would require broad participation across all major indices to reverse the 2.5 percent decline.
Risk and Experience Level Watchpoints
Risk stands at 65 percent because the uniform move across SPY, QQQ and Nasdaq on elevated volume leaves no leadership intact which means volatility expansion remains the dominant factor. VIX at 19.99 has already moved the market from calm to fear which means realised volatility is now expected to stay elevated until a clear level reclaims.
| Level | What to Watch on the Tape |
|---|---|
| Beginner | Observe how volume spikes align with new lows in SPY and QQQ to understand participation strength |
| Intermediate | Track whether the 760.64 SPY low or 707.23 QQQ low holds on subsequent sessions to gauge continuation odds |
| Advanced | Monitor the 6.72 point max pain gap versus spot and note any pinning behaviour into zero-day expiry |
Broad declines across all major indices on elevated volume signal sustained downside pressure because the uniform move lower leaves no sector leadership intact.
This is analysis, not financial advice. Always manage your risk.