
Predictive Edge Series
Predictive Edge 02: Price Action
Every indicator is a derivative of price. Learning to read price directly removes a layer of lag and a layer of interpretation between you and the market.
Reading the Chart Without Decoration
Price action is the practice of reading what a chart is actually doing rather than what an indicator derived from that chart is reporting. The distinction matters because every indicator introduces lag. The calculation has to happen after the price bars close. The signal appears after the fact. Price itself has no lag. The candle you are watching is happening right now.
Traders who rely exclusively on indicators often describe looking at a busy chart with multiple overlays and trying to reconcile conflicting signals. Two indicators say buy, one says sell, the chart pattern looks neutral. The root problem is that the primary source of information, the price bars themselves, has been buried under layers of derived data. Price action trading starts by removing those layers and learning to read the primary source directly.
This does not mean trading with no context or no tools. It means that the price bar, its relationship to surrounding bars, and its position relative to key structural levels are the primary inputs. Everything else is secondary verification. When you can read price directly, indicators become useful confirmation signals rather than the source of trading decisions.
Candle Behaviour vs Candle Patterns
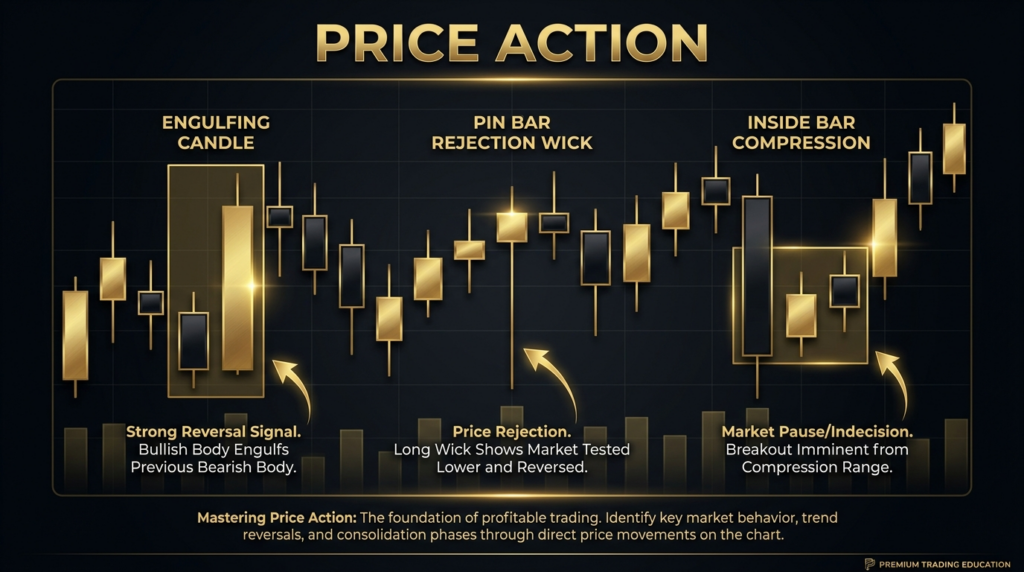
Most traders learn named candle patterns: the hammer, the engulfing bar, the doji. This is a reasonable starting point but it is not the core skill. The core skill is reading candle behaviour, which is a broader concept. A candle pattern tells you the shape of one or two bars. Candle behaviour tells you what that shape means in context, and context changes what the same shape implies.
A hammer at a major structural support after a sustained decline, with increased volume, in a market where the higher timeframe is trending upward: that is a meaningful signal. The same hammer pattern in the middle of a range, on average volume, with no structural context: that is a shape on a chart. Pattern recognition without contextual reading produces inconsistent results because the same shape appears in conditions where it has edge and conditions where it has none.
Candle behaviour asks different questions. How large is this bar relative to recent bars? Is the close in the upper third or lower third of the range? Where did the bar open relative to where it closed? Are the wicks longer on one side, and if so, what does that suggest about where participation rejected price? These questions give you information about the balance of pressure between buyers and sellers at that moment. That information is real regardless of whether the bar forms a named pattern.
The Open/Close Relationship
The relationship between the open and close of a bar is the most direct expression of who won the session within that bar. A bar that opens low and closes high tells you buyers controlled the bar. A bar that opens high and closes low tells you sellers did. A bar that opens and closes near the same level tells you neither side gained a clear advantage and the outcome of that session is unresolved.
What matters most is not the individual bar in isolation but how a sequence of bars builds a picture of pressure. Three consecutive bars closing in the upper half of their range, each with the close higher than the open, is a picture of consistent buying pressure. Sellers are not finding enough conviction to close bars below their opens. That is different from three bars moving up in price but with the closes in the lower half of each bar’s range. Price is moving up but the closes suggest sellers are pushing back within each session. The momentum of the move is weaker than the upward price movement implies.
This distinction between where price travels within a bar and where it actually settles at the close is one of the most underused reads in retail trading. The close is the final vote of every participant in that session on whether they want to hold overnight or not.
Rejection Wicks and What They Tell You
A rejection wick is the tail of a candle where price moved to a level and was pushed back before the close. A long upper wick on an otherwise bearish bar tells you price tested higher levels and sellers rejected it. A long lower wick on an otherwise bullish bar tells you price tested lower levels and buyers absorbed the selling.
The size of the wick relative to the body matters. A wick that is two times the size of the body represents a significant rejection. Price moved a meaningful distance in one direction, and then an equal or greater force pushed it back. At a significant structural level, a large rejection wick is one of the clearest signals that the level is active and that participants are defending it.
Where the wick forms is equally important. A rejection wick into a level that has held multiple times before is confirmation of that level. A rejection wick forming in the middle of a range, away from any identified structural reference, is less significant. The wick is telling you something about price behaviour at that location, but without a structural reason for participants to defend that location, the information has less predictive value.
Clean vs Messy Price Action
Clean price action produces bars that have clear directional intent, with closes that confirm the direction of the move. Bars are proportionate. Moves have consistent momentum. Levels hold or break cleanly. Messy price action produces overlapping bars, inconsistent closes, large wicks in both directions within the same session, and levels that are repeatedly tested but neither held nor broken cleanly.
Messy price action is a condition, not a signal. It tells you the market is in a period of indecision or low-conviction positioning. The correct response to messy price action is usually to reduce activity, not to increase it. Traders who increase position size or trade frequency during messy conditions on the basis that more trades gives more chances to be right are misunderstanding the information the chart is providing. The chart is telling you there is no clear participant with control right now. Trading aggressively into that condition is trading without a read.
Clean price action, conversely, is the environment where price action skill produces its highest-probability signals. When bars are consistent, closes are decisive, and levels are respected or broken clearly, the market is providing high-quality information about direction and likely continuation. That is the environment to be active in.
| Price Action Signal | What It Indicates | Reliability | Required Context |
|---|---|---|---|
| Large rejection wick at structure | Level is actively defended | High | Must be at identified level with prior touches |
| Close above prior swing high | Breakout with buyer commitment | High | Volume should confirm. No wick back below. |
| Consecutive closes in upper range | Sustained buying pressure | Medium-High | Requires three or more bars to be meaningful |
| Engulfing bar at structure | Directional shift at key level | Medium | Prior bars must confirm the level was tested |
| Doji or indecision bar | No clear winner in that session | Low as standalone | Only useful as context signal, not entry signal |
| Overlapping bars, mixed closes | Indecision, no edge present | Low | Stay out. Not a tradeable signal. |
| Single-candle pattern without context | Shape only. No edge implied. | Unreliable | Never trade patterns divorced from structure |
When to Trust Price Action Alone
Price action as a standalone primary read is most reliable in liquid, actively traded sessions on major instruments. During the core hours of the London or New York session on equity indices, major currency pairs, or liquid commodities, the price bars reflect genuine institutional participation. The closes mean something because they represent the decisions of large and sophisticated participants with full access to information.
Price action is least reliable in thin sessions, at the open of pre-market extensions, or in instruments with low average daily volume. In those conditions, a single large order can produce bars that look structurally significant but represent nothing more than a temporary imbalance. The large rejection wick that forms during the Asian session on a minor cross is not the same signal as the same pattern forming at the London open on a major index. The institutional validation that makes the signal meaningful is not present in the same way.
The practical rule: trust price action most when the volume behind the bars is at or above the session average. Discount it when volume is below average. Price that moves on thin volume is more prone to reversal than price that moves on confirmed institutional participation.
Action Items
- Remove all indicators from one chart for one full week. Observe only the bars, their relationship to each other, and their closes relative to structural levels you have already marked. Note what you see that you did not notice before.
- For the next ten trade setups, write down the open/close relationship of the three bars before your entry. Were closes in the direction of your trade? If not, note the mismatch before entering.
- On any setup where you see a large rejection wick, ask yourself: is this at an identified structural level? If yes, it is meaningful. If the wick is in the middle of the range, it is information but not an entry signal.
- When price action is messy (overlapping bars, indecisive closes), reduce or eliminate activity for that session. Track whether your results improve on the days you sit out messy conditions versus the days you trade through them.
- Pick one instrument and study the last 30 days of daily candles without indicators. Mark every significant rejection wick and note whether it occurred at a structural level. This exercise builds the contextual reading the patterns alone cannot give you.
Continue Learning
- Predictive Edge 01: Confluence
- Predictive Edge 03: Support and Resistance
- Predictive Edge 04: Trend Analysis
- Predictive Edge 05: Momentum
- Predictive Edge 06: Multi-Timeframe Analysis