Predictive Edge Series
Predictive Edge 01: Confluence
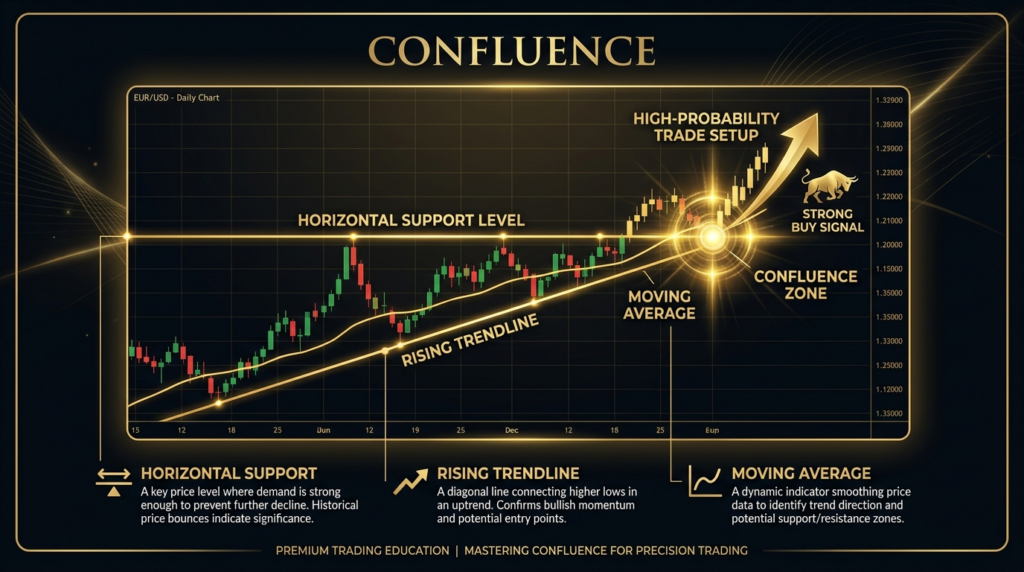
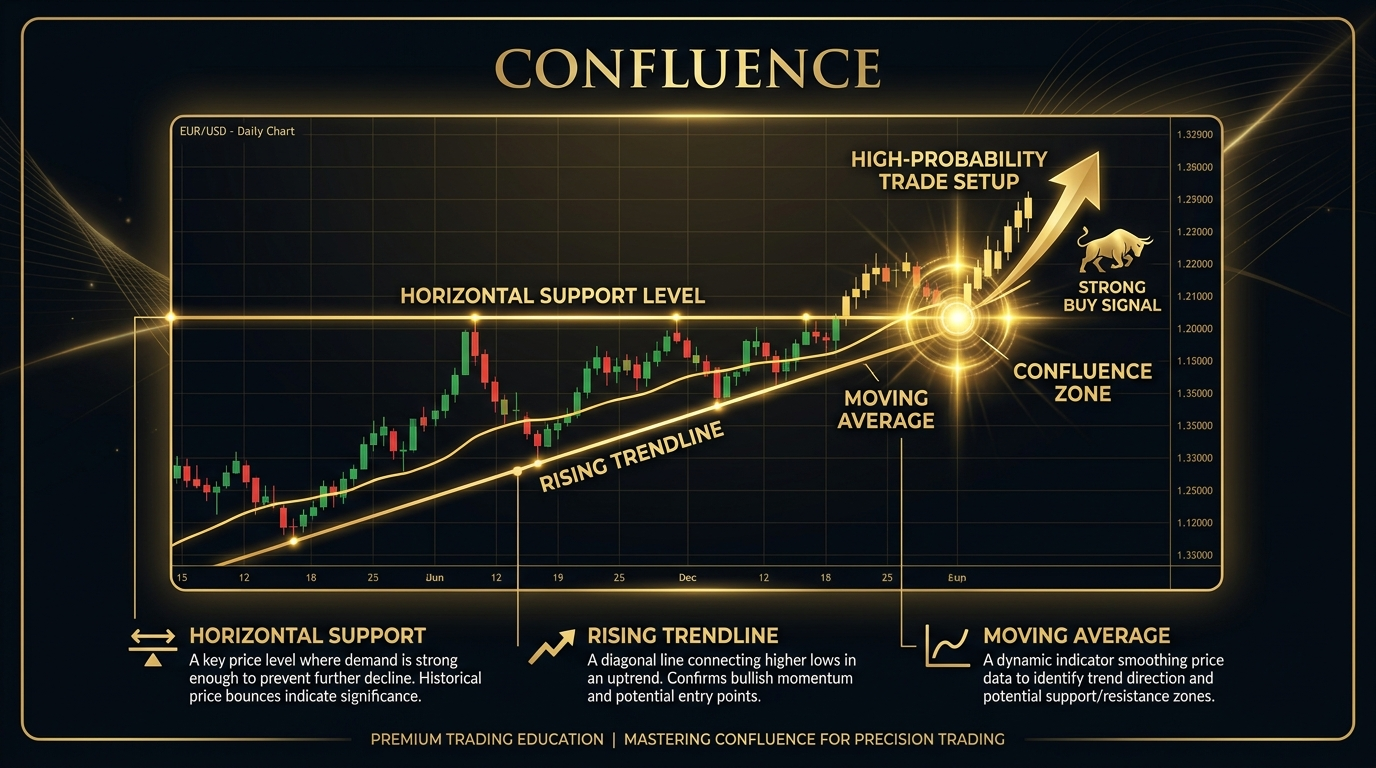
One signal tells you something. Three independent signals telling you the same thing at the same time tell you something worth acting on.
What Confluence Actually Means
Confluence is not a strategy. It is a filter. It describes what happens when multiple independent signals land on the same conclusion at the same time. A structural support level on the daily chart. A momentum shift visible on the one-hour. A surge in volume at precisely that price. Each of those signals was generated by a different mechanism, looking at a different piece of information. When they agree, the probability of a sustained move increases. When only one of them is present, you are speculating on noise.
The word gets used loosely in trading circles, often to describe any situation where two indicators happen to agree. That is not what it means here. The independence of the signals is what makes the agreement meaningful. If you are using two momentum oscillators built on the same price data, they will always tend to agree. That is not confluence. That is redundancy dressed up to look like confirmation.
True confluence comes from signals generated by genuinely separate processes: price structure derived from where buyers and sellers have historically made decisions, momentum derived from the rate and strength of recent moves, and volume derived from the actual participation behind the price. These three layers see the market through different lenses. When they all point the same direction, you have something worth trading.
Why Single-Indicator Trading Fails
Most retail traders start with a single indicator. They find one they like, back-test it loosely on a chart they can see working, and start trading it. The first few months are often encouraging precisely because random sequences of wins can look like system edge. Then the environment shifts, and the indicator stops working, and they move on to the next one.
The reason single-indicator trading fails is not that the indicators are useless. It is that no single signal is designed to account for every variable that determines whether a move will follow through. A support level is a location. It tells you where price has reacted before. It tells you nothing about whether the momentum environment is aligned for another reaction, or whether the volume behind any initial bounce is institutional or retail. Without that context, you are trading a memory of the past without any read on whether the present conditions support the same outcome.
Professional traders are not using more complicated indicators. They are using a framework that requires multiple inputs to agree before capital is risked. The edge is not in any individual signal. The edge is in the filter that only permits action when the case is strong enough across multiple dimensions simultaneously.
The Three Signal Types
Structural signals come from price itself, from the historical record of where significant buying and selling has taken place. Major swing highs and lows, range boundaries that have been tested and held multiple times, daily or weekly open levels, and pre-session range extremes are all structural signals. They represent price memory. Other participants in the market remember those levels. Decisions get made around them.
Momentum signals come from the behaviour of price in recent bars relative to prior bars. Is the pace of moves increasing or decreasing? Is buying pressure strengthening into a test of a level or fading? Are sellers losing conviction as they approach a prior low? Momentum does not generate entry levels. It generates context for whether a structural signal is likely to hold or fail. Strong momentum moving into a level with no deceleration suggests the level will be tested aggressively. Decelerating momentum as price approaches a level suggests buyers or sellers are already stepping in before it is reached.
Volume signals confirm whether the price behaviour is backed by genuine institutional participation or is being generated by low-volume conditions where small orders can distort the picture. A reversal candle at a structural level with expanding volume is materially different from the same candle with volume half the session average. The first represents real two-way interest. The second may be a temporary imbalance that evaporates as liquidity returns.
The Three-Signal Minimum Rule
The practical application of confluence is straightforward: require a minimum of three independent signals before entering a trade. Two is not enough because two signals can agree by coincidence. Three independent signals agreeing simultaneously is materially less likely to be a coincidence. It represents genuine alignment across price structure, momentum character, and participation level.
This rule will eliminate a large proportion of the setups you currently consider. That is the point. The setup you enter because the price is at a level but momentum is ambiguous and volume is thin is exactly the kind of setup that produces small wins when it works and oversized losses when it fails. Removing those from your traded universe improves both the win rate and the average quality of losses, because you are only holding positions where the original structural argument remains intact.
The rule also eliminates the urge to force trades. On a slow session with no clean setup, the three-signal requirement will keep you out of the market. That is a positive outcome. Capital preservation in conditions where the edge is absent is as important as execution in conditions where it is present.
Confluence vs Non-Confluence: A Real Example
Consider two setups on the same instrument on the same day. In the first, price approaches a level that has acted as resistance three times over the prior two weeks. As it approaches, momentum is decelerating: the bars are getting smaller and the closes are pulling away from the highs. Volume is increasing as price approaches the level, suggesting sellers are active. This is a three-signal confluence setup. Structural level, momentum deceleration, volume confirmation. Each signal is generated by a different process, and they are all pointing to the same outcome.
In the second, price approaches the same level. But momentum is accelerating: the bars are large and the closes are at the highs. Volume is below average. This is a one-signal setup. You have the structural level. You do not have momentum or volume supporting a rejection. The prior resistance is still visible, but the evidence that it will hold is not there. Trading the second setup as though it carries the same probability as the first is a systematic mispricing of risk.
| Signal Count | Example Combination | Estimated Edge | Action |
|---|---|---|---|
| 1 of 3 | Price at level only | No edge. Coin flip at best. | No trade |
| 2 of 3 | Structure + momentum alignment | Marginal. Worth watching, not acting. | Watch only |
| 3 of 3 | Structure + momentum + volume confirm | Genuine edge. Probability tilted. | Trade with full sizing |
| 3 of 3 + timeframe alignment | Higher chart agrees with entry chart | Highest-probability setups available. | Maximum conviction entry |
| Redundant signals | Two RSI-based oscillators agreeing | No edge. Same data source. | No trade. Not true confluence. |
Building Your Confluence Checklist
The practical way to embed this is a pre-trade checklist, completed before every entry. Three questions. First: what is the structural case? What level is being tested, how many prior reactions has it produced, and is it clean or marginal? Second: what is the momentum case? Is momentum aligning with the trade direction or contradicting it? Third: what is the volume case? Is participation increasing, decreasing, or neutral as price approaches the level?
If you cannot answer all three clearly, the setup does not meet the minimum standard. A setup you cannot describe clearly before entry is a setup you cannot manage rationally once you are in it. The checklist is also the foundation for post-trade review. When a trade fails, return to the checklist. Was the structural level actually clean? Did momentum genuinely align, or did you interpret ambiguous data favourably? Was volume confirming or did you assume it would? The answers to those questions tell you whether the loss was a legitimate outcome from a high-quality setup or a consequence of lowering your own standards.
Action Items
- Write down the three signal types on a card next to your screen: structural, momentum, volume. Before every trade, tick all three. If you cannot tick all three, do not enter.
- Review your last 20 trades and count how many had all three signals present at entry. The proportion that hit their target is your confluence win rate. Compare it to the trades where one or two signals were missing.
- Identify two redundant indicators in your current setup and remove them. Replace with one signal from a genuinely independent source (volume, if you are not already using it).
- For the next two weeks, mark every setup that meets the three-signal minimum but which you do not take, alongside every trade you do take. Assess which list performed better at the end of the period.
- When a trade fails, ask one question before anything else: was the volume signal genuinely present, or did you estimate it would be? Most single-signal failures are volume failures in disguise.
Continue Learning
- Predictive Edge 02: Price Action
- Predictive Edge 03: Support and Resistance
- Predictive Edge 04: Trend Analysis
- Predictive Edge 05: Momentum
- Predictive Edge 06: Multi-Timeframe Analysis