[TP] Levels Map - Suite
A support and resistance zones indicator that explains itself. It draws the prices where several tools agree, ranks each zone, and says in words whether price is holding it, has crossed it or is stretched away from it.
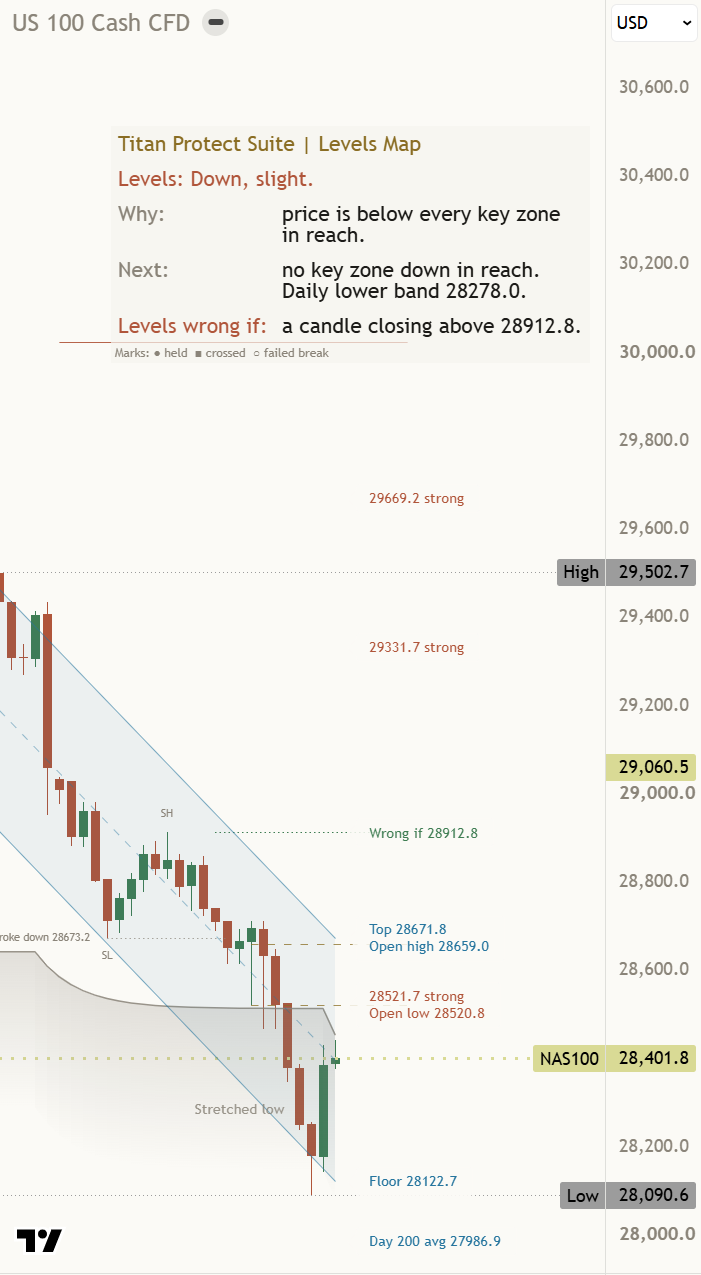
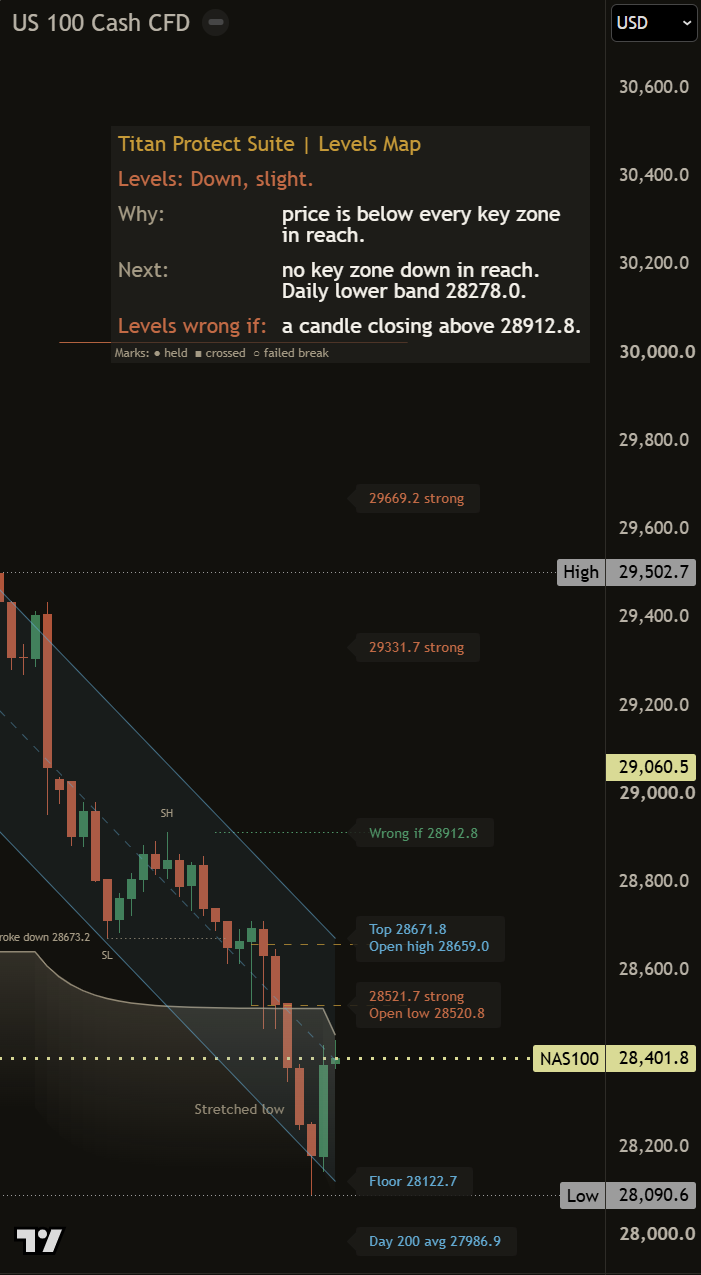
What it does
A support and resistance zones indicator that explains itself. It draws the prices where several tools agree, ranks each zone, and says in words whether price is holding it, has crossed it or is stretched away from it.
Zones, not single lines
A level is only drawn where several families of tools agree: the daily Bollinger frame, VWAP bands, daily and weekly averages, prior day and week highs and lows.
Ranked in words
Zones are labelled major, strong or minor by how many families agree. Only the nearest minor zone above and below price is drawn, so the chart stays clean.
Held, crossed or stretched
Each zone says if price is holding it or has crossed it. The frame shade says Stretched high or Stretched low when price is far from the middle.
How to read it
Three things to look at, in this order.
- 1Read the header
Up, Down or Sideways with a strength word, then the zone price is working around.
- 2Read the zones
Major and strong zones are the ones to respect. Held means price respected it. Crossed means it was broken.
- 3Use the Wrong if
The close that would prove the read wrong is the edge of the zone that matters most.
On the chart
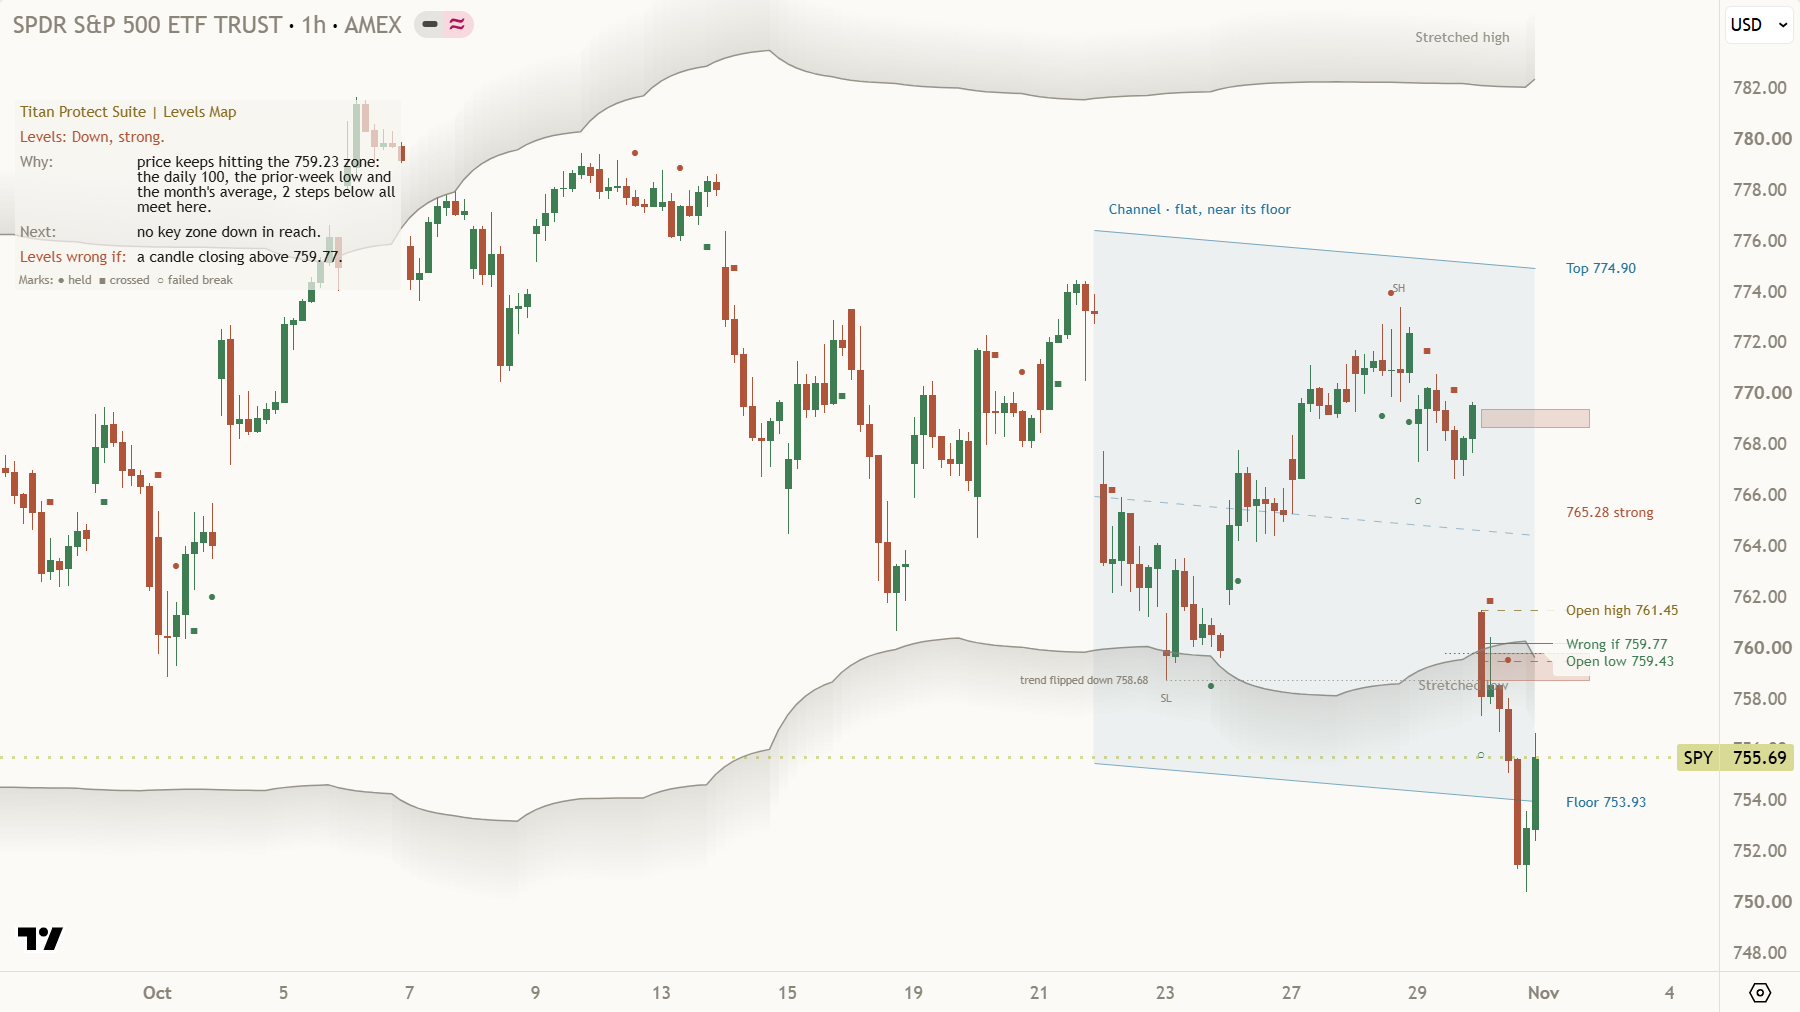
Zone map on a one-hour chart: major, strong and nearest minor zones
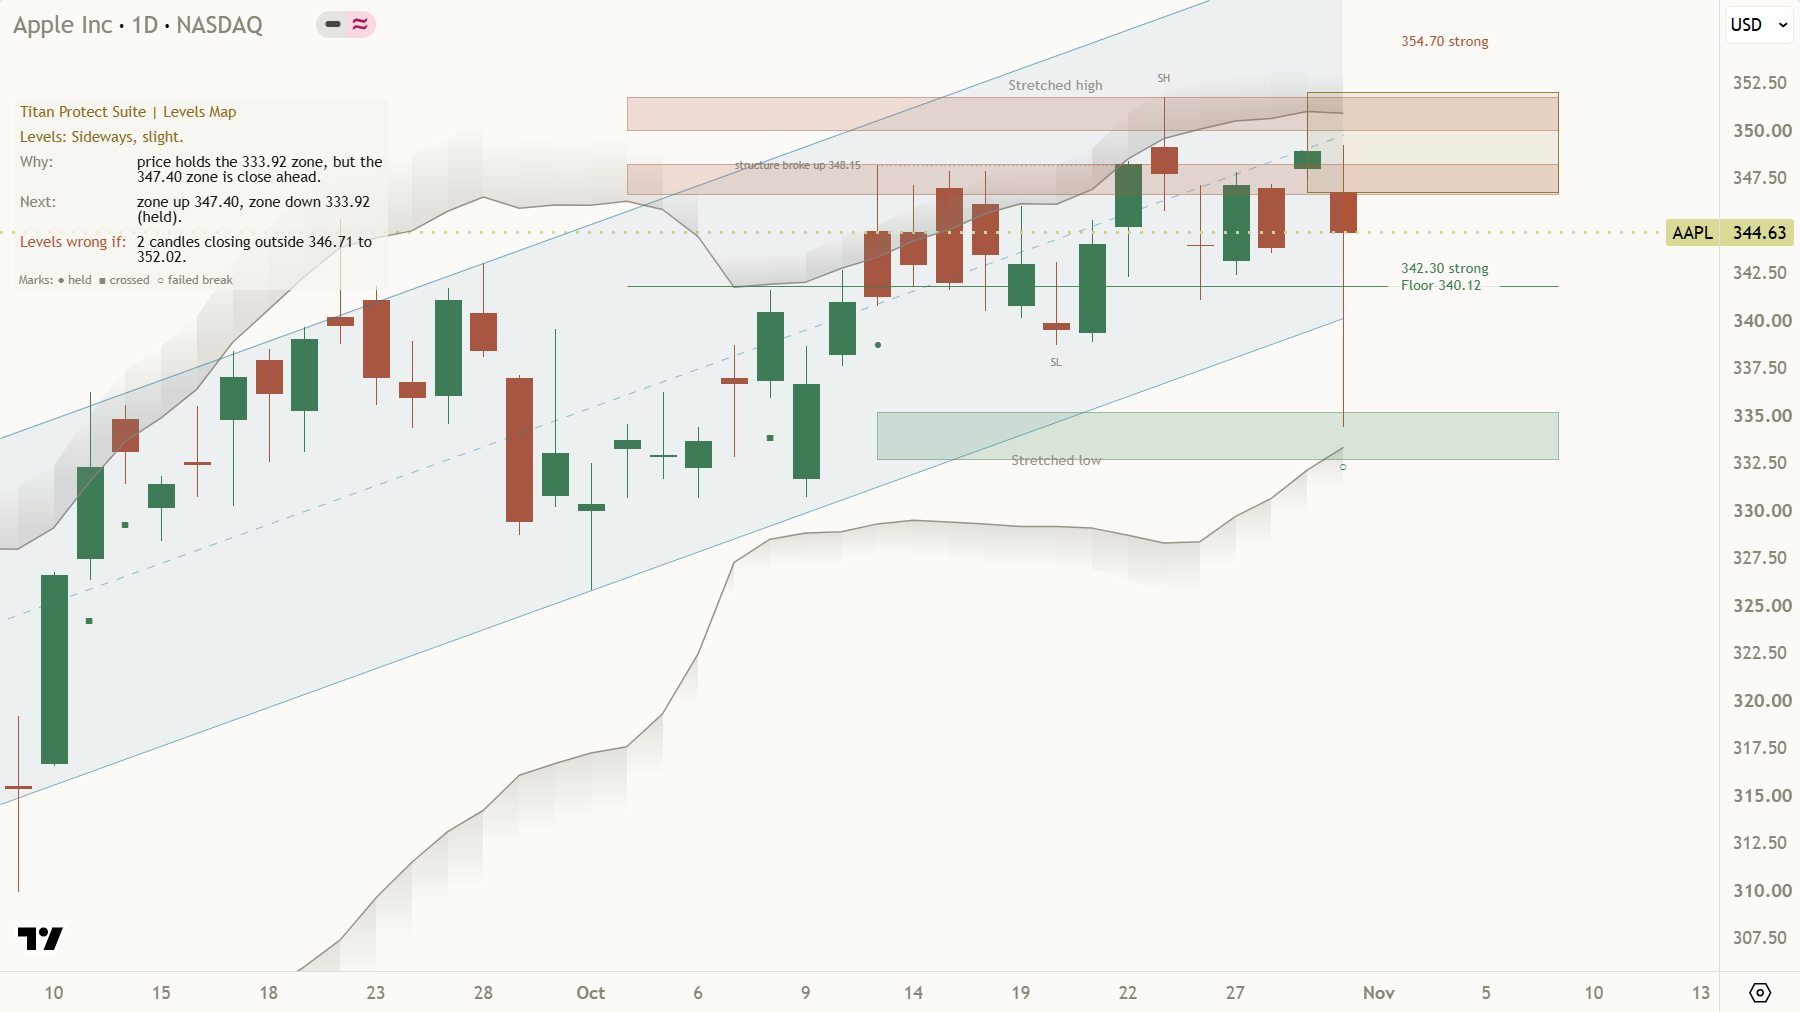
The panel card marks whether a zone held, e.g. "zone down 333.92 (held)"
How to add it
Access comes with membership tiers such as Core.
Membership tier. Invite-only scripts come with membership tiers such as Core.
Launch price $19 a month until 31 December.
Questions
Is it free?
No. It is invite-only on TradingView. It arrives on 12 Nov. Access comes with membership tiers such as Core.
What is a zone?
A price area where several different tools point to the same place, so the area matters more than a single line would.
What do major, strong and minor mean?
How many families of tools agree on the zone. More agreement means a bigger label.
Does it work on any chart?
It works on any chart that has price on TradingView. Parts that need real volume say so in words when a symbol has none.
Is this advice?
No. It is an education tool that maps where price has reacted. You make your own decisions.
Education tool, not financial advice. Trading carries risk, including losing money.