Session Index Performance
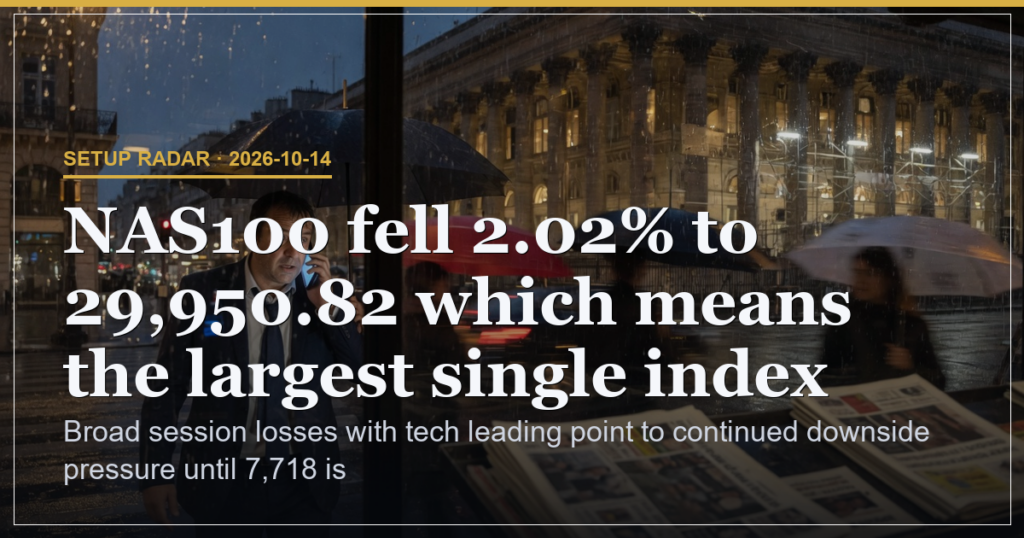
SP500 closed 1.11% lower at 7,718.94 after trading below its 7,774.18 open which means downside pressure held from the bell and produced a 86.51 point net loss on 3.388 billion shares. QQQ fell 1.97% to 728.95 while Nasdaq dropped 2.02% to 29,950.82 which means tech led the broad index weakness and created the largest single benchmark decline of the session. Russell 2000 lost 1.93% to 2,729.53 on the day which means small caps joined the decline and extended the move lower on 37.13 million shares. SPY printed a 1.08% loss to 769.60 after an open at 774.92 which means the 8.41 point drop reinforced the same downside tone across large cap names.
Key Levels and Structure
SPX support rests at 7,693.31 and resistance at 7,789.15 which means any close back above 7,718.94 would flip the immediate tone because the 7,774.18 open now acts as a failed pivot. QQQ low of 726.39 marks the immediate floor while the 740.53 high sets the short term ceiling which means the 14.62 point daily range leaves price 1.97% below its open and keeps downside momentum intact. The 24.73 point prior range from the previous session narrowed into today’s action which means compression tightened without resolution before the close at 7,718.94.
| Index | Close | Change | Implication |
|---|---|---|---|
| SP500 | 7,718.94 | -1.11% | Downside pressure held from the open on 3.388 billion shares |
| Nasdaq | 29,950.82 | -2.02% | Largest single index drop signals tech led weakness |
| Russell 2000 | 2,729.53 | -1.93% | Small caps extended losses alongside the broad tape |
Volatility and Breadth Signals
VIX rose 10.48% to 16.87 from 15.27 which means rising fear priced into equities and aligns with the 1.11% SPX decline. Positioning Pressure shows mixed whale options and a 0.902 put call ratio leave SPY pinned near 777.00 max pain with no clear directional edge. Sector Flow data is empty which means no flow assessment is possible on this slice.
Scenario Triggers and Weights
Reclaim of 7,718.94 carries 35 weight because that level marks the prior close and would shift tone back to neutral. Break below 7,693.31 support carries 40 weight because that floor aligns with the session low and would extend the 1.11% loss. Nasdaq recovery above 30,316 open carries 25 weight because it would offset the 2.02% tech drop and reduce the lead in downside momentum.
Risk Profile
Risk sits at 48% driven by the 2.02% Nasdaq drop which means the largest single index decline keeps the session bias fragile until 7,718 is reclaimed.
| Level | Observation | Consequence |
|---|---|---|
| Beginner | Track which index posts the largest percentage loss | Identifies the sector driving the overall move |
| Intermediate | Compare daily range to prior session range | Shows whether compression or expansion is forming |
| Advanced | Map the gap between close and max pain pin | Reveals the options structure pull on the next session |
Experience Level Observations
Broad session losses with tech leading point to continued downside pressure until 7,718 is reclaimed.
This is analysis, not financial advice. Always manage your risk.