
The GBPUSD Framework Journal for May 2026, newest read at the top. Each dated entry is our read on the close, kept as a living record so the framework can be judged over time. This is analysis, not financial advice.
Saturday 30 May 2026
GBP/USD — Daily Read | Saturday 30 May 2026
GBP/USD | Post Close Setup Daily Read | Data basis: 2026-05-30 close
Where It Sits
Structure
Structurally GBP/USD sits above its short-term moving averages with the daily trend firmly higher. The recent advance has been orderly with no signs of distribution or topping behaviour. The reference anchor at 1.3468 acts as the bias line.
Momentum
Momentum is neutral with internal readings near the centre of the range. That is the signature of a market digesting the prior move. The tape needs a fresh catalyst to commit to direction.
Volume & Flow
Volume data is limited for this session. The positioning read is neutral — no obvious skew in either direction. Watch for flow confirmation on the next session.
Key Levels
| Level | Type | Significance | Action Zone |
|---|---|---|---|
| 1.3582 | Resistance | Upper range target, prior supply zone | Take profits / fade if rejected |
| 1.3506 | Pivot | Mid-range continuation marker | Hold = constructive; lose = consolidation |
| 1.3468 | Session close | Reference anchor for next session | Above = continuation; below = mean revert |
| 1.3407 | Support | Recent range floor, demand zone | Buy zone with defined stop |
| 1.3331 | Major support | Prior breakout retest level | Stop-out below for longs |
Three Scenarios
Continuation
GBP/USD holds the session close at 1.3468 and pushes higher on continued positioning flow. The broader trend remains intact. Watch the dollar tape for confirmation.
Range
GBP/USD opens flat and ranges around 1.3468. Neither side has conviction without a fresh data catalyst. Range trade dominates.
Mean Reversion
GBP/USD breaks below support on a shift in dollar positioning. Mean reversion within the broader trend. Watch for a clean test of support before committing.
Risk Score
Risk sits at Around 50%
Risk sits around 50 per cent. Vix at 15.4 supports a measured risk posture. sentiment at 61 is in greed territory. Currency pairs carry intervention and data-release headline risk. Standard sizing with defined stops — discipline beats conviction.
How to Walk It
Entry / Stop / Target structure:
- Long 1.3407 pullback | Stop 1.3331 | Target 1.3506 | R:R 2:1
- Long 1.3506 breakout | Stop 1.3468 | Target 1.3582 | R:R 1.5:1
- Fade 1.3582 rejection | Stop above resistance | Target 1.3468 | R:R 2:1
Experience-level guidance:
Beginner: Reduce size to half your standard. Trade only the cleanest setup from the entries above. If the tape opens against your bias, do nothing — wait for the second hour, when the institutional flow has tipped its hand.
Intermediate: Use the levels table to define the trading range. Fade the extremes with defined stops, take profits before the round-number resistance levels.
Advanced: The vol regime supports defined-risk structures around the key pivot levels. Keep notional small relative to your book — asymmetric speculation, not core positioning.
Continue Reading
The macro frame driving this read is unpacked in the session briefs:
Check the latest session briefs on the site.
This analysis is for educational and informational purposes only. It does not constitute financial advice. Always manage your risk independently and in accordance with your own financial circumstances.
Thursday 28 May 2026
Ethereum (ETH/USD) — Daily Framework Read | Thursday 28 May 2026
Ethereum (ETH/USD) | Post Close Setup Daily Read | Data basis: 2026-05-28 close
Where It Sits
Structure
Structurally Ethereum (ETH/USD) has pulled back into the session close. The broader trend remains intact on the daily timeframe but the shorter timeframe has softened. The structure is contested near the 2,009.99 level.
Momentum
Momentum is positive but measured. The advance has been orderly without stretching the range. Internal readings are constructive without flagging exhaustion — supportive of continuation.
Volume & Flow
Flow on the session close was measured. Positioning data suggests steady accumulation rather than aggressive directional commitment. The pattern supports continuation rather than reversal.
Key Levels
| Level | Type | Significance | Action Zone |
|---|---|---|---|
| 2,090 | Resistance | Upper range target, prior supply zone | Take profits / fade if rejected |
| 2,037 | Pivot | Mid-range continuation marker | Hold = constructive; lose = consolidation |
| 2,010 | Session close | Reference anchor for next session | Above = continuation; below = mean revert |
| 1,967 | Support | Recent range floor, demand zone | Buy zone with defined stop |
| 1,914 | Major support | Prior breakout retest level | Stop-out below for longs |
Three Scenarios
Continuation
Ethereum (ETH/USD) holds 2,009.99 and pushes higher on continued institutional flow and positive macro mood. The 24/7 tape supports trending moves when traditional markets are risk-on.
Range
Ethereum (ETH/USD) churns around 2,009.99. Range-bound without a fresh catalyst. Weekend liquidity dynamics can create noise.
Mean Reversion
Ethereum (ETH/USD) fades on a risk-off shift or specific headline, breaks support. Crypto gives back faster than it gains — size discipline essential.
Risk Score
Risk sits at Around 65%
Risk sits around 65 per cent. Vix at 15.7 supports a measured risk posture. sentiment at 60 is in greed territory. Crypto carries 24/7 liquidity risk and higher-beta positioning. Standard sizing with defined stops — discipline beats conviction.
How to Walk It
Entry / Stop / Target structure:
- Long 1,967 pullback | Stop 1,914 | Target 2,037 | R:R 2:1
- Long 2,037 breakout | Stop 2,010 | Target 2,090 | R:R 1.5:1
- Fade 2,090 rejection | Stop above resistance | Target 2,010 | R:R 2:1
Experience-level guidance:
Beginner: Reduce size to half your standard. Trade only the cleanest setup from the entries above. If the tape opens against your bias, do nothing — wait for the second hour, when the institutional flow has tipped its hand.
Intermediate: Use the levels table to define the trading range. Fade the extremes with defined stops, take profits before the round-number resistance levels.
Advanced: The vol regime supports defined-risk structures around the key pivot levels. Keep notional small relative to your book — asymmetric speculation, not core positioning.
Continue Reading
The macro frame driving this read is unpacked in the session briefs:
Check the latest session briefs on the site.
This analysis is for educational and informational purposes only. It does not constitute financial advice. Always manage your risk independently and in accordance with your own financial circumstances.
Thursday 28 May 2026
Ethereum (ETH/USD) — Daily Framework Read | Thursday 28 May 2026
Ethereum (ETH/USD) | Pre Asia Setup Daily Read | Data basis: 2026-05-28 close
Where It Sits
Structure
Structurally Ethereum (ETH/USD) has pulled back into the session close. The broader trend remains intact on the daily timeframe but the shorter timeframe has softened. The structure is contested near the 2,022.13 level.
Momentum
Momentum is firm with the daily timeframe showing clear acceleration. Internal readings sit in the upper portion of the range. The risk is not that momentum fails but that it stalls at round-number resistance and triggers profit-taking.
Volume & Flow
Flow on the session close was measured. Positioning data suggests steady accumulation rather than aggressive directional commitment. The pattern supports continuation rather than reversal.
Key Levels
| Level | Type | Significance | Action Zone |
|---|---|---|---|
| 2,133 | Resistance | Upper range target, prior supply zone | Take profits / fade if rejected |
| 2,059 | Pivot | Mid-range continuation marker | Hold = constructive; lose = consolidation |
| 2,022 | Session close | Reference anchor for next session | Above = continuation; below = mean revert |
| 1,963 | Support | Recent range floor, demand zone | Buy zone with defined stop |
| 1,889 | Major support | Prior breakout retest level | Stop-out below for longs |
Three Scenarios
Continuation
Ethereum (ETH/USD) holds 2,022.13 and pushes higher on continued institutional flow and positive macro mood. The 24/7 tape supports trending moves when traditional markets are risk-on.
Range
Ethereum (ETH/USD) churns around 2,022.13. Range-bound without a fresh catalyst. Weekend liquidity dynamics can create noise.
Mean Reversion
Ethereum (ETH/USD) fades on a risk-off shift or specific headline, breaks support. Crypto gives back faster than it gains — size discipline essential.
Risk Score
Risk sits at Around 65%
Risk sits around 65 per cent. Vix at 16.3 supports a measured risk posture. sentiment at 61 is in greed territory. Crypto carries 24/7 liquidity risk and higher-beta positioning. Standard sizing with defined stops — discipline beats conviction.
How to Walk It
Entry / Stop / Target structure:
- Long 1,963 pullback | Stop 1,889 | Target 2,059 | R:R 2:1
- Long 2,059 breakout | Stop 2,022 | Target 2,133 | R:R 1.5:1
- Fade 2,133 rejection | Stop above resistance | Target 2,022 | R:R 2:1
Experience-level guidance:
Beginner: Reduce size to half your standard. Trade only the cleanest setup from the entries above. If the tape opens against your bias, do nothing — wait for the second hour, when the institutional flow has tipped its hand.
Intermediate: Use the levels table to define the trading range. Fade the extremes with defined stops, take profits before the round-number resistance levels.
Advanced: The vol regime supports defined-risk structures around the key pivot levels. Keep notional small relative to your book — asymmetric speculation, not core positioning.
Continue Reading
The macro frame driving this read is unpacked in the session briefs:
Check the latest session briefs on the site.
This analysis is for educational and informational purposes only. It does not constitute financial advice. Always manage your risk independently and in accordance with your own financial circumstances.
Tuesday 26 May 2026
Cable has been one of the cleaner stories in FX this week. The pair spent the first half of the week in a controlled pullback, found demand at a well-established level, and then pushed higher into the Friday close. What the structure is telling you is that this is not a speculative squeeze — buyers are stepping in at the same zones repeatedly, and sellers are failing to break anything of significance. That kind of behaviour builds confidence in the directional bias.
The trend line from the mid-May lows is intact. The analysis flagged the pair as a continuation setup after trend lines broke to the upside at a key level, and the follow-through has been measured rather than explosive. That matters. Explosive moves often reverse. Measured advances, with each bar closing in the upper portion of its range, tend to continue. The momentum picture is tilted in Sterling’s favour and the Dollar’s broad weakness this week has been the tailwind that Cable has consistently exploited.
Into the long weekend, the 1.3490 to 1.3510 zone is where the buyers need to hold if this structure is to remain credible. A clean weekly close above 1.3540 sets up a potential push toward the 1.3620 to 1.3650 area, which is where the next meaningful resistance sits. The risk heading into Tuesday is a gap, either way, driven by weekend newsflow rather than anything structural. Position sizing accordingly.
| Level | Price | Notes |
|---|---|---|
| Entry Zone | 1.3490 – 1.3515 | Reclaimed trend zone, weekly demand area |
| Stop | 1.3440 | Below structural support, invalidates continuation |
| Target 1 | 1.3625 | Prior resistance cluster, measured move |
| Target 2 | 1.3700 | Extension target, psychological round number |
| R:R | 2.6 : 1 | To Target 1 from mid-entry |
The long bias is clear, but Cable heading into a UK bank holiday Monday carries elevated uncertainty. Liquidity thins out markedly, and gaps on the open are more common than in a normal week. The Dollar’s short-term trajectory is the key variable. If US data over the weekend resets Dollar expectations, Cable can gap lower through support without a clean entry. The structural picture earns a mid-range risk score because the trend is well-defined, but the calendar context pushes the score up from where it would otherwise sit.
If you are already long from earlier in the week, the Friday close was a good moment to review your stop and consider taking partial profits. The 1.3625 area is a sensible first target and there is no harm in banking some gains before a bank holiday weekend. For traders looking to enter fresh, the better play is to wait for Tuesday’s open, see how the pair reacts, and only commit if the 1.3490 to 1.3510 zone holds cleanly on any initial test. Chasing price on Sunday evening reopens in thin conditions is how accounts get hurt.
Saturday 23 May 2026
Sterling / Dollar (GBP/USD) — Weekend Daily Read
Framework Bias
LONG BIAS (GBP/USD)
Cable closed Friday at 1.3433, essentially flat on the day after testing both 1.3459 on the upside and 1.3415 on the downside. The pair is consolidating at the top of a multi-week range rather than breaking down from it. That is a bullish characteristic. When a currency pair trades sideways near its highs after a sustained rally, the default lean is for continuation rather than reversal.
Sterling has been one of the stronger G10 currencies in recent weeks. The UK economic data has surprised to the upside on growth and the Bank of England has maintained a cautious stance on rate cuts. Both factors are supportive for GBP. The US dollar, by contrast, has weakened as the DXY dropped from above 104 earlier in the year to 99.32. That structural dollar weakness is the dominant driver of cable’s rally.
The 1.35 level is the big psychological target that the market will be watching. If cable can sustain above 1.3420 on Monday’s thin trading and clear 1.3459 on Tuesday’s London open, the 1.35 and then 1.36 levels come into play. The framework leans long but the double-holiday liquidity gap demands careful position sizing.
Key Levels
| Level Type | Price | Note |
|---|---|---|
| Major Resistance | 1.3600 | Multi-year high zone and key upside target |
| Near Resistance | 1.3500 | Psychological round number |
| Near Resistance | 1.3459 | Friday intraday high |
| Current Price | 1.3433 | Friday close |
| Near Support | 1.3415 | Friday intraday low and near-term demand |
| Key Support | 1.3350 | Prior consolidation and weekly demand |
| Major Support | 1.3200 | Monthly demand and prior breakout |
Trade Framework
| Scenario | Entry Zone | Stop | Target | R:R |
|---|---|---|---|---|
| Long on Tuesday London open dip | 1.3415 to 1.3430 | 1.3360 | 1.3500 | approx 1.9:1 |
| Long on 1.3460 break and hold | 1.3465 | 1.3410 | 1.3550 | approx 1.6:1 |
| Short on support failure | 1.3350 break | 1.3400 | 1.3200 | approx 3.0:1 |
Confidence level: around 61%. The structural case for cable higher is intact. The 61% reflects the near-term consolidation and double-holiday liquidity risk. Tuesday’s London open, the first proper two-way liquidity event, will be the real test.
Weekend Context
Cable is trading at its highest levels since 2022, driven by a combination of dollar weakness and sterling resilience. The UK-US trade deal discussions that progressed in the first half of 2026 provided an additional sterling positive, reducing the Brexit-discount that cable had carried for years.
The Bank of England’s next meeting is the key near-term calendar event. Any forward guidance that suggests fewer rate cuts than the market expects would be a near-term GBP positive. Conversely, data showing UK growth softening sharply would give the BoE more reason to cut, which could weigh on sterling.
For the weekend specifically: thin Monday FX liquidity can produce spiky moves in both directions that are not representative of the underlying trend. Do not be shaken out of a well-considered position by a Monday blip in low-volume conditions. Wait for Tuesday’s London open to assess the real picture.
Friday 22 May 2026
FX | Friday 22 May 2026
GBP/USD: Sterling Holds Ground but the Week Tells a Bigger Story
Thursday close: 1.3429 | Daily change: -0.04% | Bias: Cautiously Bullish
Current Read
Sterling is doing what it has been doing all week: holding. A four-pip loss on Thursday is not a story. The story is that GBP/USD has spent most of May parked in a corridor between 1.3350 and 1.3500, and neither buyers nor sellers have been willing to commit. That kind of quiet usually ends with a sharp move, not another quiet day.
The dollar side of this pair has been equally uninspired. DXY is sitting just below 100, a level that matters psychologically, but without a clear catalyst to push it either way. With UK markets wrapping up a shortened week heading into the Bank Holiday on Monday, positioning into Friday’s close is likely to be light. Light positioning means thin liquidity, which means the moves that do happen can exaggerate quickly.
The broader macro picture for sterling remains supported. UK inflation data released earlier this month came in hotter than expected, which keeps the Bank of England on a cautious path. That relative rate story works in sterling’s favour against a dollar that is under its own ceiling pressure.
Key Levels
What Changed Thursday
Very little changed in absolute terms. The pair dipped slightly through the New York morning, recovered, and closed four pips in the red. What is worth noting is that the recovery held above 1.3400, which is a line that sellers tried to crack twice this week without success. Every failed breakdown at a level like that adds pressure to the upside.
Dollar strength was marginal. US weekly jobless claims came in broadly as expected, which did nothing to shift the Federal Reserve rate expectations that are currently keeping the dollar pinned. With no fresh catalyst, the DXY drift higher of 0.04% was more noise than signal.
Friday Scenarios
Bull Case
Price holds above 1.3400 through the London open and builds into a push toward 1.3460. A clean break and hold there opens 1.3500 into the close. Requires dollar weakness to materialise or UK data to surprise. Thin Friday liquidity could amplify the move if stops above 1.3460 are triggered.
Base Case
Continued consolidation between 1.3380 and 1.3460. Friday is the day before a UK Bank Holiday weekend, so positioning is likely to remain cautious. The pair drifts sideways into the close with no directional conviction from either side.
Bear Case
A break below 1.3380 opens the door to 1.3350 and potentially 1.3320. This would require either a dollar bid driven by risk-off sentiment or a disappointing UK data print. Below 1.3350, the monthly thesis weakens significantly.
Sizing and Approach
Friday pre-Bank Holiday setups carry a specific risk: the move that looks real at 9am London time can evaporate completely by noon as European desks square up. Reduce size by at least a third versus your standard approach. If you are not already in a position from lower in the week, Friday is not the day to build a fresh directional bet in GBP/USD.
Stops should be wider than normal given the liquidity conditions. A 20-pip stop that works fine on a Tuesday can get run on a pre-holiday Friday without the move ever having any real conviction behind it. If the pair does push toward 1.3500, that is a level worth watching for a fade rather than a continuation trade.
Cross-References
- DXY: The dollar index at 99.23 is the single most important input for this pair today. Watch whether it holds below 100 or makes a push through it.
- EUR/USD: Euro is in a similar pattern at 1.1617. If EUR/USD starts sliding, GBP/USD will feel the drag regardless of domestic UK factors.
- Risk sentiment: Equities calm and gold steady is a constructive backdrop for sterling. Any risk-off spike changes the picture quickly.
- USD/JPY: The yen pressure story at 159 has dollar implications across all pairs. Watch for any intervention headline that could spike dollar selling broadly.
Sunday 17 May 2026
—
title: “GBPUSD Weekly Review : 16 May 2026”
date: “2026-05-16”
instrument: “GBPUSD”
type: ticker-review
—
Weekend Ticker Review | 16 May 2026
GBPUSD : Worst G10 for a Reason. Six of Them.
GBPUSD | Spot FX | 12-16 May 2026
1. Week at a Glance
| Friday Close | 1.3324 |
| Friday Move | -1.50% : worst G10 performer |
| COT Positioning | -11,200 contracts WoW : largest FX shift in dataset |
| Rate vs USD | BoE 5.25% but ambiguous path vs Fed holding from strength |
| Current Account | Deficit : requires constant inflows; fails in dollar-strength regime |
| Entry Zone | 1.3350-1.3420 (bounce) |
| Stop | 1.3460 closing basis |
| Target | 1.3200 (R:R ~2.2:1) |
| Signal | SHORT STANDARD : highest-conviction FX setup in the framework |
2. What Happened
GBP fell 1.50% on Friday. That’s not a bad day : that’s a signal. EUR fell 0.73%. AUD fell 0.85%. NZD fell 1.07%. GBP fell 1.50%. When the worst performer in G10 is twice the magnitude of the second-worst, you are watching a structural move, not a noise event.
The trigger was hot US retail sales removing rate-cut expectations and driving the 10-year above 4.50%. But GBP’s severity of the move reveals pre-existing structural weakness that the catalyst just exposed. The pound was the most fragile G10 currency going into that print. It showed.
Institutions had already positioned for this. COT data for the week ending 12 May shows -11,200 GBP contracts. The largest single FX positioning shift in the entire dataset. They built the short before the data landed. Friday’s move confirmed their read was correct.
There is no institutional floor in GBP on dips right now. The COT structure tells you that. When you see -11,200 contracts pre-built on the short side, bounces are for selling, not for stepping in front of.
3. What the Alpha Insights Said
FX Focus : Post 11
Six structural factors documented in full. (1) Rate divergence trap: BoE holds under duress versus Fed holds from strength : mechanically different signals despite similar rates. (2) Current account deficit: requires constant foreign capital; fails when dollar strengthens globally. (3) Growth trajectory divergence: US retail sales hot, UK PMI soft. (4) Political and policy uncertainty: fiscal constraints, post-Brexit friction, opaque BoE path. (5) COT pre-positioning: -11,200 WoW, largest FX shift. (6) Carry asymmetry: 25bps yield pickup insufficient to compensate for structural uncertainty premium. All six compound simultaneously.
Institutional Flow : Post 07
COT GBP -11,200 contracts week of 12 May : pre-built before Friday’s retail sales print. Confirmed as the highest-conviction institutional FX short in the dataset. No institutional support floor in GBP on dips. Dark pool showed no GBP accumulation during the session. The smart money was already out before the catalyst hit.
Signals : Post 15
GBP/USD is Signal 2 with eight confirming layers. Only crude oil (Signal 1, ten layers) has more confirmation behind it. Signal confidence: medium-high. Sizing: STANDARD. Entry: 1.3350-1.3420 bounce. Stop: 1.3460 closing basis. Target: 1.3200. R:R approximately 2.2:1. Condition: DXY above 98.80. Invalidation: DXY closes below 98.80 with conviction.
Setup Radar : Post 04
GBP/USD short was the primary FX setup identified. Target 1.3200 with stop at 1.3400 resistance. The rate divergence was identified as structural. Post 11 added the six-factor structural framework on top. The setup was identified early in the sequence and confirmed by every subsequent post that touched FX.
News : Post 17
Thursday UK CPI and BoE commentary is listed as a medium-impact event specifically for GBP short confirmation. The framing is important: either direction amplifies the structural problem. A dovish BoE accelerates the move toward 1.3200. A hawkish BoE introduces growth headwinds that also don’t help sterling. There is no clean positive outcome for GBP this week.
4. Key Levels
| Level | Price | Significance |
|---|---|---|
| Short Entry Zone | 1.3350-1.3420 | Bounce to sell : wait for this level, don’t chase |
| Stop (Close) | 1.3460 | Thesis fails : DXY reversal implied below here |
| Target | 1.3200 | Structural short target : six-factor basis |
| DXY Floor | 98.80 | GBP short condition : DXY must stay above this |
| R:R | ~2.2:1 | At entry 1.3380 : adjust based on actual entry |
| BoE Event | Thursday | Either direction amplifies structural GBP problem |
5. Signal + Bias
Signal: SHORT STANDARD. Highest-conviction FX setup in the entire framework. Eight confirming layers. Pre-built institutional positioning confirmed by COT.
Entry: Wait for a bounce to 1.3350-1.3420. Do not chase the move lower. GBP fell 1.50% Friday : you want to sell the retracement, not the continuation.
Stop: 1.3460 on a closing basis. That level implies DXY has reversed below 98.80 and the thesis is broken. No arguments : close the trade.
Target: 1.3200. Six structural factors driving it. Each one is independent. All six are working simultaneously.
Sizing: Standard : but with VIX at 18.43 applying the 30-40% reduction rule across the book. Wider stops reflect the elevated vol regime, not uncertainty about the direction.
6. Next Week Setup
Thursday is the most important domestic event. UK CPI and BoE commentary will either confirm the structural short or create a brief pause. A dovish BoE sends GBP toward 1.3200 directly. A hawkish BoE introduces growth headwinds that also weigh on sterling : just via a different route. There is no bullish outcome from Thursday’s BoE for GBP.
FOMC minutes Wednesday 14:00 ET determines the DXY direction. Hawkish-hold confirms dollar strength, GBP short accelerates. Dovish surprise reverses DXY below 98.80 : close the trade. That’s the only invalidation. Watch the DXY level, not the GBP level.
Monday is the first test. Watch whether GBP can hold above 1.3300 or continues drifting lower. A gap down below 1.3300 with volume shortens the distance to the 1.3200 target. A bounce toward 1.3380-1.3420 is your entry window.
The scalp version of this trade: bounces to 1.3350-1.3380 with a target of 1.3280-1.3300 and stop at 1.3420. That’s the intraday expression for shorter timeframe participants.
7. Risk Score
Around 60% risk for GBP longs / Around 40% risk for the short
The short thesis has eight confirming layers, COT pre-positioning of -11,200 contracts, and six independent structural factors. The single risk to the short is DXY breaking below 98.80. Everything else : BoE, growth, current account, carry asymmetry : points the same direction. This is the highest-conviction FX trade in the framework. The risk score here is for the six structural headwinds facing anyone holding GBP long, not for the short position itself.
Saturday 16 May 2026
—
title: “GBPUSD Weekly Review : 16 May 2026”
date: “2026-05-16”
instrument: “GBPUSD”
type: ticker-review
—
Weekend Ticker Review | 16 May 2026
GBPUSD : Worst G10 for a Reason. Six of Them.
GBPUSD | Spot FX | 12-16 May 2026
1. Week at a Glance
| Friday Close | 1.3324 |
| Friday Move | -1.50% : worst G10 performer |
| COT Positioning | -11,200 contracts WoW : largest FX shift in dataset |
| Rate vs USD | BoE 5.25% but ambiguous path vs Fed holding from strength |
| Current Account | Deficit : requires constant inflows; fails in dollar-strength regime |
| Entry Zone | 1.3350-1.3420 (bounce) |
| Stop | 1.3460 closing basis |
| Target | 1.3200 (R:R ~2.2:1) |
| Signal | SHORT STANDARD : highest-conviction FX setup in the framework |
2. What Happened
GBP fell 1.50% on Friday. That’s not a bad day : that’s a signal. EUR fell 0.73%. AUD fell 0.85%. NZD fell 1.07%. GBP fell 1.50%. When the worst performer in G10 is twice the magnitude of the second-worst, you are watching a structural move, not a noise event.
The trigger was hot US retail sales removing rate-cut expectations and driving the 10-year above 4.50%. But GBP’s severity of the move reveals pre-existing structural weakness that the catalyst just exposed. The pound was the most fragile G10 currency going into that print. It showed.
Institutions had already positioned for this. COT data for the week ending 12 May shows -11,200 GBP contracts. The largest single FX positioning shift in the entire dataset. They built the short before the data landed. Friday’s move confirmed their read was correct.
There is no institutional floor in GBP on dips right now. The COT structure tells you that. When you see -11,200 contracts pre-built on the short side, bounces are for selling, not for stepping in front of.
3. What the Alpha Insights Said
FX Focus : Post 11
Six structural factors documented in full. (1) Rate divergence trap: BoE holds under duress versus Fed holds from strength : mechanically different signals despite similar rates. (2) Current account deficit: requires constant foreign capital; fails when dollar strengthens globally. (3) Growth trajectory divergence: US retail sales hot, UK PMI soft. (4) Political and policy uncertainty: fiscal constraints, post-Brexit friction, opaque BoE path. (5) COT pre-positioning: -11,200 WoW, largest FX shift. (6) Carry asymmetry: 25bps yield pickup insufficient to compensate for structural uncertainty premium. All six compound simultaneously.
Institutional Flow : Post 07
COT GBP -11,200 contracts week of 12 May : pre-built before Friday’s retail sales print. Confirmed as the highest-conviction institutional FX short in the dataset. No institutional support floor in GBP on dips. Dark pool showed no GBP accumulation during the session. The smart money was already out before the catalyst hit.
Signals : Post 15
GBP/USD is Signal 2 with eight confirming layers. Only crude oil (Signal 1, ten layers) has more confirmation behind it. Signal confidence: medium-high. Sizing: STANDARD. Entry: 1.3350-1.3420 bounce. Stop: 1.3460 closing basis. Target: 1.3200. R:R approximately 2.2:1. Condition: DXY above 98.80. Invalidation: DXY closes below 98.80 with conviction.
Setup Radar : Post 04
GBP/USD short was the primary FX setup identified. Target 1.3200 with stop at 1.3400 resistance. The rate divergence was identified as structural. Post 11 added the six-factor structural framework on top. The setup was identified early in the sequence and confirmed by every subsequent post that touched FX.
News : Post 17
Thursday UK CPI and BoE commentary is listed as a medium-impact event specifically for GBP short confirmation. The framing is important: either direction amplifies the structural problem. A dovish BoE accelerates the move toward 1.3200. A hawkish BoE introduces growth headwinds that also don’t help sterling. There is no clean positive outcome for GBP this week.
4. Key Levels
| Level | Price | Significance |
|---|---|---|
| Short Entry Zone | 1.3350-1.3420 | Bounce to sell : wait for this level, don’t chase |
| Stop (Close) | 1.3460 | Thesis fails : DXY reversal implied below here |
| Target | 1.3200 | Structural short target : six-factor basis |
| DXY Floor | 98.80 | GBP short condition : DXY must stay above this |
| R:R | ~2.2:1 | At entry 1.3380 : adjust based on actual entry |
| BoE Event | Thursday | Either direction amplifies structural GBP problem |
5. Signal + Bias
Signal: SHORT STANDARD. Highest-conviction FX setup in the entire framework. Eight confirming layers. Pre-built institutional positioning confirmed by COT.
Entry: Wait for a bounce to 1.3350-1.3420. Do not chase the move lower. GBP fell 1.50% Friday : you want to sell the retracement, not the continuation.
Stop: 1.3460 on a closing basis. That level implies DXY has reversed below 98.80 and the thesis is broken. No arguments : close the trade.
Target: 1.3200. Six structural factors driving it. Each one is independent. All six are working simultaneously.
Sizing: Standard : but with VIX at 18.43 applying the 30-40% reduction rule across the book. Wider stops reflect the elevated vol regime, not uncertainty about the direction.
6. Next Week Setup
Thursday is the most important domestic event. UK CPI and BoE commentary will either confirm the structural short or create a brief pause. A dovish BoE sends GBP toward 1.3200 directly. A hawkish BoE introduces growth headwinds that also weigh on sterling : just via a different route. There is no bullish outcome from Thursday’s BoE for GBP.
FOMC minutes Wednesday 14:00 ET determines the DXY direction. Hawkish-hold confirms dollar strength, GBP short accelerates. Dovish surprise reverses DXY below 98.80 : close the trade. That’s the only invalidation. Watch the DXY level, not the GBP level.
Monday is the first test. Watch whether GBP can hold above 1.3300 or continues drifting lower. A gap down below 1.3300 with volume shortens the distance to the 1.3200 target. A bounce toward 1.3380-1.3420 is your entry window.
The scalp version of this trade: bounces to 1.3350-1.3380 with a target of 1.3280-1.3300 and stop at 1.3420. That’s the intraday expression for shorter timeframe participants.
7. Risk Score
Around 60% risk for GBP longs / Around 40% risk for the short
The short thesis has eight confirming layers, COT pre-positioning of -11,200 contracts, and six independent structural factors. The single risk to the short is DXY breaking below 98.80. Everything else : BoE, growth, current account, carry asymmetry : points the same direction. This is the highest-conviction FX trade in the framework. The risk score here is for the six structural headwinds facing anyone holding GBP long, not for the short position itself.
Friday 15 May 2026
GBP/USD (Cable) — Daily Read | Friday 15 May 2026
Post-CPI close | 1.3445 — dollar bid hit, but long structure intact | Not financial advice
WHAT CHANGED FROM YESTERDAY
Yesterday the read warned of a distribution pattern: rising price with selling volume, and said “longs here are swimming upstream against the day’s volume.” That call was precise. Cable closed at 1.3445 (-0.68% on the session). The dollar bid that CPI triggered — DXY moving from 98.47 to 98.89 (+0.42%) — pushed through the distribution warning cleanly. What has changed today is that the close lands at 1.3445 inside the long-term rising structure. The distribution was a near-term warning, not a structural break. The question on Friday is whether the dollar continues to strengthen on Retail Sales (which would press cable lower again) or whether the post-CPI short-covering in the dollar completes, removing the headwind.
HEADLINE STATE: CAUTION — Dollar Squaring Paradox, Long Structure Still Intact
The Overwatch identified the dollar direction after position squaring completes as the key unresolved question into next week. DXY 98.89 is post-CPI short-covering, not structural dollar strength. Under a confirmed rate-cut path, the dollar’s medium-term direction is lower. But before that medium-term direction reasserts, the short-covering mechanics need to complete. Cable at 1.3445 is caught in that transition window. Strong Retail Sales today extends the dollar short-covering. In-line data or weak data probably lets cable stabilise. The long-term rising structure remains intact unless 1.3380 breaks on a daily close.
Key Levels
| Level | Price | Significance |
|---|---|---|
| Thursday close | 1.3445 | -0.68% — distribution warning played out as called |
| Long-term structure support | 1.3380 | Daily close below here = structural break of the rising trend |
| Resistance now | 1.3520–1.3540 | Prior Thursday distribution zone — now overhead resistance |
| Strong RS (dollar extends) | 1.3400–1.3430 | Dollar short-covering continues — cable under pressure |
| Weak RS (dollar fades) | 1.3470–1.3510 | Squaring completes — cable stabilises, tests prior resistance |
| DXY | 98.89 | Post-CPI short-covering — Overwatch: medium-term direction lower under rate-cut path |
Structure · Momentum · Flow
Structure
Long-term rising structure intact at 1.3445. The 0.68% drop is a dip inside the trend, not a structural break. Unless 1.3380 is lost on a daily close, the uptrend is still in place.
Momentum
Short-term negative. The Thursday drop broke near-term momentum. This is a cable looking for direction until the dollar squaring completes. Do not read the short-term momentum as the medium-term story.
Flow
Dollar flow dominates cable right now. This is not a sterling story — it is a DXY story. Until the post-CPI short-covering in the dollar completes, cable’s direction is dictated by the dollar, not by UK fundamentals.
| Bias | NEUTRAL — dollar squaring determines direction today |
| Risk estimate | Around 40% — binary on Retail Sales print |
| Structural floor | 1.3380 — hold = trend intact, lose = structural break |
| Medium-term | Bullish — rate-cut path = lower dollar = higher cable |
| Week carry | Unresolved — dollar squaring is next week’s FX watch |
This content is for educational and informational purposes only and does not constitute financial advice. Past analysis does not guarantee future results. Always conduct your own research before making any trading decisions.
Thursday 14 May 2026
GBP/USD (Cable) — Daily Read | Thursday 14 May 2026
Post-CPI mid-session | Dollar bid on lower inflation | Not financial advice
WHAT CHANGED FROM YESTERDAY
Yesterday cable was flagged as CAUTION LONG — structure rising but momentum fading, with volume coming in on the sell side. The analysis described it as a distribution pattern and said “longs here are swimming upstream against the day’s volume.” That read was exact. GBP/USD is now at 1.3445 (-0.68%). The distribution that was identified — rising price, selling volume — resolved to the downside as the dollar bid hit after CPI. The analysis read the selling volume correctly.
HEADLINE STATE: UNDER PRESSURE — Dollar Bid, Cable Down 0.68%
CPI lower = good inflation news = dollar bought. This is the counterintuitive part of “good CPI”: lower inflation does not always mean dollar falls. When the market interprets CPI as “soft landing confirmed,” it bids risk assets and buys dollars as a sign of US economic confidence. Cable is the casualty. The long-term rising structure identified yesterday is still intact — 1.3445 is not a structural breakdown — but the near-term momentum is with the sellers. This is a dollar story, not a sterling story.
Key Levels
| Level | Price | Significance |
|---|---|---|
| Current price | 1.3445 | -0.68% — dollar bid confirmed |
| Prior close (est.) | ~1.3537 | Structure was rising here — distribution warned of this drop |
| DXY | 98.79 (+0.31%) | Dollar index bid — headwind for all dollar pairs |
| Long-term structure | Rising | Still intact — this is a dip, not a structural break |
| Near-term momentum | Selling | Distribution resolved — sellers in control near-term |
Structure · Momentum · Flow
Structure
Long-term rising structure is intact but being tested. 1.3445 is a pullback within a rising trend, not a reversal. The line between pullback and breakdown is a structural support level — watch where cable finds a floor.
Momentum
The distribution pattern called yesterday has fully resolved. Sellers won the near-term battle. Momentum is now short-term bearish even within a longer-term bull structure. Do not fight the near-term direction.
Flow
DXY up, cable down. This is pure dollar flow. Sterling itself has not made a major independent move — it is being dragged by the dollar bid. Flow context favours dollar over sterling near-term.
TODAY’S BIAS: SHORT NEAR-TERM, LONG MACRO — Wait for Dollar Bid to Exhaust
Anyone who was long cable yesterday and heeded the distribution warning avoided this -0.68% drop. The near-term trade is with the sellers as long as the dollar bid holds. The macro structure is still rising and this is a pullback opportunity for patient longs — but not yet. Wait for the dollar to show signs of exhaustion before re-entering long cable.
Risk: Around 45%
The near-term direction is down with the dollar bid. The risk is in the long-term structure holding and turning this into a buy-the-dip opportunity. The danger is if the dollar bid accelerates and cable breaks its longer-term rising structure. That changes the entire read.
By Experience Level
New to this
Yesterday’s read said: rising structure but selling volume. That is distribution. Distribution means institutions are selling into rising prices. When they finish selling, price drops. That is what happened today. Reading volume against price is one of the most powerful skills in markets.
Developing
Cable is falling because the dollar is being bid — not because sterling is being sold specifically. When the driver is external (DXY), the recovery depends on when that external driver exhausts. Watch DXY for the turn signal on cable longs.
Experienced
Dollar up, equities up, gold down slightly — the market is buying US assets broadly. That is the “CPI validates the thesis” trade. Cable is collateral damage. The question for the swing trade is whether this dollar bid is sustained or a one-day CPI reaction. Historical CPI dollar moves often reverse within 24-48 hours. That is where the cable long opportunity reappears.
This is a daily analysis read for educational and informational purposes only. Nothing here is financial advice. Past performance is not a guide to future results. Trading carries significant risk of loss. Always apply your own risk management.
Wednesday 13 May 2026
GBP/USD (Cable) — Daily Framework Read | Wednesday 13 May 2026
analysis as of pre-market | CPI 3.8% shock context | Not financial advice
HEADLINE STATE: CAUTION LONG — Structure Rising but Momentum Fading
Cable is in a structurally rising trend across all timeframes — that is a meaningful base. But momentum is fading and volume is coming in on the sell side. When structure says up and flow says down, you have a distribution pattern forming. This is not the setup to buy into aggressively. Longs taken here are swimming upstream against the day’s volume. The better trade is to wait for either a momentum reset or a volume confirmation on the buy side.
Key Levels to Watch
| Reference | Note |
|---|---|
| Structure bias | Rising — all timeframes aligned upward |
| Momentum state | Fading — buyers losing grip on pace |
| Volume bias | Selling — volume pressing against the trend |
| DXY context | DXY mostly short — supportive of GBP/USD upside if holds |
| Framework state | Caution — not a clean directional trade today |
Structure · Momentum · Flow
Structure
All timeframes show a rising structure — that is the most positive element of this read. The trend exists and has not broken. If you are already long from lower levels, the trend is still your friend. New entries into this structure need more than a rising line — they need momentum support.
Momentum
Fading. This means the pace of the upward move is slowing down. Buyers are still outnumbering sellers (structure intact) but they are buying with less force. In FX this often precedes a pullback or consolidation before the trend resumes — or it marks a top if sellers overwhelm.
Flow
Volume is on the sell side — this is the warning. When sellers are more active by volume in an uptrend, it signals distribution. Professionals may be lightening long exposure at these levels. DXY’s short bias provides a counterweight, but volume beats narrative in the short term.
Long Case vs Short Case
LONG CASE (wait for pullback)
- Structure rising across all timeframes — trend intact
- DXY mostly short — GBP/USD benefits from dollar weakness
- CPI 3.8% complicates Fed cuts — USD stays pressured
- Long from a pullback into structure is the valid approach
- Let momentum reset before entering
SHORT CASE (volume tells a story)
- Volume selling against a fading momentum trend is a warning
- Momentum fade near highs often signals a pullback
- If structure cracks, shorts become valid with structure break
- Counter-trend short against a rising structure is high risk
- Shorts only on confirmed structure break, not before
Sizing Guidance
Reduced size if entering today. The conflict between rising structure and volume selling means any entry carries extra uncertainty. Ideal play: wait for a pullback into structure support then enter long with momentum confirmation. Do not chase the trend when volume is pointing the other way.
Existing longs: trail stops into structure. New longs: patience until momentum confirms.
Tuesday 12 May 2026
Daily Framework Read · Tuesday 12 May 2026
British Pound (GBPUSD) — Daily Framework Read | Tuesday 12 May 2026
Published pre-market · Time-gated member content
Current State
WATCHING — Pulling Back
Long bias: 88%. Structure is bullish across all timeframes, but momentum is fading and sellers are active. Currently pulling back toward the 1.35449 stop zone.
Key Levels
| Level | Price | Notes |
|---|---|---|
| Key Support | 1.35449 | Critical level — must hold for long case |
| Trend Direction | Rising | All structural timeframes bullish |
| Current Risk | Fading momentum | Sellers active, not yet in profit |
| Entry Trigger | 1.35449 hold + momentum turn | Requires confirmation before committing |
Structure Read
GBPUSD is structurally bullish on every timeframe — the trend is undeniably up and the sequence of higher highs and higher lows has been consistent. This is not a market in structural trouble; it is a market that has made a strong move and is now pulling back to test the levels behind it. The structure itself is not broken, but it is being tested.
Momentum Read
Momentum is fading during this pullback, which is worth monitoring. Fading momentum on a pullback can either mean the buyers are simply resting before the next push, or it can be an early warning that the trend is losing its footing. At this stage it reads as a rest — but 1.35449 needs to hold and momentum needs to stabilise before this becomes actionable again.
Volume & Flow Read
Sellers are active in the current pullback and the volume flow reflects that. This is not passive selling — there is genuine pressure being applied at higher prices. However, the overall trend context means this reads as profit-taking by longs rather than a new short campaign establishing itself. Watch how price behaves at 1.35449 to judge whether this is distribution or absorption.
The Verdict
The structural backdrop for GBPUSD is as bullish as it gets — every timeframe agreeing on direction. But the trade is currently pulling back toward a critical stop zone at 1.35449, and momentum is not supporting a new long entry here. This is a watching brief: the trade is not live yet, and it isn’t in profit. Let it come to the level, watch how it behaves, and only engage if the support holds and buyers visibly step back in. Chasing a pullback without that confirmation is the mistake.
Long Case vs Short Case
88%
Structural trend firmly bullish all timeframes. Higher low sequence intact.
12%
Active selling + fading momentum creates risk of 1.35449 test failing.
Position Sizing Guidance
No new position until 1.35449 is tested and holds. If that level is reached and buyers absorb the selling, a small initial position with tight stops makes sense — but wait for the confirmation candle rather than guessing the turn. If 1.35449 breaks convincingly, the long case is on hold and the structure needs reassessment before re-engaging.
This content is for educational and informational purposes only. Nothing here constitutes financial advice or a recommendation to buy or sell any instrument. Trading involves substantial risk of loss. Past performance is not indicative of future results. Always conduct your own due diligence and manage risk appropriately.
Tuesday 5 May 2026
GBP/USD — Daily Framework Read | Tuesday 5 May 2026
GBP/USD (Cable) | Daily Framework Read | Tuesday 5 May 2026
Cable opened the week trading the back foot. Friday’s PCE landed warm enough to reinforce the dollar bid, sterling lost the 1.3400 floor that held the entire prior week, and the daily print has rolled over into a markdown read. The framework is now SHORT BIAS with measured conviction. Bank Holiday Monday in the UK thinned the order book and amplified the move; Tuesday’s London open is the first proper test of whether the breakdown sticks. The Bank of England MPC meeting Thursday is the next macro hinge. Any hawkish-on-hold language defends 1.3200; a Mann-style dovish dissent and the pair tests 1.3050. Trade the new lower range until the BoE resolves it.
Tuesday thesis on cable. The relative resilience story that anchored the pair through April has cracked. Sterling is no longer the cleanest dollar-hedge in G10 because the gilt market wobble around UK fiscal headroom has finally caught up with the currency. Structure has shifted from range-holding to lower-highs, lower-lows. The analysis reads SHORT into Thursday’s BoE with 1.3400 as the line that turns the pair back into a range trade. Below 1.3270 keeps the pressure live; above 1.3400 invalidates and forces a re-read.
Where It Sits Today
Current zone
1.3270
Below the prior week floor
5-day move
-2.4%
From 1.3590 to 1.3270
Prior week floor
1.3400
Held through PCE Thursday
Structure
Markdown
Lower highs, lower lows
Cable trades into the Tuesday London open below the 1.3400 shelf that defined the entire prior week’s range. That shelf had absorbed every intraday probe through the second half of April, including the Powell-driven hawkish repricing. Friday’s PCE finally pushed it through. The decisive bar is the Friday daily candle, which closed below 1.3320 on widening real bodies. That is the first signature of structure shift since the early-April pivot higher. Bank Holiday Monday compounded the move because the London bid was simply absent for half the session, leaving Asian and US flows to set the tape. Tuesday’s open is the first chance for real participants to vote on whether 1.3270 holds or breaks toward 1.3150.
The 5-day picture matters more than any single bar. From the 1.3590 print on the prior Tuesday to the 1.3270 zone now is a 2.4 percent dollar-positive move, which is large in cable terms over a single trading week. The pair has not had a -2.4 percent week since the late-January risk-off episode. Read that one of two ways: either this is a one-off catalyst-driven repricing that mean-reverts on a soft data print, or it is the beginning of a regime change in the dollar story. The framework is leaning to the second read because the breakdown is broad-based across G10, not isolated to sterling.
What the Framework Reads
The daily read on GBP/USD has shifted from NEUTRAL WITH RELATIVE RESILIENCE to SHORT BIAS WITH MEASURED CONVICTION. The classification rests on four overlapping reads.
Structure: The daily chart has rolled. The lower-high pattern that printed on the rally into 1.3590 last Tuesday now sits inside a broader lower-low after Friday’s PCE close. Markdown signatures showed up across multiple sessions of confluence. That is the framework’s cleanest signal that the prior range is no longer in force. Until cable closes back above 1.3400 on a daily, structure stays bearish.
Momentum: Volatility has expanded back to its early-April readings. Daily ranges have widened from the contained 60 to 80 pip prints of mid-April to the 120 to 150 pip stretches now. Wider ranges in the direction of the new trend are the textbook tell that institutional flow is committed. The fact that Friday’s range was the widest of the move and closed near the lows confirms participation, not exhaustion.
Volume and flow: The breakdown candle ran on volume well above the 20-day average. That is meaningful because cable is still effectively a continuation chart with no fresh dollar shock since Friday. Money has chosen to lean into the move rather than fade it. The Asian session through Monday into Tuesday added to the offers rather than retracing, which is the second confirmation that flow is one-directional.
Macro frame: Two macro lines define the next 72 hours. First, DXY at 99.40 has held the upper half of its prior range and is now coiling for a possible test of the 100 handle. Cable trades inversely. Second, the Bank of England MPC decision lands Thursday lunchtime UK time. Market pricing has drifted back toward a single 25 basis point cut by autumn. A hawkish-hold with split-vote dissent stops the bleed for sterling. A dovish dissent or any softening of the inflation language opens the door to 1.3050. The pair is gated behind that decision the same way it was gated behind PCE last week. The difference is the pair now starts the wait from a worse technical position.
What we said last week vs what happened
Thursday 30 April we read GBP/USD as NEUTRAL WITH RELATIVE RESILIENCE inside a 1.3400 to 1.3650 range, called PCE Friday as the binary, and flagged 1.3400 as the line that turned the structural read negative if it failed on a hot print. PCE printed at the upper end of the warm range. The 1.3400 line failed on Friday’s close. The framework is doing exactly what the call said it would do if that line broke. The prior read is invalidated by design and replaced with the new short bias.
Key Levels
| Level | Price | Type | Meaning |
|---|---|---|---|
| Bull invalidation | 1.3400 | Prior range floor / new ceiling | A daily close back above flips the read from short bias to neutral and forces a fresh look. |
| Near resistance | 1.3340 – 1.3360 | First retest zone | The point where a relief bounce typically gets sold in a fresh markdown structure. |
| Current zone | 1.3270 | Active price | Below the breakdown line. Tuesday London tells us if it holds or extends. |
| First downside | 1.3200 | Round-number magnet | The first natural target of the new short bias. Probable BoE-day battleground. |
| Bear extension | 1.3050 | Q1 swing low | Reachable on a dovish BoE dissent or DXY through 100. The full downside if the catalyst aligns. |
| Tail extension | 1.2900 | Late-2025 pivot | Not the base case. Maps the worst-case alignment of a hot CPI plus dovish BoE plus dollar acceleration. |
Three Scenarios into BoE Thursday
| Scenario | Trigger | Cable target | Probability |
|---|---|---|---|
| Trend continuation | Dovish dissent or softer inflation language. DXY pushes 100. Gilts richen relative to Treasuries. | 1.3050 by end of Friday session | 45% |
| Hawkish hold and stabilise | 7-2 hold, sticky inflation language, no signal of imminent cut. Gilts cheapen, DXY fades. | Range 1.3270 – 1.3400 reasserts | 35% |
| Risk-off mean-revert | Equity wobble, dollar bid evaporates as flight-to-quality routes through Treasuries. DXY back through 99. | Recovery toward 1.3450 | 20% |
The trend continuation case carries the highest weight because the structure has rolled and the BoE is the path-of-least-resistance trigger. The hawkish hold case is the realistic stabilisation read. The risk-off mean-revert case is the lowest weight precisely because it requires a cross-asset move that has not yet shown up in the tape. Position around the 45 percent base and let the data assign the move.
Risk Score
Risk: Around 70%
BoE binary on Thursday is the dominant factor. Bank Holiday-thinned tape into Tuesday’s open raises gap risk in the first hours of London. Gilt market sensitivity to fiscal language remains the structural tail. DXY at 99.40 sits in the upper half of its range and is one US data print away from a 100-handle test. The 70 percent risk reads as elevated because the pair just confirmed a structure shift on a major catalyst and the next catalyst lands inside this trading week. Trade with controlled size and a hard stop above 1.3400. Do not analysis into the trend before the BoE prints.
How to Walk It
| Tier | Setup | Entry | Stop | Target | R:R |
|---|---|---|---|---|---|
| Retest short | Reaction off 1.3340 to 1.3360 with rejection bar on the London open. | 1.3345 | 1.3415 | 1.3210 | 1.9:1 |
| Breakdown extension | Daily close below 1.3220 with confirmation. Aim for the round number. | 1.3215 | 1.3290 | 1.3060 | 2.0:1 |
| Post-BoE directional | Wait for the BoE statement, then trade the break of either 1.3200 or 1.3400 with a confirmation bar. | Level break | 25–35 pips | 100–150 pips | 3.5:1 |
Cable rewards patience this week, not aggression. The retest short is the prep-the-orders trade for Tuesday, not a chase of the breakdown bar. The breakdown extension is for the second wave once 1.3220 gives. The post-BoE directional setup is the highest-quality entry of the week because it removes the catalyst variable. Size 30 to 40 percent of normal until the MPC line clears.
This is analysis and commentary for educational purposes only. Not financial advice. Always manage your own risk.
Continue with Titan Protect
Twenty-plus instruments. One framework.
We read more than twenty instruments daily across four sessions. The framework’s sunrise call landed across the day — the Pre-NY case study shows what the lines drew, what New York did, and where the read stands.
Core
£59/mo
Indicator suite plus daily framework reads.
Edge Popular
£109/mo
Core plus Shield dashboard and member-only briefs.
Elite
£179/mo
Edge plus weekly 1:1 call and early access to new tools.
Save 15% on annual billing
Want to see the framework in action? Free Explorer tier — no card required.
Join the live community: Discord channel · Shield dashboard
Education, not financial advice. Trade your own analysis.
Sunday 3 May 2026
GBP/USD — Daily Framework Read | Sunday 3 May 2026
GBP/USD | Monday Open Framework Read | Data basis: Friday 1 May 2026 close
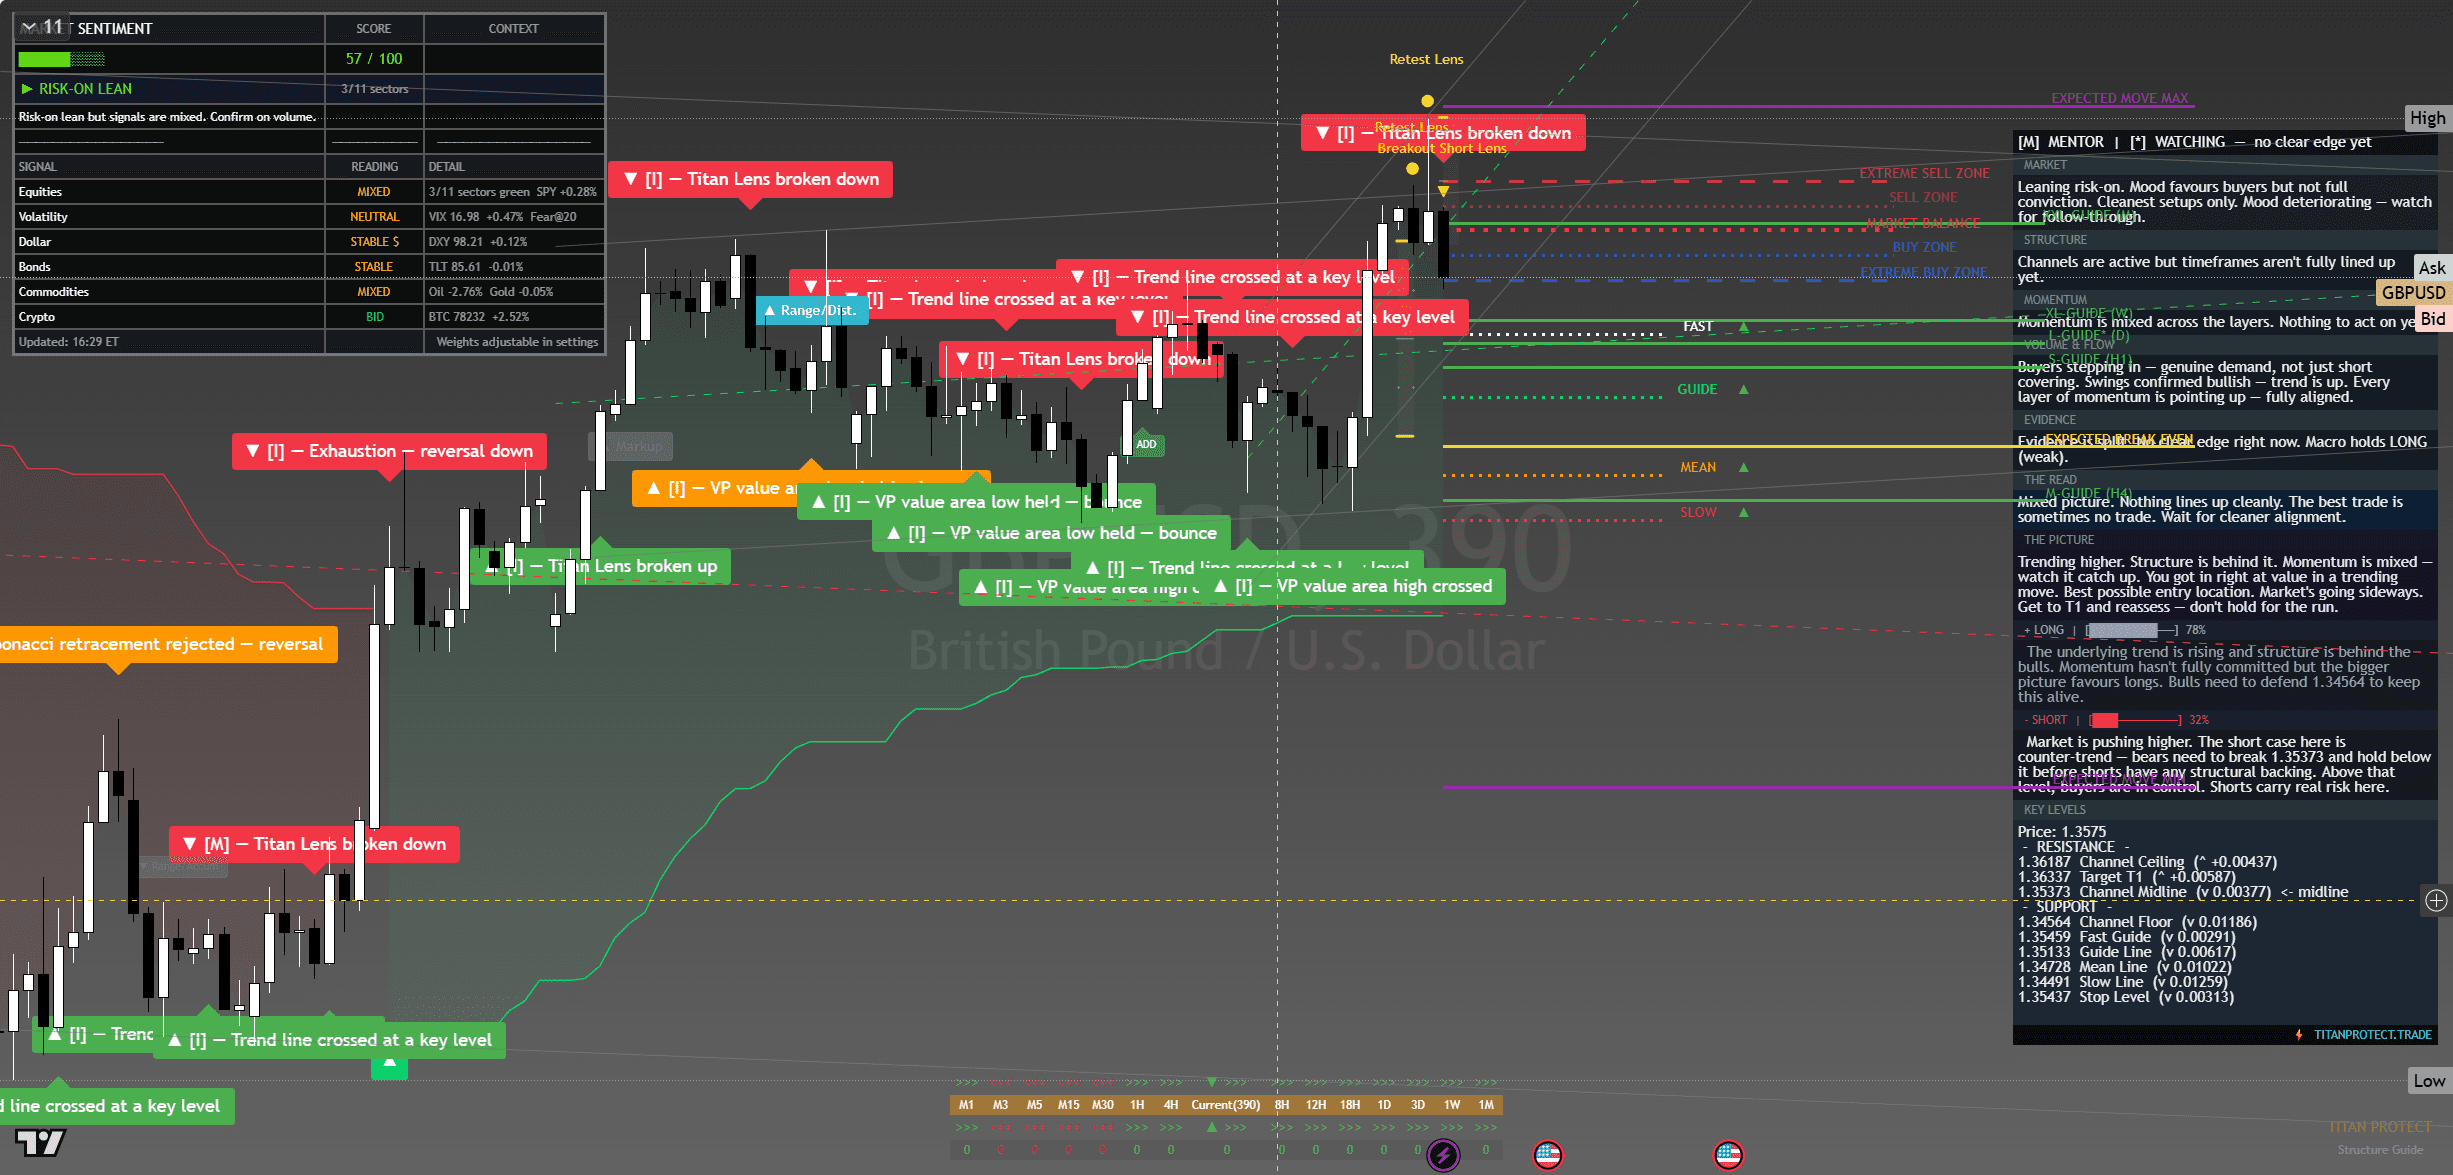
GBP/USD — chart with framework overlay. The Lens annotations show structural breaks, reversal triggers and confluence zones at the levels referenced below.
Where It Sits
Structure
Structurally cable remains in a clear uptrend on the daily timeframe, with higher highs and higher lows since the early-April low. The 4-hour timeframe is more contested — Friday’s pullback broke the short-term ascending channel and price is now testing the underside of broken support. The structure is constructive on the larger timeframe and contested on the smaller.
Momentum
Momentum has rolled over on the 4-hour timeframe but remains supportive on daily. That divergence is the read of a pair that is consolidating rather than reversing. The 1.3520 support level is the decision point — hold and momentum re-engages, lose and the daily timeframe starts to soften.
Volume & Flow
FX volume cues are limited but futures-implied flow on Friday showed modest dollar buying into the close — not aggressive, more positioning ahead of Monday open. The pound side has not seen distinctive selling. The pullback is a positioning move not a sentiment shift.
Key Levels
| Level | Type | Significance | Action Zone |
|---|---|---|---|
| 1.3680 | Resistance | Recent swing high, supply cluster | Take profits / fade if rejected |
| 1.3625 | Pivot | Mid-range, breakout/breakdown trigger | Hold above = bullish bias |
| 1.3576 | Friday close | Reference anchor | Bias line for Monday open |
| 1.3520 | Support | Recent breakout retest level | Buy zone with defined stop |
| 1.3460 | Major support | Prior consolidation floor | Stop-out below for longs |
Three Scenarios Into Monday Open
Continuation
Pair opens firm in Asia, holds 1.3580, takes 1.3625 in London on softer USD. Runs to 1.3680 zone by NY. Bullish reversal of Friday’s pullback.
Range
Pair opens flat, churns 1.3540-1.3620 through the session. Range trade dominates without a UK or US data catalyst. ISM Services Tuesday becomes the next read.
Mean Reversion
Pair opens weak on USD strength, breaks 1.3520 support, runs to 1.3460. Continuation of Friday’s pullback. Watch DXY for confirmation.
Risk Score
Risk sits at Around 45% heading into Monday open.
Risk is moderate. Friday’s pullback to 1.3576 is well within the broader uptrend but reduces the asymmetry of new long entries. The pair sits at a decision point — above 1.3625 it resumes the up-trend, below 1.3520 it confirms a deeper correction. Position-sized longs on tested support; no aggressive new entries at the broken level until structure rebuilds.
How to Walk It
Entry / Stop / Target structure:
- Long 1.3540-1.3560 pullback | Stop 1.3510 | Target 1.3625 | R:R 2.5:1
- Long 1.3630 breakout | Stop 1.3590 | Target 1.3680 | R:R 1.3:1
- Short 1.3690+ rejection | Stop 1.3725 | Target 1.3600 | R:R 2.5:1
Experience-level guidance:
Beginner: The Monday open after a Friday record close is exactly the situation where over-confidence costs money. Reduce size to half your standard. Trade only the cleanest setup from the entries above. If the tape opens against your bias, do nothing — wait for the second hour, when the institutional flow has tipped its hand.
Intermediate: Use the levels table to define the trading range. Fade the extremes with defined stops, take profits before the round-number resistance levels. Do not carry directional positions through the day if you cannot watch the tape — Monday opens are prone to fast reversals.
Advanced: The vol regime is supportive of trending moves. Defined-risk options structures around the key pivot levels capture the asymmetry cleanly. Keep notional small relative to your book — Monday after a record-close week is asymmetric speculation, not core positioning.
The Sunday Composite — How This Read Sits Inside The Cross-Asset View
This single-instrument framework read is one slice of the larger Sunday weekend synthesis. The composite takes positioning, macro, sentiment, volatility, sector dispersion and trade structure as separate analytical layers and arrives at a unified composite verdict for Monday open. Each layer below is unpacked in full.
Read the full composite for the cross-asset context driving this instrument:
The institutional positioning split — Asset Managers vs Leveraged Funds in size
PCE clearance and the macro case for Monday’s carry
The three-layer sentiment disagreement — surface greed, retail neutral, professionals hedged
The vol curve term structure and what VVIX is signalling
Sector dispersion and the breadth problem behind the record close
The Monday position-management playbook — sizing tiers and trade plans
Sunday Overwatch — the unified composite verdict
Continue Reading
The macro frame driving this read is unpacked in the weekend briefs:
Sunday Setup — Reading The Tape Into Monday Open
PCE Cleared, VIX Crushed, SPY Closed 720 — Friday Post-Close Recap
This analysis is for educational and informational purposes only. It does not constitute financial advice. Always manage your risk independently and in accordance with your own financial circumstances.


