
The GBPUSD Framework Journal for July 2026, newest read at the top. Each dated entry is our read on the close, kept as a living record so the framework can be judged over time. This is analysis, not financial advice.
Friday 31 Jul 2026
See chart for latest
The dollar sits firm as the natural pull in a week that opened with an equity wobble and a haven bid, so the crosses trade the same risk-off-versus-steadying tension the equity tape does.
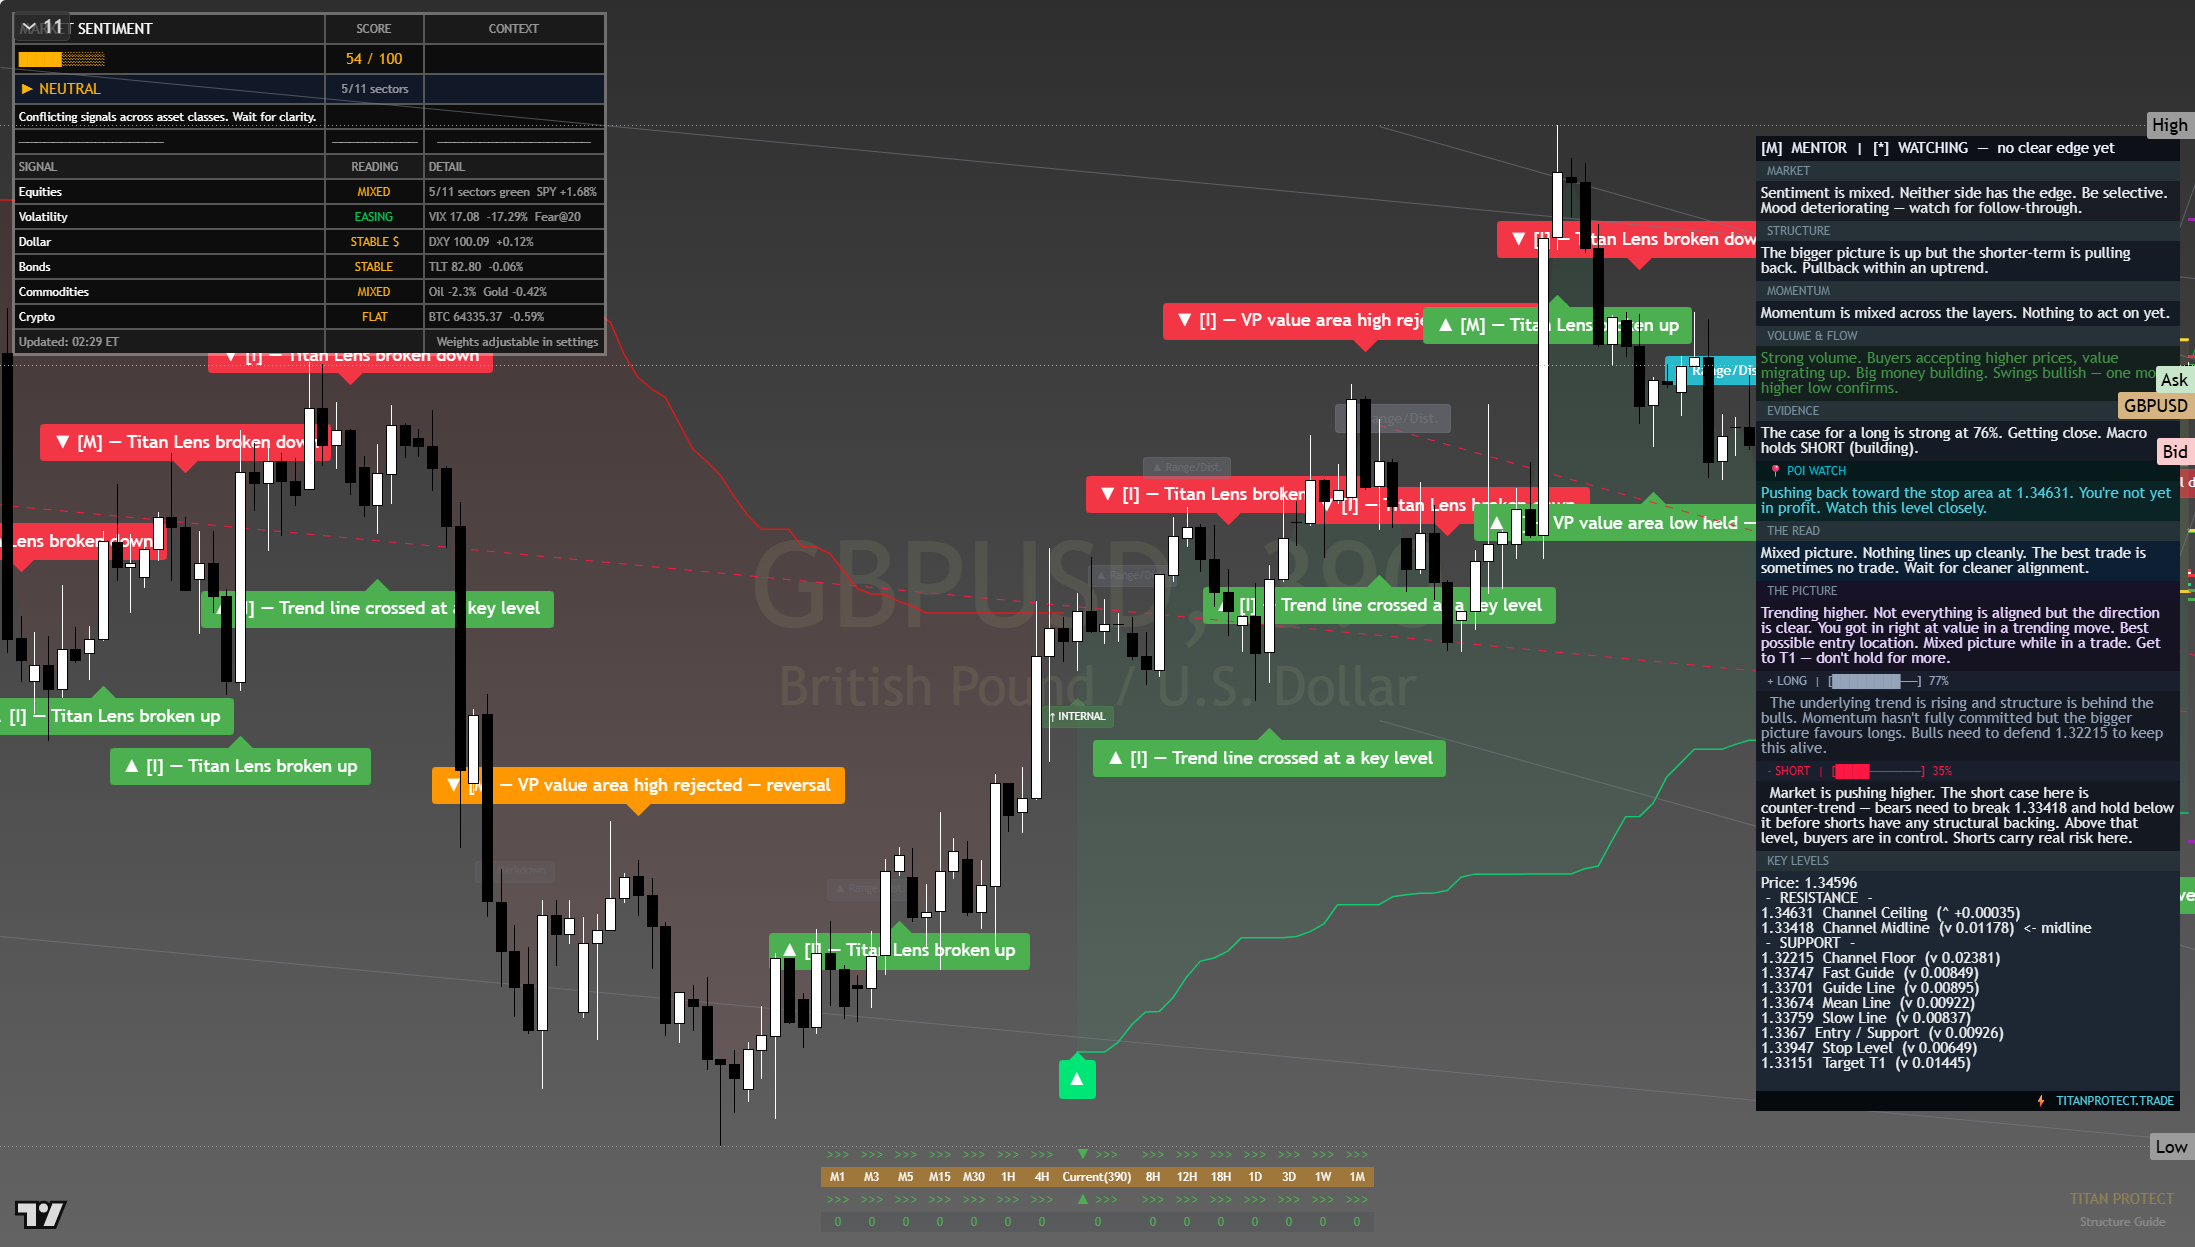
The chart above is the full daily read: structure, momentum, the levels that matter, and where the current price sits against them. Read it top to bottom for the complete picture, and pair it with our session briefs for the wider market context.
This is analysis, not financial advice. It reflects our multi-factor framework and is not a recommendation to buy or sell. Always do your own research and manage your risk.
Thursday 30 Jul 2026
See chart for latest
The dollar sits firm as the natural pull in a week that opened with an equity wobble and a haven bid, so the crosses trade the same risk-off-versus-steadying tension the equity tape does.
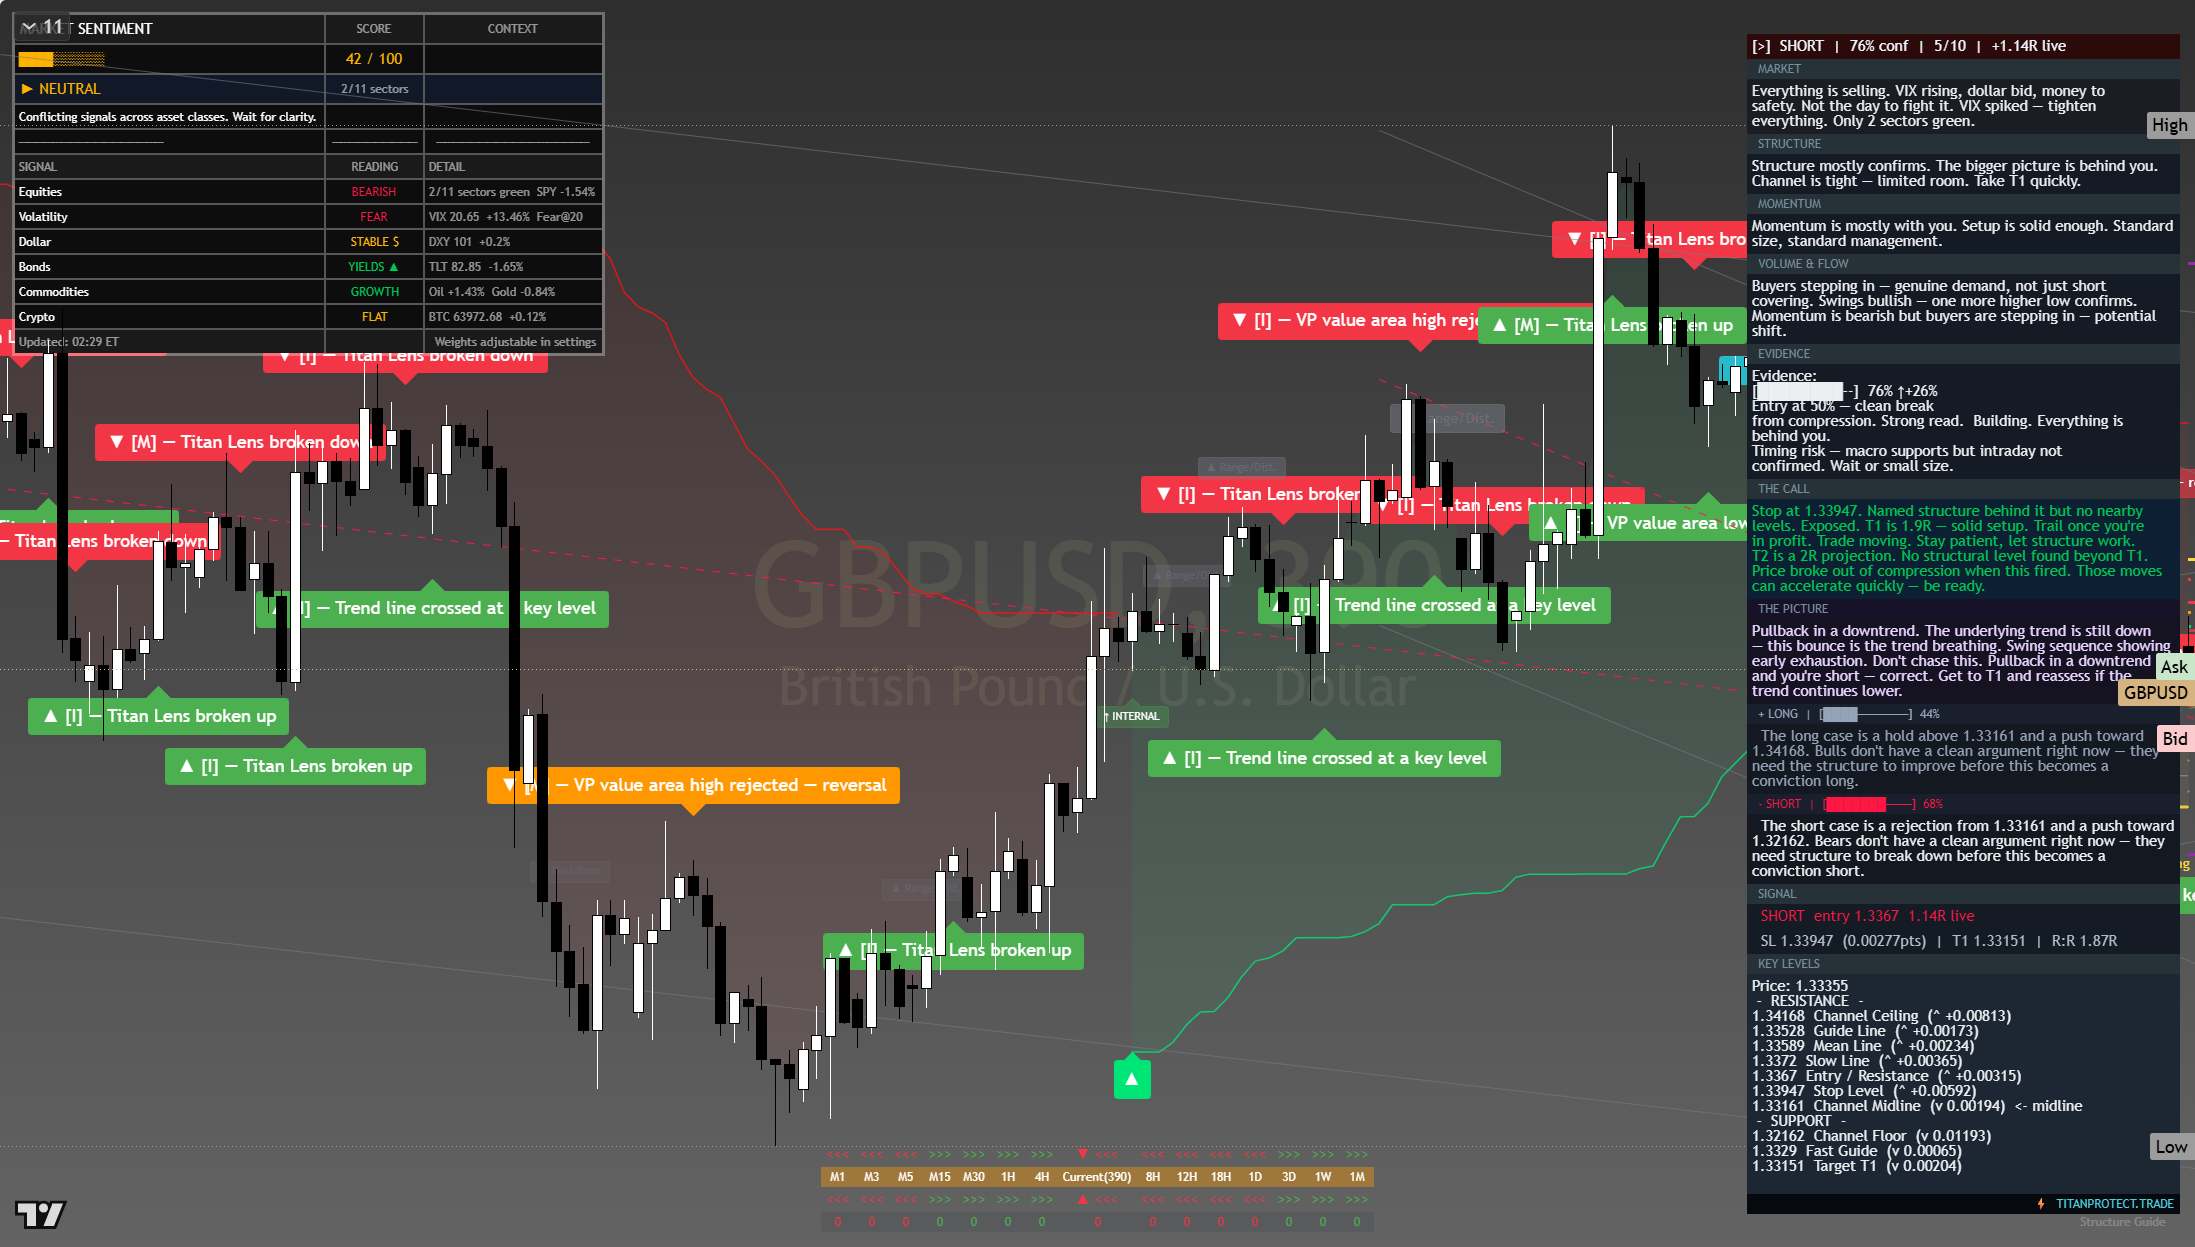
The chart above is the full daily read: structure, momentum, the levels that matter, and where the current price sits against them. Read it top to bottom for the complete picture, and pair it with our session briefs for the wider market context.
This is analysis, not financial advice. It reflects our multi-factor framework and is not a recommendation to buy or sell. Always do your own research and manage your risk.
Wednesday 29 Jul 2026
See chart for latest
The dollar sits firm as the natural pull in a week that opened with an equity wobble and a haven bid, so the crosses trade the same risk-off-versus-steadying tension the equity tape does.

The chart above is the full daily read: structure, momentum, the levels that matter, and where the current price sits against them. Read it top to bottom for the complete picture, and pair it with our session briefs for the wider market context.
This is analysis, not financial advice. It reflects our multi-factor framework and is not a recommendation to buy or sell. Always do your own research and manage your risk.
Tuesday 28 Jul 2026
See chart for latest
The dollar sits firm as the natural pull in a week that opened with an equity wobble and a haven bid, so the crosses trade the same risk-off-versus-steadying tension the equity tape does.
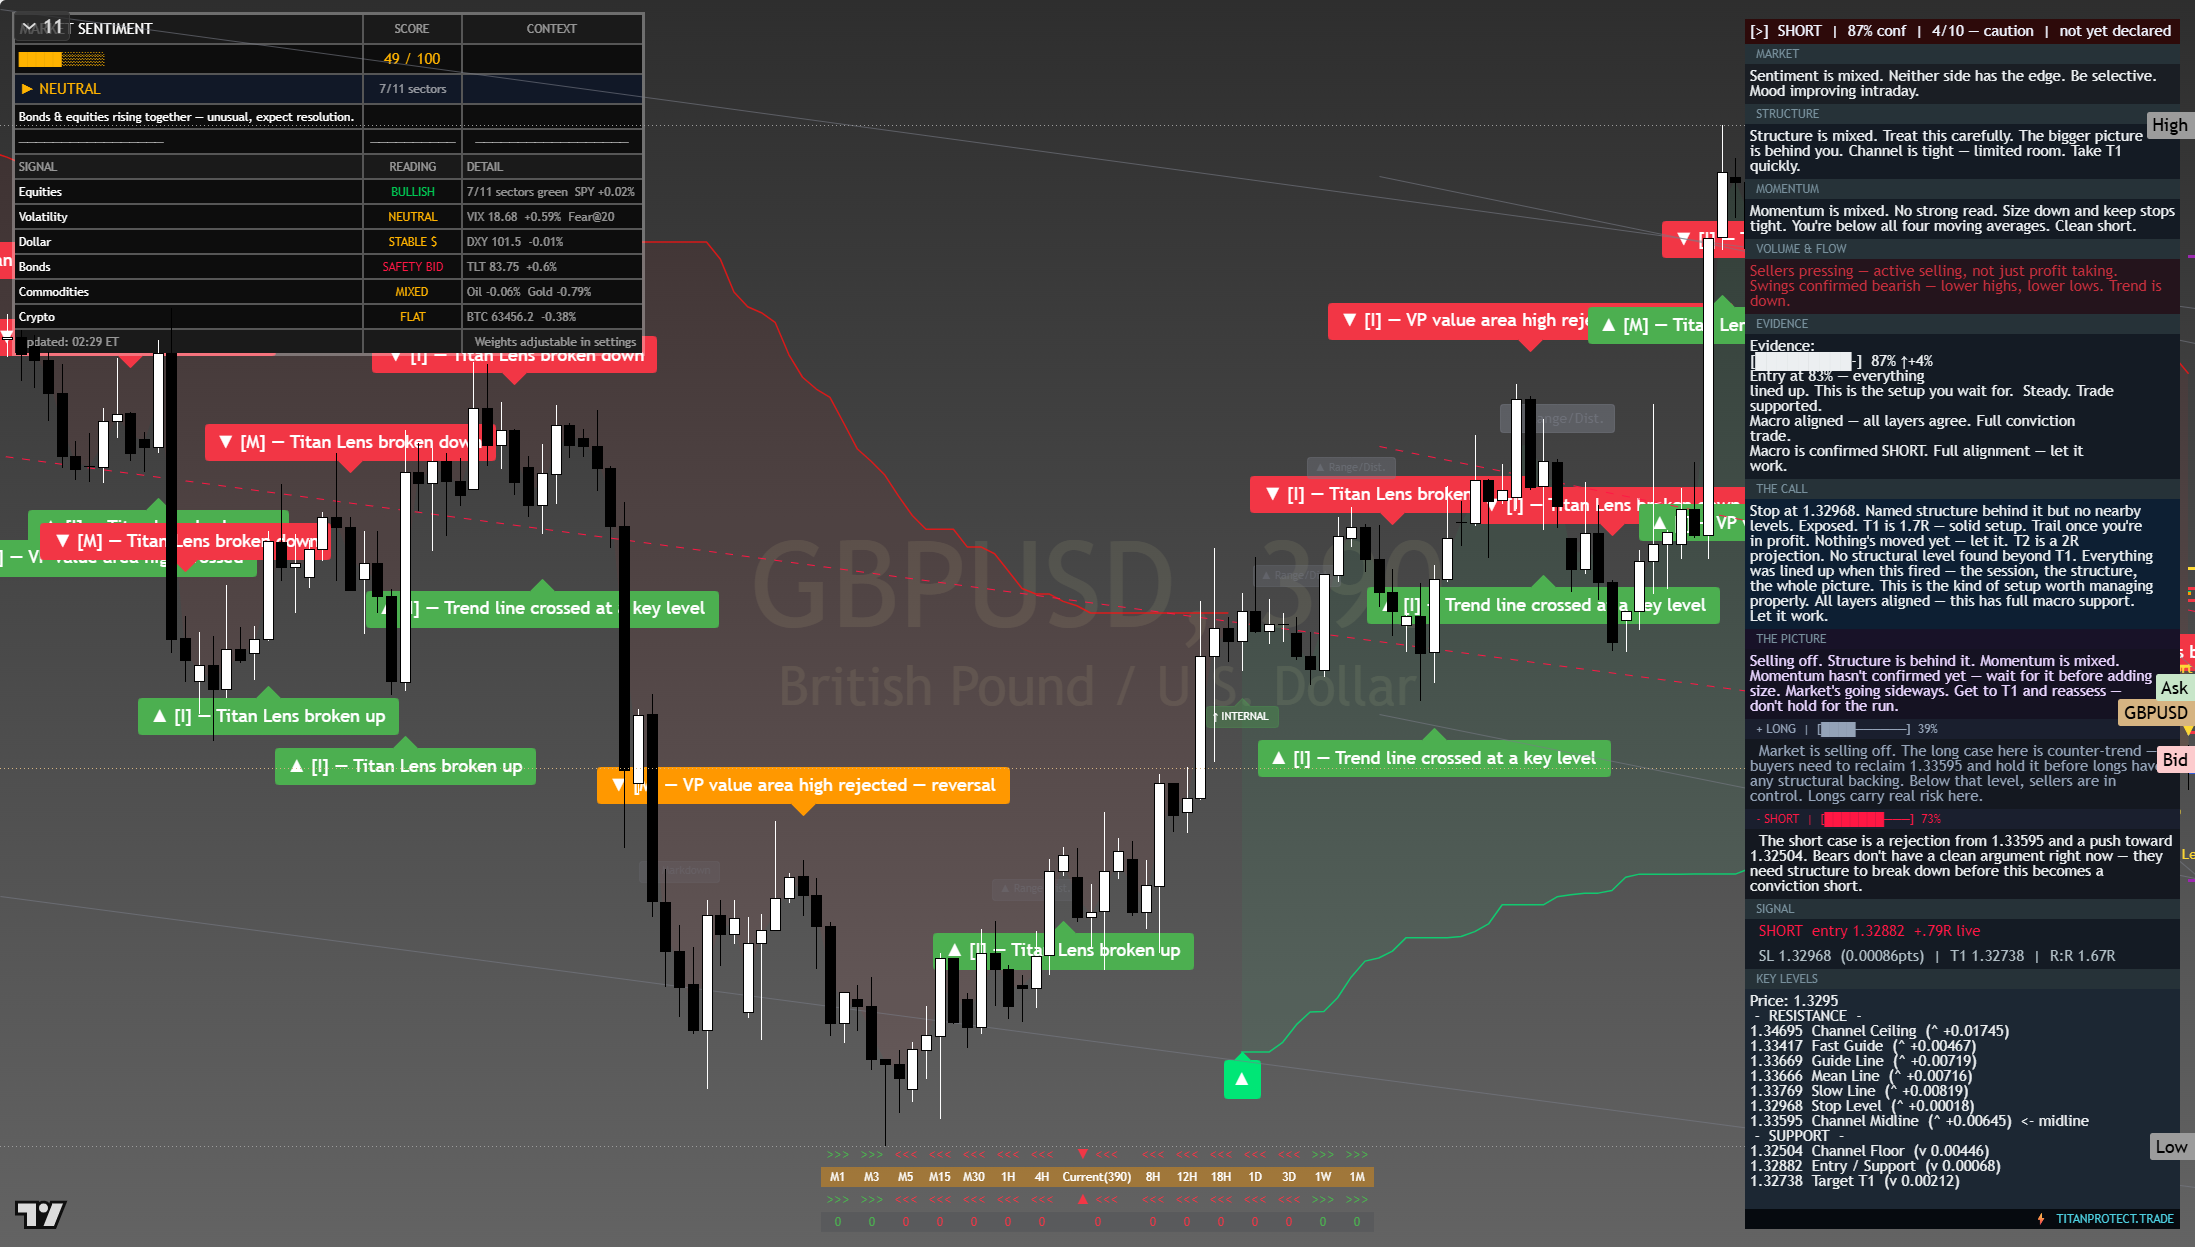
The chart above is the full daily read: structure, momentum, the levels that matter, and where the current price sits against them. Read it top to bottom for the complete picture, and pair it with our session briefs for the wider market context.
This is analysis, not financial advice. It reflects our multi-factor framework and is not a recommendation to buy or sell. Always do your own research and manage your risk.
Monday 27 Jul 2026
See chart for latest
The dollar sits firm as the natural pull in a week that opened with an equity wobble and a haven bid, so the crosses trade the same risk-off-versus-steadying tension the equity tape does.
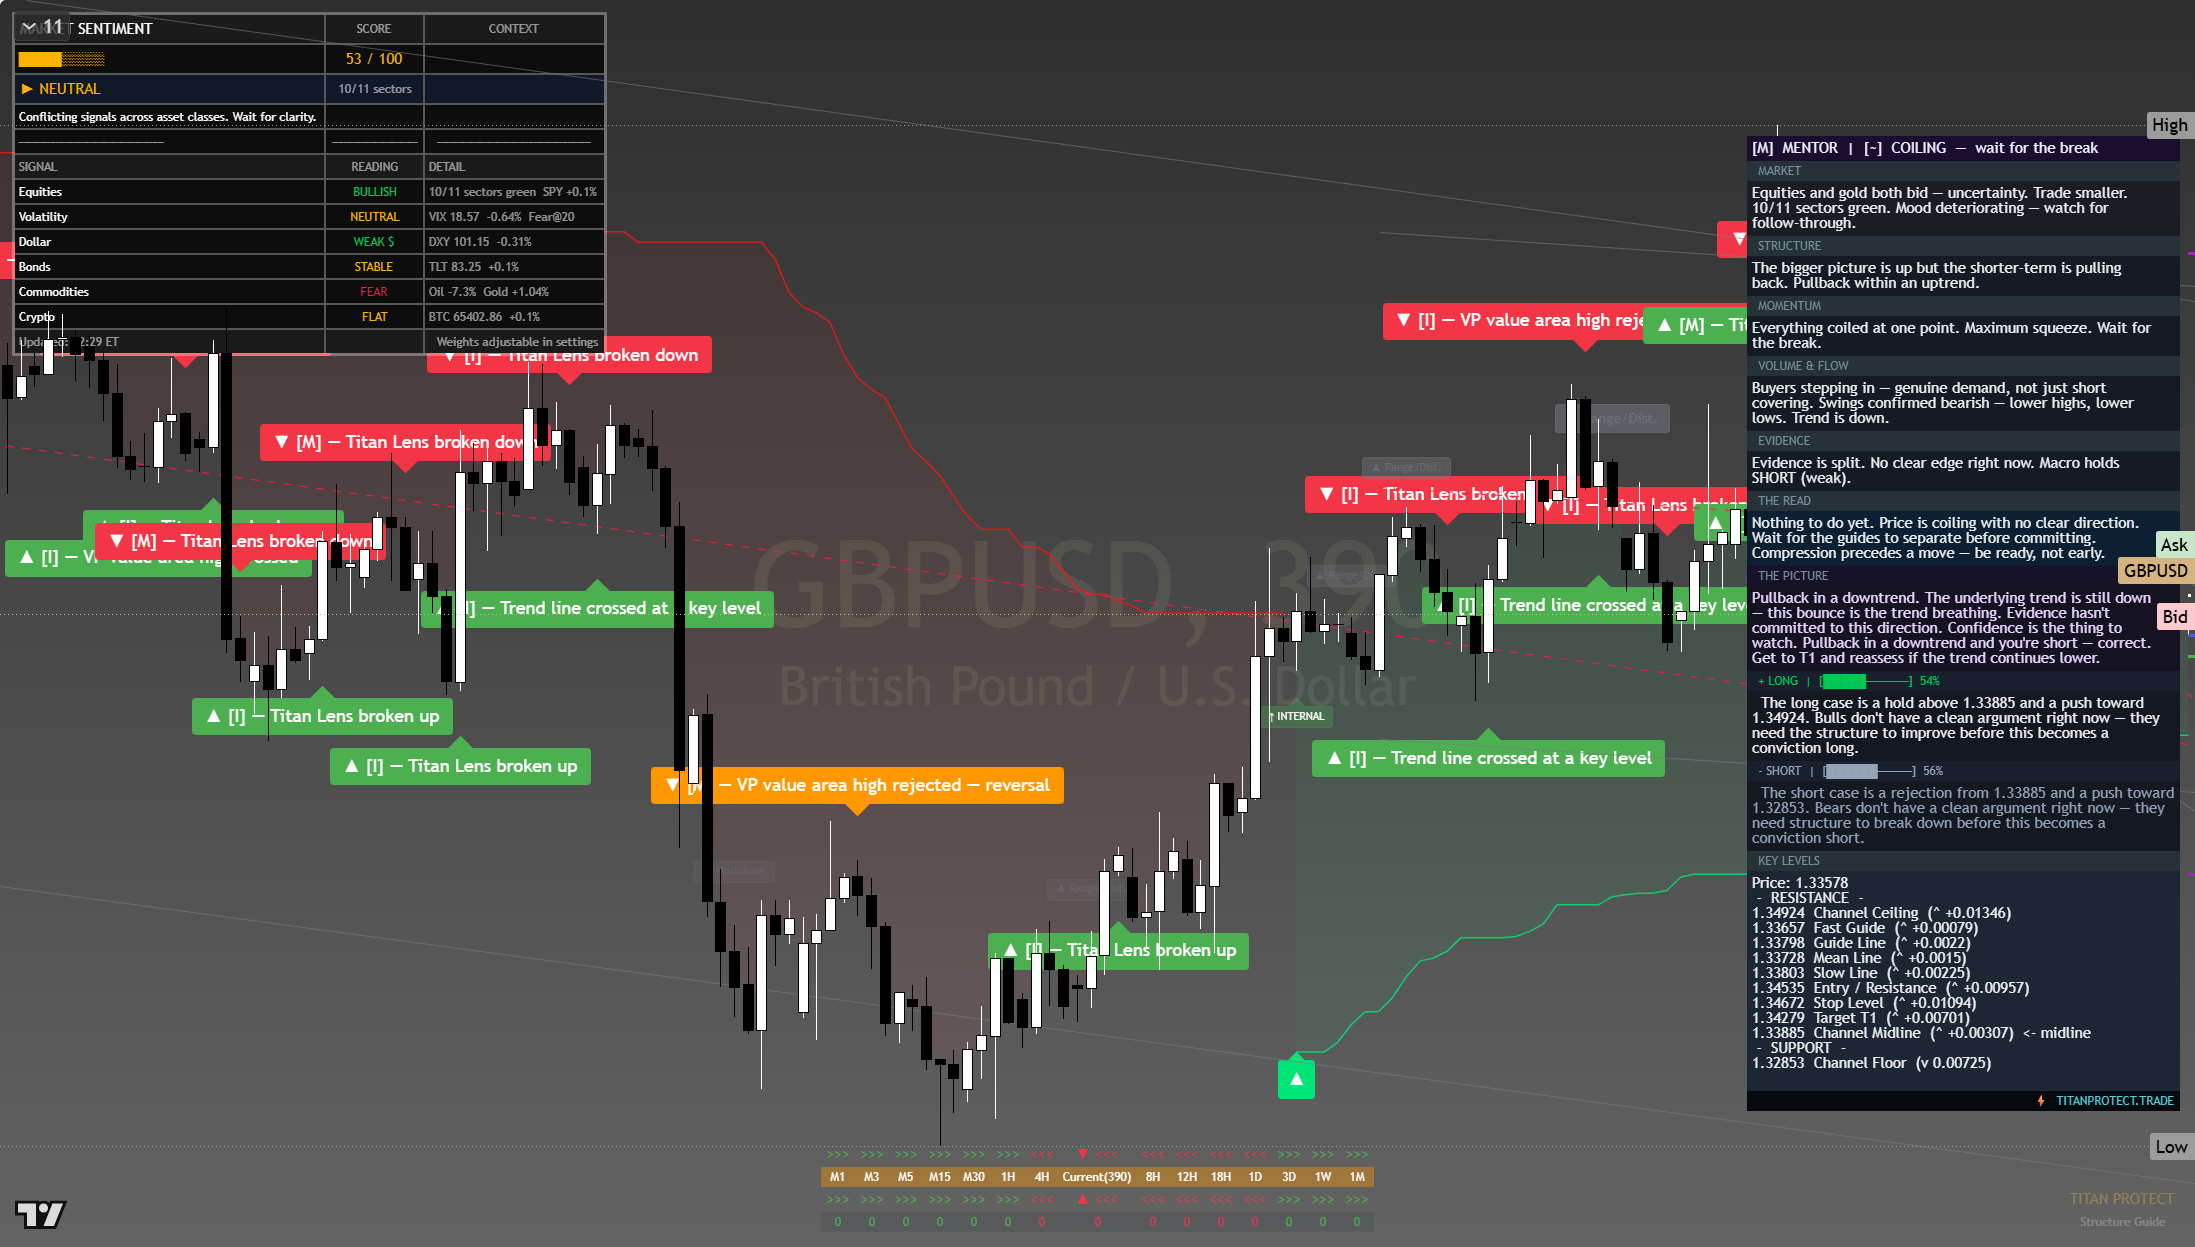
The chart above is the full daily read: structure, momentum, the levels that matter, and where the current price sits against them. Read it top to bottom for the complete picture, and pair it with our session briefs for the wider market context.
This is analysis, not financial advice. It reflects our multi-factor framework and is not a recommendation to buy or sell. Always do your own research and manage your risk.
Sunday 26 Jul 2026
See chart for latest
The dollar sits firm as the natural pull in a week that opened with an equity wobble and a haven bid, so the crosses trade the same risk-off-versus-steadying tension the equity tape does.
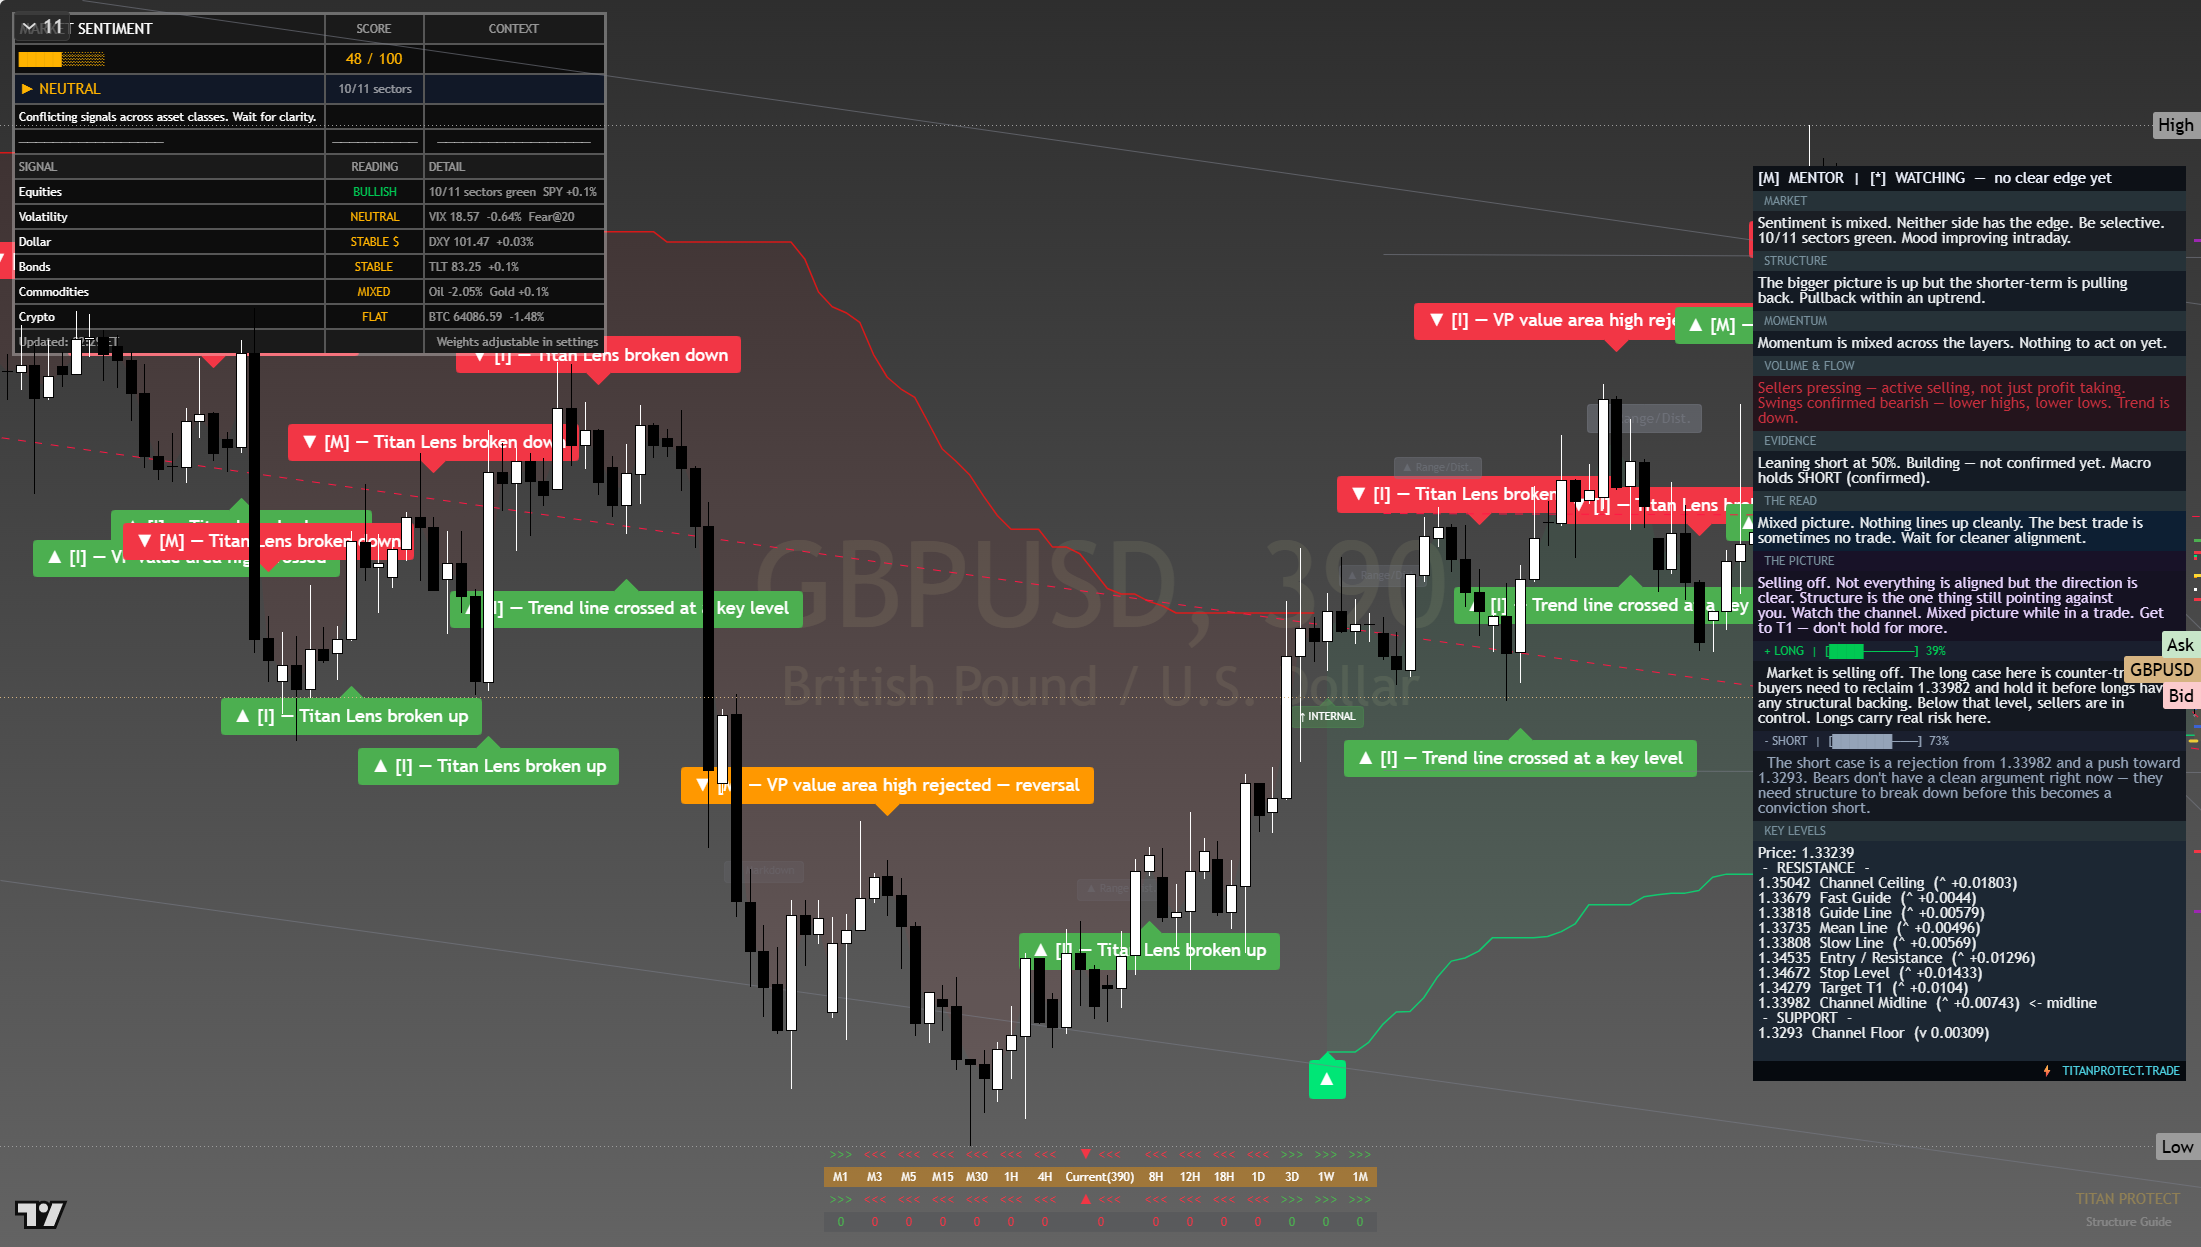
The chart above is the full daily read: structure, momentum, the levels that matter, and where the current price sits against them. Read it top to bottom for the complete picture, and pair it with our session briefs for the wider market context.
This is analysis, not financial advice. It reflects our multi-factor framework and is not a recommendation to buy or sell. Always do your own research and manage your risk.
Saturday 25 Jul 2026
See chart for latest
The dollar sits firm as the natural pull in a week that opened with an equity wobble and a haven bid, so the crosses trade the same risk-off-versus-steadying tension the equity tape does.
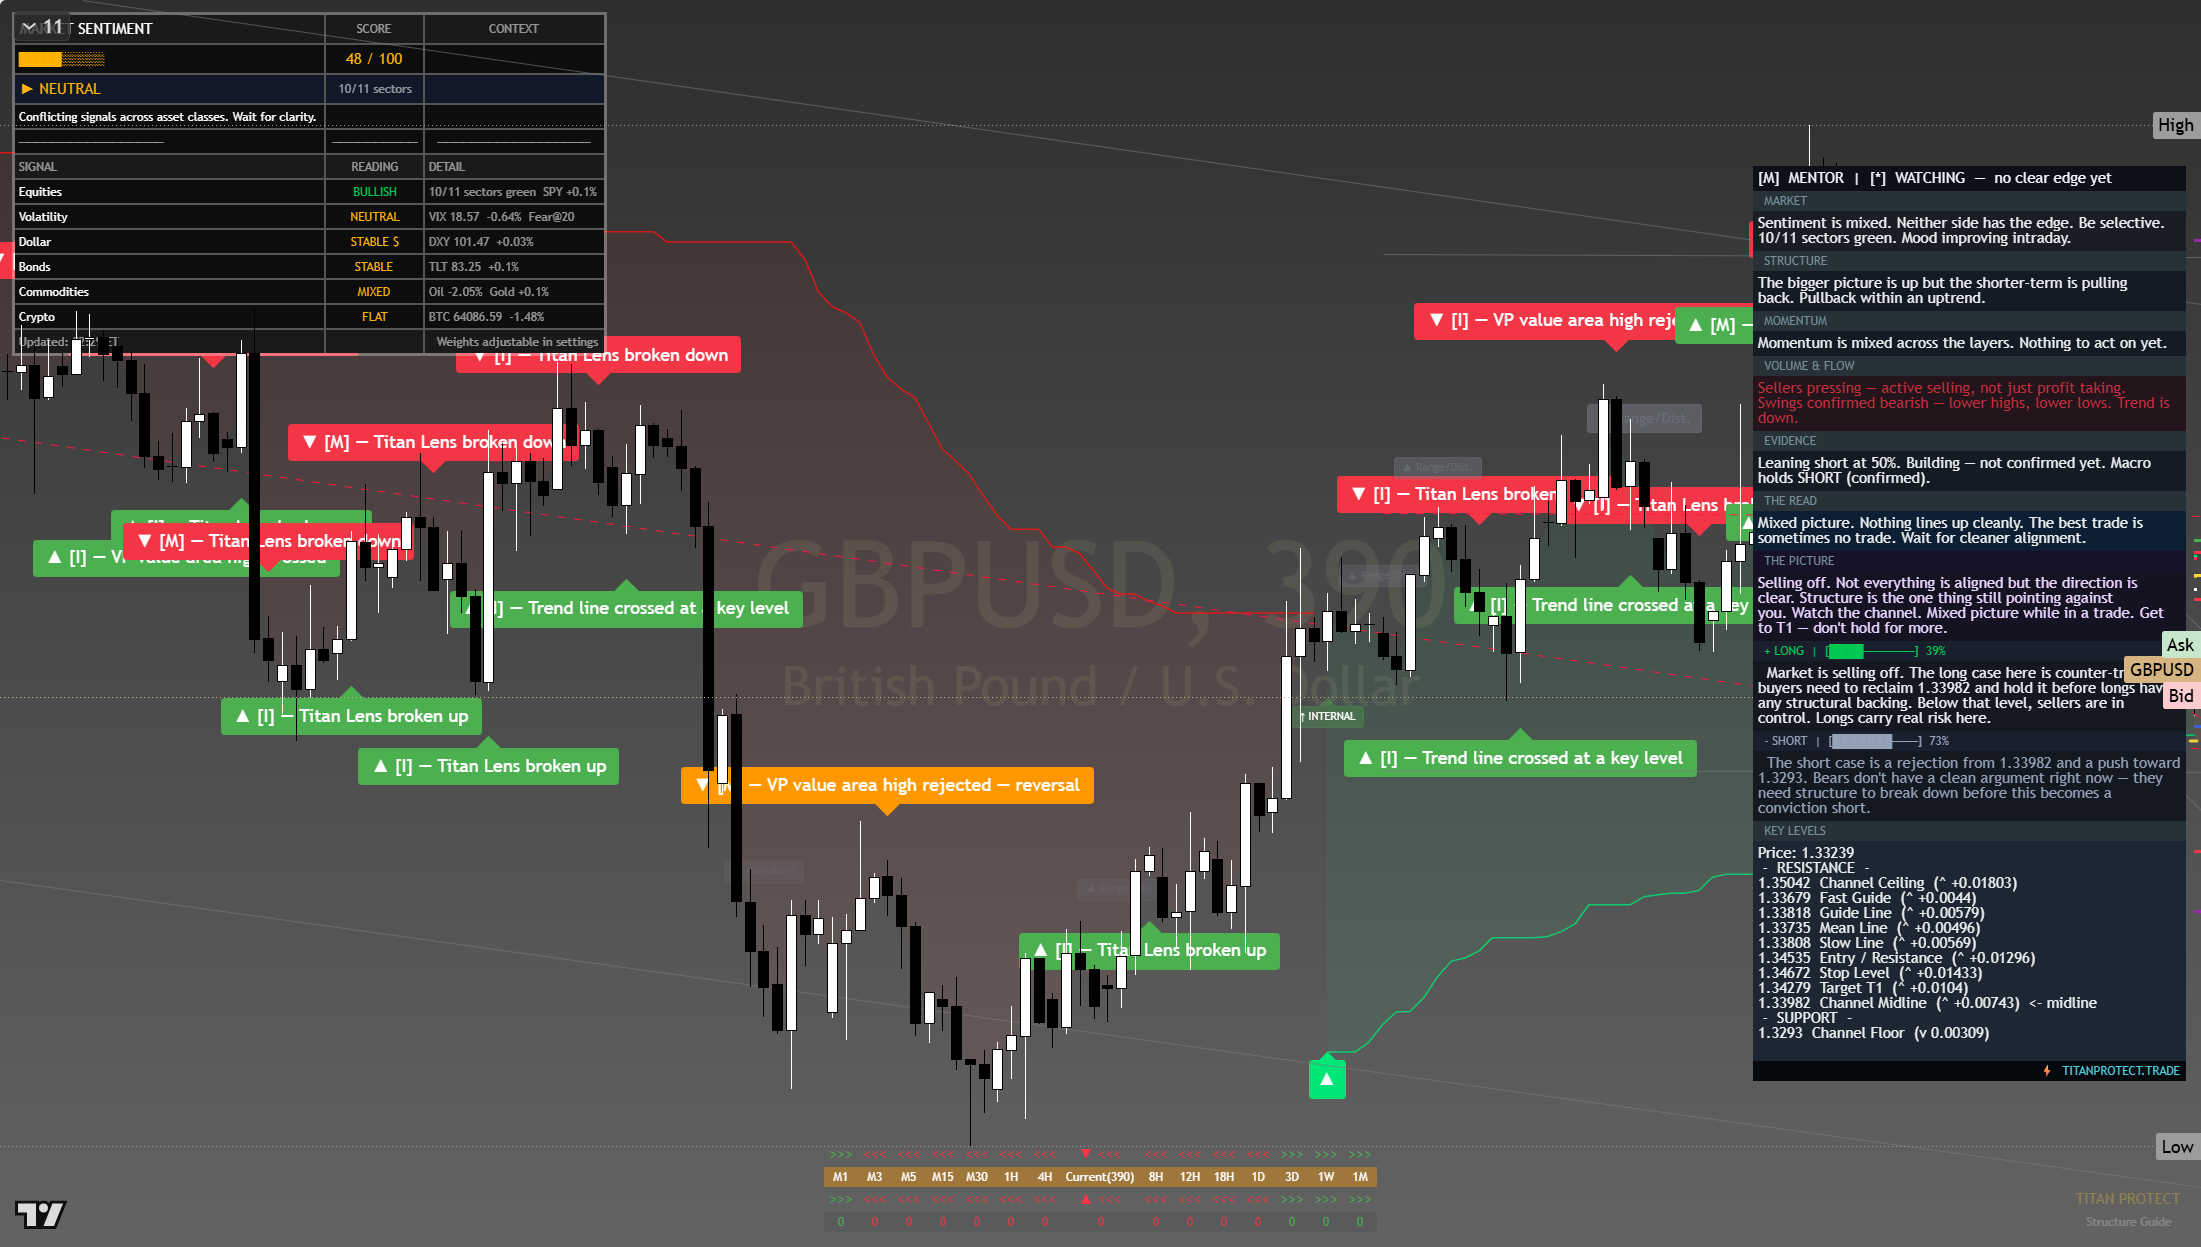
The chart above is the full daily read: structure, momentum, the levels that matter, and where the current price sits against them. Read it top to bottom for the complete picture, and pair it with our session briefs for the wider market context.
This is analysis, not financial advice. It reflects our multi-factor framework and is not a recommendation to buy or sell. Always do your own research and manage your risk.
Friday 24 Jul 2026
See chart for latest
The dollar sits firm as the natural pull in a week that opened with an equity wobble and a haven bid, so the crosses trade the same risk-off-versus-steadying tension the equity tape does.
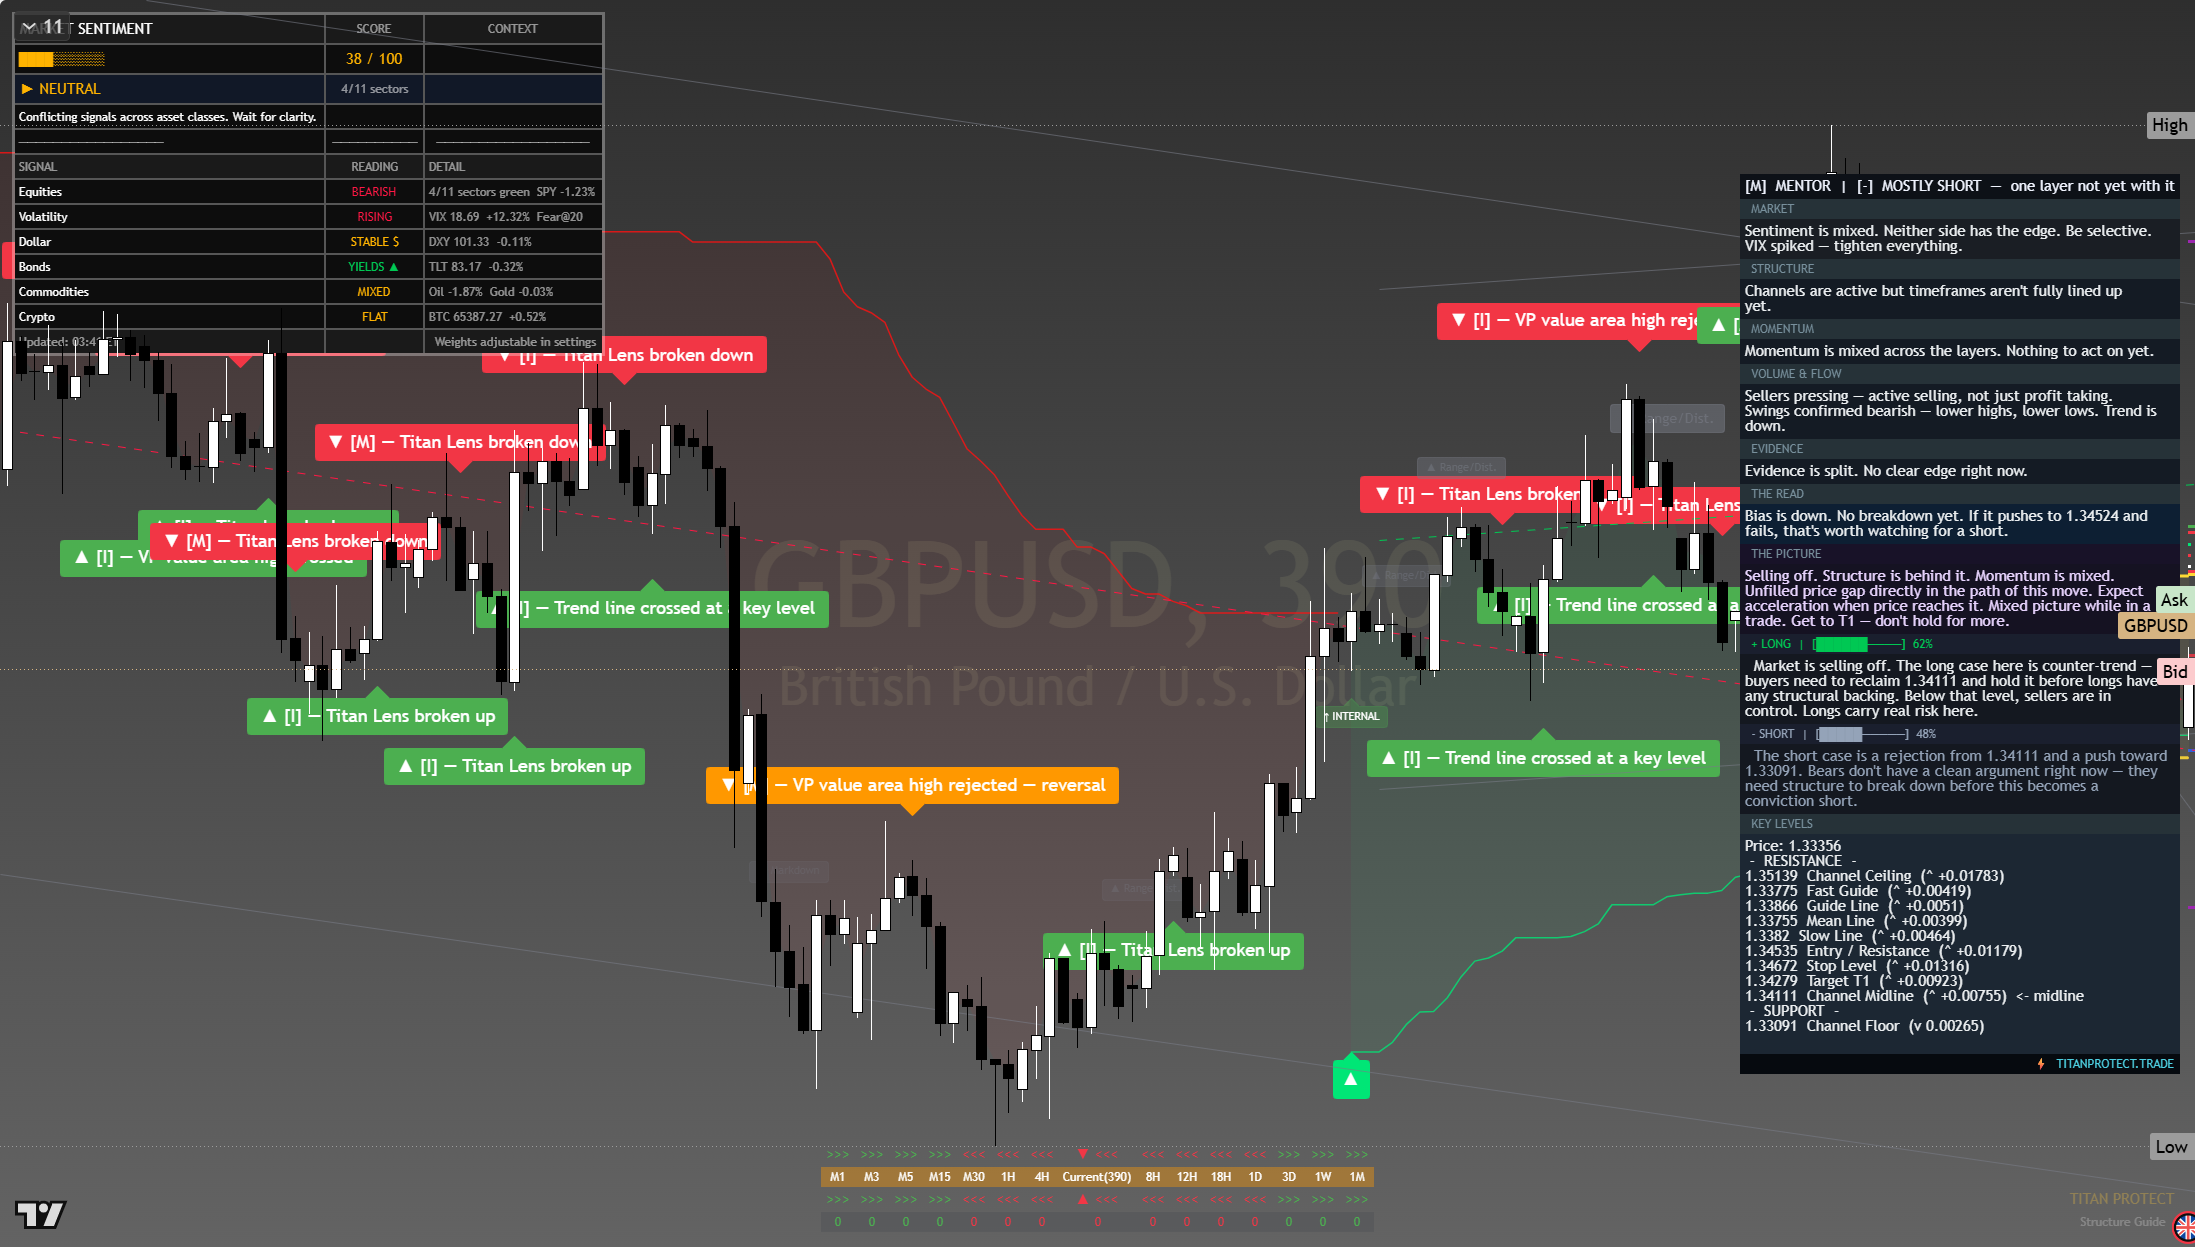
The chart above is the full daily read: structure, momentum, the levels that matter, and where the current price sits against them. Read it top to bottom for the complete picture, and pair it with our session briefs for the wider market context.
This is analysis, not financial advice. It reflects our multi-factor framework and is not a recommendation to buy or sell. Always do your own research and manage your risk.
Thursday 23 Jul 2026
See chart for latest
The dollar sits firm as the natural pull in a week that opened with an equity wobble and a haven bid, so the crosses trade the same risk-off-versus-steadying tension the equity tape does.
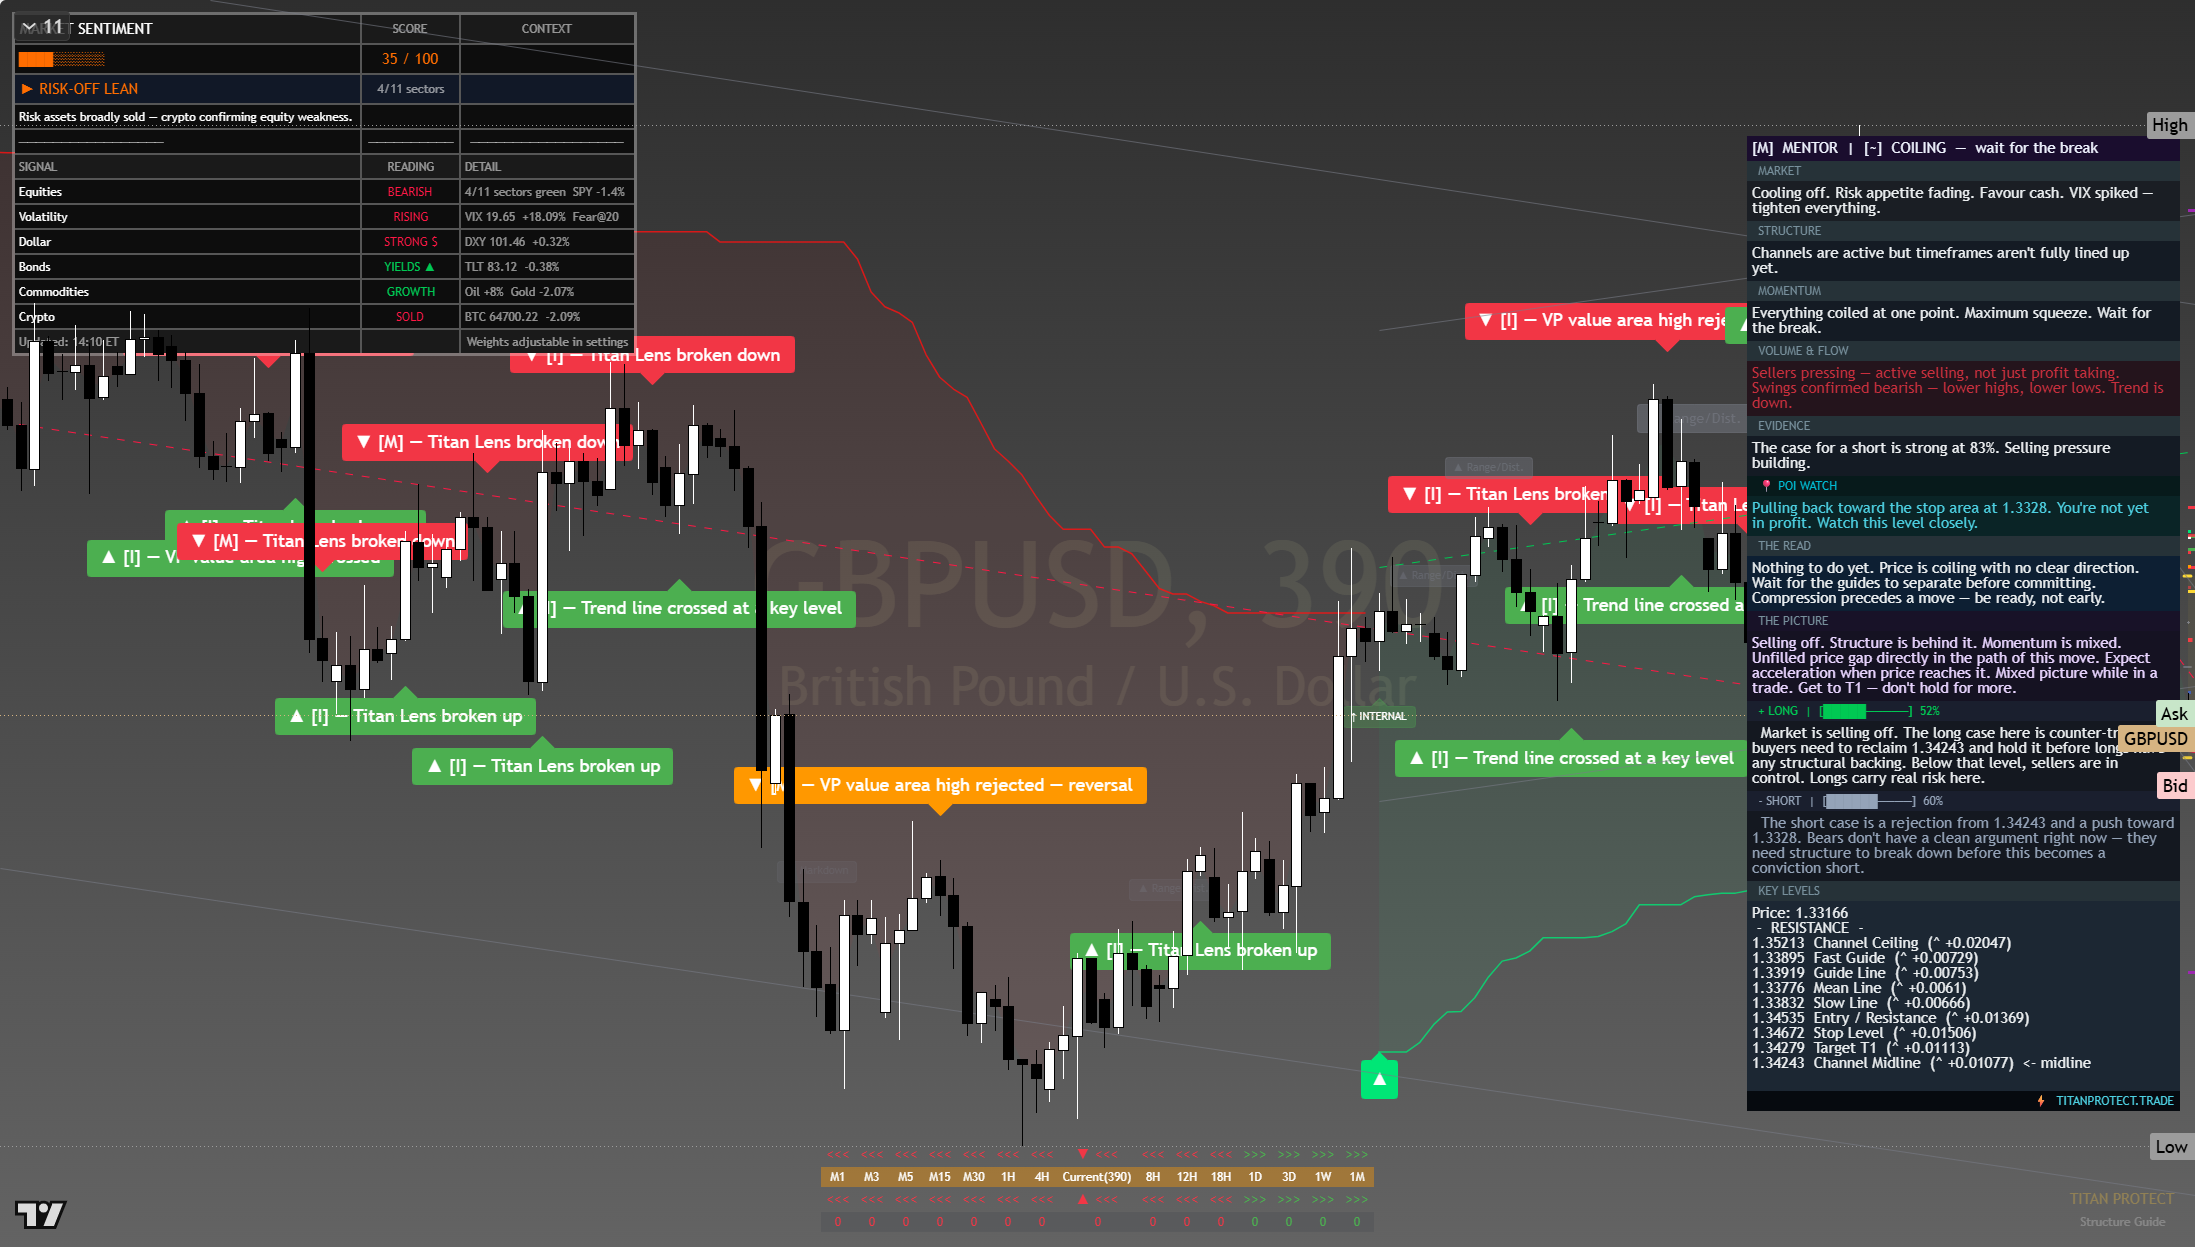
The chart above is the full daily read: structure, momentum, the levels that matter, and where the current price sits against them. Read it top to bottom for the complete picture, and pair it with our session briefs for the wider market context.
This is analysis, not financial advice. It reflects our multi-factor framework and is not a recommendation to buy or sell. Always do your own research and manage your risk.
Wednesday 22 Jul 2026
See chart for latest
The dollar sits firm as the natural pull in a week that opened with an equity wobble and a haven bid, so the crosses trade the same risk-off-versus-steadying tension the equity tape does.
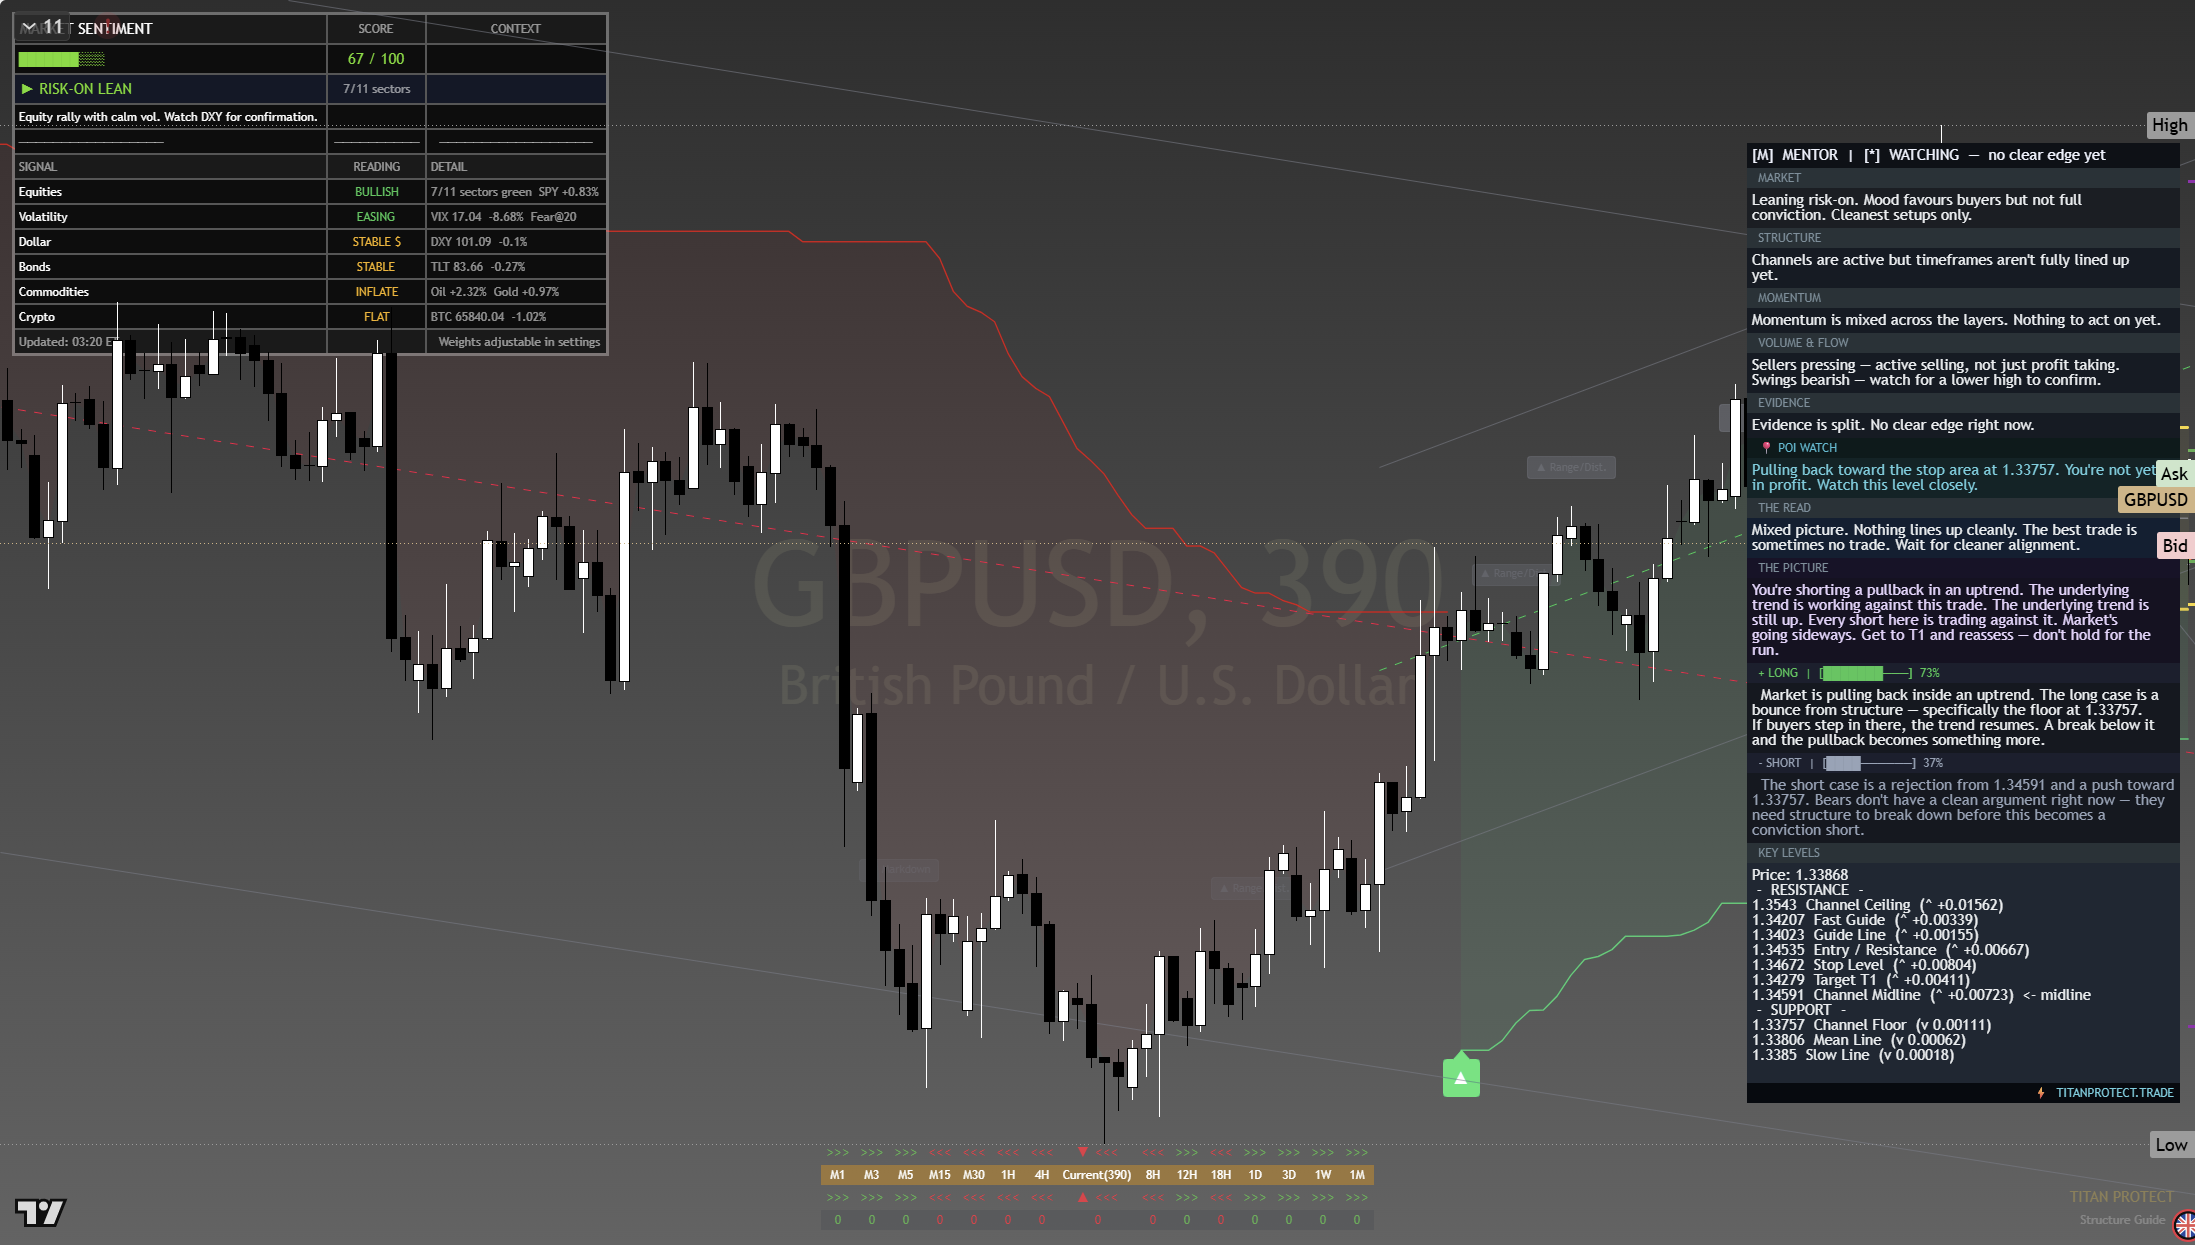
The chart above is the full daily read: structure, momentum, the levels that matter, and where the current price sits against them. Read it top to bottom for the complete picture, and pair it with our session briefs for the wider market context.
This is analysis, not financial advice. It reflects our multi-factor framework and is not a recommendation to buy or sell. Always do your own research and manage your risk.
Monday 20 Jul 2026
See chart for latest
The dollar sits firm as the natural pull in a week that opened with an equity wobble and a haven bid, so the crosses trade the same risk-off-versus-steadying tension the equity tape does.
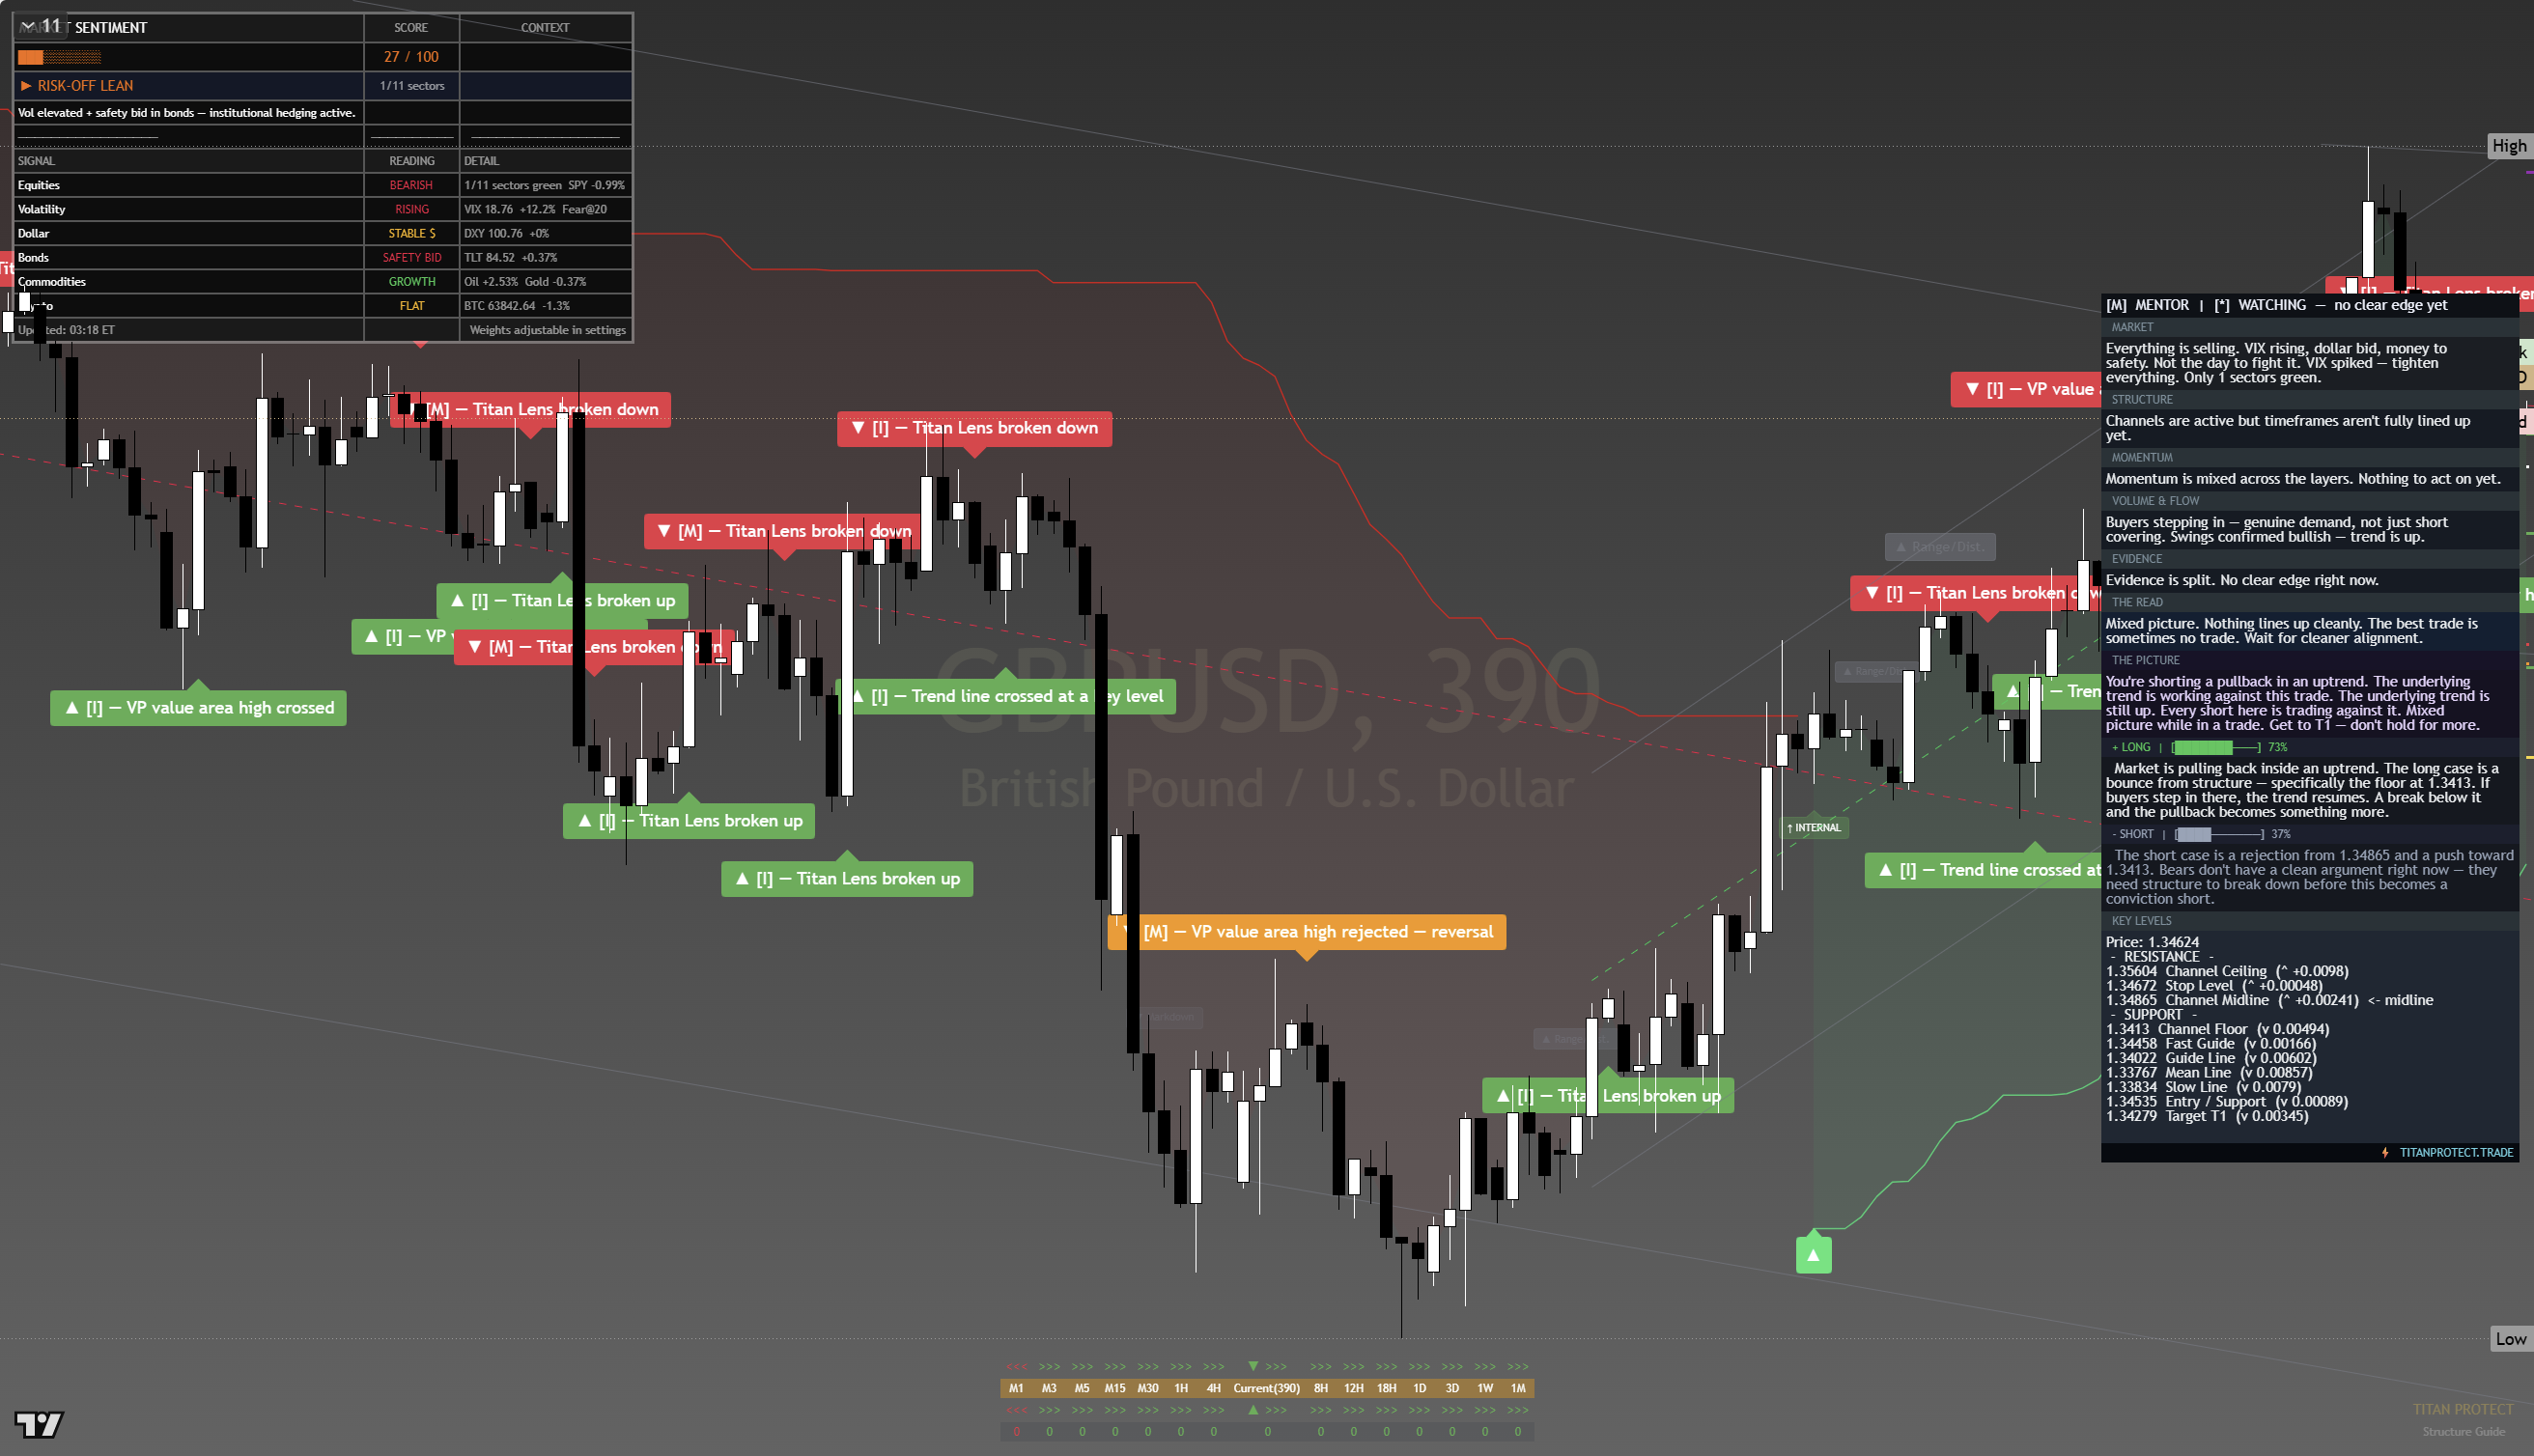
The chart above is the full framework read: structure, momentum, the levels that matter, and where the current price sits against them. Read it top to bottom for the complete picture, and pair it with our session briefs for the wider market context.
This is analysis, not financial advice. It reflects our multi-factor framework and is not a recommendation to buy or sell. Always do your own research and manage your risk.
Wednesday 15 Jul 2026
Sterling (GBP/USD) Stalls at 1.3390 as Cable Refuses the Dollar-Down Tailwind: Daily Framework Read, Tuesday 14 July 2026
Sterling (GBP/USD) | Daily Framework Read | Tuesday 14 July 2026
A dovish inflation surprise softened the dollar and lifted risk, and that backdrop is a tailwind for sterling. But cable spent the day proving it needs more than a dollar story to move, closing dead flat while the commodity currencies led the board higher. We lean cautiously long into Wednesday, buying dips into the 1.3368 to 1.3388 shelf rather than chasing, with 1.3342 the line that says the pound has lost the thread. The one force that can flip this in a single candle is the live crude premium sitting near 79.82, because a fresh oil spike reopens the inflation fight the cool print just closed.
Where It Sits Today
Sterling settled the US cash close at 1.3390, a gain of 0.02% that is a flat line dressed as a green number. The session range was narrow and heavy, hugging the figure without conviction in either direction. That would be an unremarkable day on most tapes. It is a remarkable day on this one, because everything around the pound was screaming higher.
Here is the context that makes the flat print loud. June headline consumer inflation fell 0.4% on the month against expectations of a 0.2% dip, dragging the annual rate to 3.5% from 3.8%, with core flat and the annual core easing to 2.6%. That was the coolest monthly reading in more than six years. Treasury yields dropped sharply, the dollar index faded a 101.32 high all the way to a 100.61 low before settling at 100.94, down 0.34%, and the fear gauge deflated 3.85% to 16.5. Risk appetite came roaring back. The US Tech 100 (NAS100) added 1.1% and the broad benchmark closed higher. In that environment, a currency priced against the dollar should have been pulled up almost mechanically. Sterling refused.
The commodity block shows what a willing currency did with the same tailwind: the kiwi led, the aussie followed, and the Canadian dollar strengthened hard on a live crude bid. Cable sat them all out. When the dollar falls and the pound will not follow, that refusal is the information. It leaves sterling relatively heavy against the euro even on a dollar-soft day, and it tells us the pound is carrying a domestic weight the dollar story alone cannot lift.
What the Framework Reads
Strip the day to its skeleton and there are two forces pulling on cable in opposite directions. The external force is clean and supportive: a shelved rate-hike path, softer US yields and a dollar that just took a dovish surprise. That is a tailwind, and it is real. The internal force is the one holding sterling back, and it showed up as the pound’s flat refusal to join a move it should have led. The framework reads this as a currency with a supportive backdrop and a domestic anchor, and the anchor won today.
That combination sets the character of the trade. This is not a breakout to chase, because the pound has already shown it will not chase itself. It is a lean to build patiently, using the softer dollar as a floor rather than a launchpad. The distinction matters. A currency being pulled up by the dollar wants to be bought on dips into support, not bought on strength into resistance it has already declined to test. Sterling spent Tuesday declining to test it.
There is a second thread, and it is the tension the whole desk is holding tonight. The same cooling energy that dragged the inflation number lower is a backward-looking read. The live crude price did the opposite today, adding 2.15% to 79.82 on a fresh supply premium tied to the Hormuz risk that will not fade. For sterling that cuts in a specific way. The dovish, dollar-negative half of the story supports cable. The rising-oil half is a latent inflation force that, if it re-escalates, snaps the dollar back and pulls the tailwind out from under the pound in a single headline. Two ideas held at once: the dollar is soft, and the dollar has an oil-shaped escape hatch.
The cleanest way to express a soft dollar through sterling is not to buy a pound that already refused to rally, it is to let it come back to you. While the dovish tailwind holds and yields stay soft, our analysis favours dip entries into the 1.3368 to 1.3388 shelf, where the dollar-negative backdrop provides a floor, with a defined stop below 1.3342 and a first objective at 1.3445. That is a roughly two-to-one structure with the wider tape leaning your way. This is what we are watching, not an instruction to act.
Key Levels
These are the working zones we are watching into Wednesday, built off tonight’s closing mark of 1.3390. They are references to trade around the data, not lines to hold blindly through it. The number that reprices every one of them is the 08:30 New York producer inflation print, backed by the live crude premium.
Zones are session references, not signals. A hot producer print or a fresh supply headline can invalidate every one of these in a single candle. Position against your own plan and risk limit, never against a single number.
Three Scenarios Into Wednesday’s Producer Print
Three ways cable can run from a flat close, and how we frame the distribution rather than forecast one path. The hinge for all three is the 08:30 producer inflation number and whether the live oil premium stays contained.
Probabilities sum to 100% and describe how we frame the distribution, not a prediction of a single path.
The tell that separates scenario one from scenario three is the dollar, exactly as it was today. If the dollar index softens ahead of or into the producer number, the cool read is being confirmed early and sterling gets a second chance to catch the move it skipped. If the dollar firms into the release, the market is bracing for a hot print, and a pound this heavy is the first place that pressure lands.
Risk Score
We score the risk on a fresh sterling position into Wednesday at roughly 58%, moderate to elevated. The single biggest binary of the week, the consumer inflation print, cleared dovishly, which takes the top off the tail. But three live threads keep this from being a clean tape.
The dovish rate path is the reason to lean long on cable, but the same crude bid lifting the commodity block today is the force that can rip that reason away. A supply-premium spike near 79.82 does not just hit oil, it reopens the hike conversation the cool consumer print just closed, firms the dollar and lands hardest on the weakest currency on the board, which today was the pound. A sterling long is not a free trade while the Hormuz premium sits bid. Keep the oil tail hedged, not ignored, and honour the 1.3342 invalidation without negotiation.
How to Walk It
One tape, several horizons, and a deliberately patient posture. With the week’s biggest data point behind the tape we move to standard sizing from the reduced stance held through the release, but the pound’s own hesitation argues for building rather than chasing.
The whole plan is calibrated to one truth: sterling had every reason to rally today and chose not to. That does not kill the long idea, the dollar-negative backdrop is real, but it changes how you take it. You buy the pull-back into support with a hard stop, you do not pay up for a currency that has already shown you it will not chase itself.
Cautiously long on dips into 1.3368 to 1.3388 with a soft dollar behind it, invalid below 1.3342, but a pound that refused a strong tailwind and a live oil premium near 79.82 both say build patiently, do not chase.
Continue Reading
Each brief on tonight’s desk takes one thread of the session deeper. Where to turn next:
- Why the dollar cracked first and the majors split, with the euro leading and sterling stalling, is mapped across the whole board in the dollar story.
- The anatomy of the cool print, why cooling energy did the heavy lifting and what a shelved hike path does to yields, is laid out in the rate path and the economic story.
- The single crude price marching to its own drum while official energy cooled, and what the Hormuz premium means cross-asset, is pulled together in the cross-asset overwatch.
- The levels that matter now, from the currency board to the crude premium that will not fade, are mapped in the hot zones.
Disclaimer
This is an end-of-day framework read on the Tuesday 14 July US cash close and a preview of the Wednesday 15 July session for sterling (GBP/USD), framed on tonight’s closing mark, the live geopolitical backdrop and the published calendar. This is analysis, not financial advice. Always manage your own risk. Currency markets carry risk, leverage magnifies it, and you are responsible for your own decisions and risk limits. Levels and scenarios can be invalidated by a single headline or a single data print. Do your own work before you act.
Monday 13 Jul 2026
GBP/USD Slips to 1.3351 as the Oil Shock Bids the Dollar, 1.3300 Becomes the Line Into CPI Eve
British Pound versus US Dollar (GBP/USD) | Daily Framework Read | Monday 13 July 2026 (US close)
Cable spent Monday on the back foot, closing near 1.3351 for a loss of roughly half a percent as a fresh oil supply scare pulled the dollar higher across the board. The pair opened at 1.3401, tagged 1.3412 early, then bled steadily to a session low of 1.3343 as haven flow rewarded the greenback and the Swiss franc. Sterling is a net energy importer’s currency, so a nine percent surge in crude is a terms of trade headwind, not a tailwind. With CPI, Fed Chair testimony and the first bank earnings all landing Tuesday, the read is defensive: sellers hold the whip hand while price trades under 1.3400, and the real battle is whether 1.3300 survives the event risk.
Softly bearish into the CPI print. The oil-led dollar bid, a higher fear gauge and a two percent slide in risk assets all cut against a risk-sensitive currency like sterling. We favour selling strength back toward the broken 1.3400 open, with 1.3300 the pivotal floor. A clean daily close back above 1.3412 neutralises the bias; a break of 1.3343 opens the round number below.
Where it sits today
GBP/USD changed hands at 1.3351 at the US close, down about 0.48 percent on the session. The day carved a range from a 1.3412 high to a 1.3343 low, and the pair finished within a few pips of that low, which tells you sellers, not buyers, owned the late tape. The 1.3401 open is now the first line of resistance overhead, having flipped from support to a level price must reclaim.
The move was not sterling-specific. The dollar index firmed around a third of a percent, and the classic haven pair USD/CHF jumped nearly a full percent as capital sought shelter from the crude spike and the wobble in equities. When the dollar is bid on fear rather than on growth, current-account currencies such as the pound tend to sit at the wrong end of the flow. That is exactly how Monday played out.
What the framework reads
Our composite read on cable turned defensive through the US afternoon. The structure is a lower-high, lower-close day that rejected the 1.3400 handle and closed on its lows, the sort of print that carries momentum into the next session unless a catalyst flips it. Trend pressure leans down, and the failure to hold the open removed the near-term bullish case that had built up last week.
Positioning adds a wrinkle. Speculative accounts had crept modestly net long sterling into this week, which is a double-edged sword: it means there are stretched longs to shake out if the dollar bid persists, and a break of 1.3343 could see those hands hit the exits and accelerate the move. On the other side, that same long lean can cushion a dip if CPI comes in soft and the dollar unwinds. The framework treats this as a market that is short of conviction and long of nerves, waiting for Tuesday to decide.
The macro thread matters here more than usual. Crude rallying nine percent on Hormuz supply risk is not a neutral event for the pound. The United Kingdom imports the bulk of its energy, so a sustained oil spike worsens the trade balance and raises the imported-inflation problem the Bank of England is already wrestling with. That is stagflationary at the margin, which is why a higher oil price tends to weigh on cable even as it lifts commodity currencies. Layer on a fear gauge that finally snapped higher and a two percent drop in tech into CPI eve, and the risk backdrop is plainly unfriendly to sterling.
If Tuesday’s CPI surprises soft and the oil premium fades, the modestly long positioning becomes fuel for a snap-back. A daily reclaim of 1.3400, then a close above the 1.3412 high, would flip the near-term read and put 1.3450 and the 1.3500 round number back on the table. That is the asymmetric long trigger to respect, not to anticipate.
A hot CPI, a hawkish Fed Chair testimony, or a further leg in crude keeps the dollar bid and slices 1.3343. That break exposes 1.3300, and a failure there uncovers 1.3250 quickly as stretched longs capitulate. Event risk is stacked on a single Tuesday session, so gaps and whippy spreads are the real hazard, not just direction.
Key levels
| Level | Price | What it means |
|---|---|---|
| Resistance 3 | 1.3500 | Round-number ceiling and last week’s supply shelf. Only in play on a soft CPI unwind. |
| Resistance 2 | 1.3412 | Session high. A daily close above here neutralises the bearish read. |
| Resistance 1 | 1.3401 | Monday’s open, now broken. First rally target for sellers, support turned resistance. |
| Spot | 1.3351 | US close. Sitting near the day’s low, sellers in control. |
| Support 1 | 1.3343 | Session low. The trapdoor. A break invites momentum sellers. |
| Support 2 | 1.3300 | Pivotal round number. The floor the whole read hinges on into CPI. |
| Support 3 | 1.3250 | Next shelf below. The downside objective if 1.3300 fails on a hot print. |
Three scenarios into Tuesday’s CPI
Correction lower, 45 percent. A firm CPI or a fresh oil leg keeps the dollar bid, 1.3343 gives way, and price works toward 1.3300 with 1.3250 in reach on a clean break. This is the path of least resistance while the pair trades under the 1.3400 open.
Sideways chop, 35 percent. The market refuses to commit ahead of a triple catalyst and grinds in the 1.3343 to 1.3401 band, bleeding volatility until the numbers print. Range tactics only, fade the edges.
Bullish reclaim, 20 percent. A soft CPI and an easing oil premium unwind the dollar, the modest long lean fuels a squeeze, and cable reclaims 1.3401 then 1.3412 to reopen 1.3450 and 1.3500.
Risk score
Framework risk on any position here reads elevated, roughly 65 percent. The factor breakdown:
- Event density: CPI, Fed Chair testimony and bank earnings all in one Tuesday session. Single-day gap risk is the dominant hazard.
- Volatility regime: the fear gauge has snapped higher, so ranges are widening and spreads are thinning.
- Positioning: a modest speculative long lean means a downside break can accelerate on stops.
- Macro drag: the oil terms-of-trade hit is a structural negative for sterling specifically, not just a broad risk-off tilt.
How to walk it
This is a reduced-size session, not a full-conviction one. With the event risk parked on Tuesday, size down and let the market come to a level rather than chasing the close.
Preferred, sell the rally: look to fade strength into the 1.3385 to 1.3400 zone, the broken open. A protective stop above 1.3420 keeps the adverse move to roughly 0.26 percent from a 1.3390 entry. First target 1.3300 for about 0.67 percent, second target 1.3250 for about 1.05 percent. That frames a reward to risk near 2.5 to one on the first leg and better than three to one to the second, which is the kind of asymmetry worth waiting for.
Alternative, the break trigger: a decisive move through 1.3343 can be sold on the retest, same 1.3300 and 1.3250 objectives, with a tight stop back above the level. Do not pre-empt the break.
Invalidation: a daily close back above 1.3412 flips the read and the short thesis is off. Stand aside through the CPI release itself if you cannot stomach gap risk, then trade the reaction, not the anticipation.
This is a framework read for educational purposes and is not financial advice. Levels reflect the US close on Monday 13 July 2026 and will move with the market. Manage your own risk.
- The Dollar’s Fear Bid: Why Hormuz Oil Is Rewriting the FX Playbook
- Sterling and the Energy Import Problem: Terms of Trade in a Crude Spike
- CPI Eve Positioning: How the Fear Gauge Reset the Week’s Risk Map
- Reading the Round Numbers: Why 1.3300 Is the Line That Matters
Sunday 12 Jul 2026
Ethereum (ETH/USD) — Daily Framework Read | Saturday 11 July 2026
Ethereum (ETH/USD) | Post Close Setup Framework Read | Data basis: 2026-07-11 close
Where It Sits
Structure
Structurally Ethereum (ETH/USD) sits above its short-term moving averages with the daily trend firmly higher. The recent advance has been orderly with no signs of distribution or topping behaviour. The reference anchor at 1,788.93 acts as the bias line.
Momentum
Momentum is firm with the daily timeframe showing clear acceleration. Internal readings sit in the upper portion of the range. The risk is not that momentum fails but that it stalls at round-number resistance and triggers profit-taking.
Volume & Flow
Flow on the session close was measured. Positioning data suggests steady accumulation rather than aggressive directional commitment. The pattern supports continuation rather than reversal.
Key Levels
| Level | Type | Significance | Action Zone |
|---|---|---|---|
| 1,891 | Resistance | Upper range target, prior supply zone | Take profits / fade if rejected |
| 1,823 | Pivot | Mid-range continuation marker | Hold = constructive; lose = consolidation |
| 1,789 | Session close | Reference anchor for next session | Above = continuation; below = mean revert |
| 1,734 | Support | Recent range floor, demand zone | Buy zone with defined stop |
| 1,666 | Major support | Prior breakout retest level | Stop-out below for longs |
Three Scenarios
Continuation
Ethereum (ETH/USD) holds 1,788.93 and pushes higher on continued institutional flow and positive macro mood. The 24/7 tape supports trending moves when traditional markets are risk-on.
Range
Ethereum (ETH/USD) churns around 1,788.93. Range-bound without a fresh catalyst. Weekend liquidity dynamics can create noise.
Mean Reversion
Ethereum (ETH/USD) fades on a risk-off shift or specific headline, breaks support. Crypto gives back faster than it gains — size discipline essential.
Risk Score
Risk sits at Around 60%
Risk sits around 60 per cent. Vix at 15.0 supports a measured risk posture. sentiment at 50 is neutral. Crypto carries 24/7 liquidity risk and higher-beta positioning. Standard sizing with defined stops — discipline beats conviction.
How to Walk It
Entry / Stop / Target structure:
- Long 1,734 pullback | Stop 1,666 | Target 1,823 | R:R 2:1
- Long 1,823 breakout | Stop 1,789 | Target 1,891 | R:R 1.5:1
- Fade 1,891 rejection | Stop above resistance | Target 1,789 | R:R 2:1
Experience-level guidance:
Beginner: Reduce size to half your standard. Trade only the cleanest setup from the entries above. If the tape opens against your bias, do nothing — wait for the second hour, when the institutional flow has tipped its hand.
Intermediate: Use the levels table to define the trading range. Fade the extremes with defined stops, take profits before the round-number resistance levels.
Advanced: The vol regime supports defined-risk structures around the key pivot levels. Keep notional small relative to your book — asymmetric speculation, not core positioning.
Continue Reading
The macro frame driving this read is unpacked in the session briefs:
Check the latest session briefs on the site.
This analysis is for educational and informational purposes only. It does not constitute financial advice. Always manage your risk independently and in accordance with your own financial circumstances.
Friday 10 Jul 2026
Ethereum (ETH/USD) — Daily Framework Read | Friday 10 July 2026
Ethereum (ETH/USD) | Post Close Setup Framework Read | Data basis: 2026-07-10 close
Where It Sits
Structure
Structurally Ethereum (ETH/USD) sits above its short-term moving averages with the daily trend firmly higher. The recent advance has been orderly with no signs of distribution or topping behaviour. The reference anchor at 1,788.93 acts as the bias line.
Momentum
Momentum is firm with the daily timeframe showing clear acceleration. Internal readings sit in the upper portion of the range. The risk is not that momentum fails but that it stalls at round-number resistance and triggers profit-taking.
Volume & Flow
Flow on the session close was measured. Positioning data suggests steady accumulation rather than aggressive directional commitment. The pattern supports continuation rather than reversal.
Key Levels
| Level | Type | Significance | Action Zone |
|---|---|---|---|
| 1,891 | Resistance | Upper range target, prior supply zone | Take profits / fade if rejected |
| 1,823 | Pivot | Mid-range continuation marker | Hold = constructive; lose = consolidation |
| 1,789 | Session close | Reference anchor for next session | Above = continuation; below = mean revert |
| 1,734 | Support | Recent range floor, demand zone | Buy zone with defined stop |
| 1,666 | Major support | Prior breakout retest level | Stop-out below for longs |
Three Scenarios
Continuation
Ethereum (ETH/USD) holds 1,788.93 and pushes higher on continued institutional flow and positive macro mood. The 24/7 tape supports trending moves when traditional markets are risk-on.
Range
Ethereum (ETH/USD) churns around 1,788.93. Range-bound without a fresh catalyst. Weekend liquidity dynamics can create noise.
Mean Reversion
Ethereum (ETH/USD) fades on a risk-off shift or specific headline, breaks support. Crypto gives back faster than it gains — size discipline essential.
Risk Score
Risk sits at Around 60%
Risk sits around 60 per cent. Vix at 15.0 supports a measured risk posture. sentiment at 50 is neutral. Crypto carries 24/7 liquidity risk and higher-beta positioning. Standard sizing with defined stops — discipline beats conviction.
How to Walk It
Entry / Stop / Target structure:
- Long 1,734 pullback | Stop 1,666 | Target 1,823 | R:R 2:1
- Long 1,823 breakout | Stop 1,789 | Target 1,891 | R:R 1.5:1
- Fade 1,891 rejection | Stop above resistance | Target 1,789 | R:R 2:1
Experience-level guidance:
Beginner: Reduce size to half your standard. Trade only the cleanest setup from the entries above. If the tape opens against your bias, do nothing — wait for the second hour, when the institutional flow has tipped its hand.
Intermediate: Use the levels table to define the trading range. Fade the extremes with defined stops, take profits before the round-number resistance levels.
Advanced: The vol regime supports defined-risk structures around the key pivot levels. Keep notional small relative to your book — asymmetric speculation, not core positioning.
Continue Reading
The macro frame driving this read is unpacked in the session briefs:
Check the latest session briefs on the site.
This analysis is for educational and informational purposes only. It does not constitute financial advice. Always manage your risk independently and in accordance with your own financial circumstances.
Thursday 9 Jul 2026
GBP/USD — Daily Framework Read | Thursday 9 July 2026
GBP/USD | Post Close Setup Framework Read | Data basis: 2026-07-09 close
Where It Sits
Structure
Structurally GBP/USD sits above its short-term moving averages with the daily trend firmly higher. The recent advance has been orderly with no signs of distribution or topping behaviour. The reference anchor at 1.3410 acts as the bias line.
Momentum
Momentum is neutral with internal readings near the centre of the range. That is the signature of a market digesting the prior move. The tape needs a fresh catalyst to commit to direction.
Volume & Flow
Volume data is limited for this session. The positioning read is neutral — no obvious skew in either direction. Watch for flow confirmation on the next session.
Key Levels
| Level | Type | Significance | Action Zone |
|---|---|---|---|
| 1.3481 | Resistance | Upper range target, prior supply zone | Take profits / fade if rejected |
| 1.3434 | Pivot | Mid-range continuation marker | Hold = constructive; lose = consolidation |
| 1.3410 | Session close | Reference anchor for next session | Above = continuation; below = mean revert |
| 1.3371 | Support | Recent range floor, demand zone | Buy zone with defined stop |
| 1.3324 | Major support | Prior breakout retest level | Stop-out below for longs |
Three Scenarios
Continuation
GBP/USD holds the session close at 1.3410 and pushes higher on continued positioning flow. The broader trend remains intact. Watch the dollar tape for confirmation.
Range
GBP/USD opens flat and ranges around 1.3410. Neither side has conviction without a fresh data catalyst. Range trade dominates.
Mean Reversion
GBP/USD breaks below support on a shift in dollar positioning. Mean reversion within the broader trend. Watch for a clean test of support before committing.
Risk Score
Risk sits at Around 45%
Risk sits around 45 per cent. Vix at 15.8 supports a measured risk posture. sentiment at 47 is neutral. Currency pairs carry intervention and data-release headline risk. Standard sizing with defined stops — discipline beats conviction.
How to Walk It
Entry / Stop / Target structure:
- Long 1.3371 pullback | Stop 1.3324 | Target 1.3434 | R:R 2:1
- Long 1.3434 breakout | Stop 1.3410 | Target 1.3481 | R:R 1.5:1
- Fade 1.3481 rejection | Stop above resistance | Target 1.3410 | R:R 2:1
Experience-level guidance:
Beginner: Reduce size to half your standard. Trade only the cleanest setup from the entries above. If the tape opens against your bias, do nothing — wait for the second hour, when the institutional flow has tipped its hand.
Intermediate: Use the levels table to define the trading range. Fade the extremes with defined stops, take profits before the round-number resistance levels.
Advanced: The vol regime supports defined-risk structures around the key pivot levels. Keep notional small relative to your book — asymmetric speculation, not core positioning.
Continue Reading
The macro frame driving this read is unpacked in the session briefs:
Check the latest session briefs on the site.
This analysis is for educational and informational purposes only. It does not constitute financial advice. Always manage your risk independently and in accordance with your own financial circumstances.
Wednesday 8 Jul 2026
British Pound (GBP/USD) Holds 1.3353 as Dollar Firms into Wednesday
British Pound (GBP/USD) | Daily Framework Read | Tuesday 7 July 2026, US close
Where It Sits
Key Levels
| Level | Price | Why It Matters | Action |
|---|---|---|---|
| Resistance | 1.3395 | Prior session supply zone; a firm dollar backdrop caps rallies here unless the dollar loses its footing | Fade strength into this zone unless a clean hourly close holds above it |
| Pivot | 1.3353 | Tonight’s closing print; the line between continuation of dollar strength and a stall | Use as the decision point for Wednesday’s directional bias |
| Support | 1.3305 | Recent demand shelf; a break here opens room toward the next structural floor | A clean break and hold below invites continuation shorts; a reclaim signals dollar-buyer exhaustion |
Bias
Bearish, mildly. The dollar’s strength tonight is broad-based rather than fear-driven, and cable typically grinds lower rather than gaps when the greenback firms on a calm-VIX, rotation-style tape. The bias holds while price stays under 1.3395.
Multi-Strategy Breakdown
- Scalp: Fade rallies into 1.3380-1.3395 for a probe back toward 1.3353, keeping stops tight given the calm volatility regime.
- Intraday: A break of 1.3305 confirms continuation, targeting the next shelf lower with invalidation above pivot.
- Swing: Treat this as part of a broader dollar-firming leg; hold shorts on dips as long as the energy-in, tech-out rotation persists into Wednesday.
Risk Score
Risk sits at Around 35% heading into Wednesday.
The calm VIX at 16.13 argues for a measured approach, but a rotation session like tonight’s can reverse quickly if energy strength fades and tech finds a bid again on Wednesday. Size accordingly and respect the pivot at 1.3353 as the line for reassessment.
Three Scenarios Into Wednesday 8 July
Continuation Lower
Dollar strength persists on the back of the energy rotation, pressing British Pound through 1.3305 toward the next support shelf.
Range Consolidation
Price chops between 1.3305 and 1.3395 as the market digests tonight’s rotation before committing to a fresh direction.
Reversal Higher
A fade in crude strength or a bounce in growth names softens the dollar bid, lifting British Pound back toward 1.3395 and beyond.
Position Sizing
Reserved for confirmed breaks below 1.3305 with the rotation theme intact
Applies now; calm VIX and orderly rotation support normal allocation
Step down if the energy-versus-tech rotation shows signs of reversing intraday
Only if price whipsaws both sides of the 1.3305-1.3395 range without follow-through
This is analysis, not financial advice. Always manage your risk.
Friday 3 Jul 2026
GBP/USD – Daily Read
July 2, 2026 | Forex | Titan Macro Desk
1.36324
Chart-based read for GBP/USD. Framework review data pending for this instrument. Price action and key levels shown on the chart below.

Framework Metrics
This read is generated by the Titan framework and reflects our multi-factor analytical model. It is not financial advice. Past performance is not indicative of future results. Always conduct your own research before making investment decisions.
Thursday 2 Jul 2026
GBP/USD – Daily Read
July 2, 2026 | Forex | Titan Macro Desk
1.36324
Chart-based read for GBP/USD. Framework review data pending for this instrument. Price action and key levels shown on the chart below.
Framework Metrics
This read is generated by the Titan framework and reflects our multi-factor analytical model. It is not financial advice. Past performance is not indicative of future results. Always conduct your own research before making investment decisions.


