
The EURUSD Framework Journal for May 2026, newest read at the top. Each dated entry is our read on the close, kept as a living record so the framework can be judged over time. This is analysis, not financial advice.
Saturday 30 May 2026
EUR/USD — Daily Read | Saturday 30 May 2026
EUR/USD | Post Close Setup Daily Read | Data basis: 2026-05-30 close
Where It Sits
Structure
Structurally EUR/USD sits above its short-term moving averages with the daily trend firmly higher. The recent advance has been orderly with no signs of distribution or topping behaviour. The reference anchor at 1.1673 acts as the bias line.
Momentum
Momentum is neutral with internal readings near the centre of the range. That is the signature of a market digesting the prior move. The tape needs a fresh catalyst to commit to direction.
Volume & Flow
Volume data is limited for this session. The positioning read is neutral — no obvious skew in either direction. Watch for flow confirmation on the next session.
Key Levels
| Level | Type | Significance | Action Zone |
|---|---|---|---|
| 1.1760 | Resistance | Upper range target, prior supply zone | Take profits / fade if rejected |
| 1.1702 | Pivot | Mid-range continuation marker | Hold = constructive; lose = consolidation |
| 1.1673 | Session close | Reference anchor for next session | Above = continuation; below = mean revert |
| 1.1626 | Support | Recent range floor, demand zone | Buy zone with defined stop |
| 1.1567 | Major support | Prior breakout retest level | Stop-out below for longs |
Three Scenarios
Continuation
EUR/USD holds the session close at 1.1673 and pushes higher on continued positioning flow. The broader trend remains intact. Watch the dollar tape for confirmation.
Range
EUR/USD opens flat and ranges around 1.1673. Neither side has conviction without a fresh data catalyst. Range trade dominates.
Mean Reversion
EUR/USD breaks below support on a shift in dollar positioning. Mean reversion within the broader trend. Watch for a clean test of support before committing.
Risk Score
Risk sits at Around 50%
Risk sits around 50 per cent. Vix at 15.4 supports a measured risk posture. sentiment at 61 is in greed territory. Currency pairs carry intervention and data-release headline risk. Standard sizing with defined stops — discipline beats conviction.
How to Walk It
Entry / Stop / Target structure:
- Long 1.1626 pullback | Stop 1.1567 | Target 1.1702 | R:R 2:1
- Long 1.1702 breakout | Stop 1.1673 | Target 1.1760 | R:R 1.5:1
- Fade 1.1760 rejection | Stop above resistance | Target 1.1673 | R:R 2:1
Experience-level guidance:
Beginner: Reduce size to half your standard. Trade only the cleanest setup from the entries above. If the tape opens against your bias, do nothing — wait for the second hour, when the institutional flow has tipped its hand.
Intermediate: Use the levels table to define the trading range. Fade the extremes with defined stops, take profits before the round-number resistance levels.
Advanced: The vol regime supports defined-risk structures around the key pivot levels. Keep notional small relative to your book — asymmetric speculation, not core positioning.
Continue Reading
The macro frame driving this read is unpacked in the session briefs:
Check the latest session briefs on the site.
This analysis is for educational and informational purposes only. It does not constitute financial advice. Always manage your risk independently and in accordance with your own financial circumstances.
Thursday 28 May 2026
Bitcoin (BTC/USD) — Daily Framework Read | Thursday 28 May 2026
Bitcoin (BTC/USD) | Post Close Setup Daily Read | Data basis: 2026-05-28 close
Where It Sits
Structure
Structurally Bitcoin (BTC/USD) has pulled back into the session close. The broader trend remains intact on the daily timeframe but the shorter timeframe has softened. The structure is contested near the 73,274 level.
Momentum
Momentum is positive but measured. The advance has been orderly without stretching the range. Internal readings are constructive without flagging exhaustion — supportive of continuation.
Volume & Flow
Flow on the session close was measured. Positioning data suggests steady accumulation rather than aggressive directional commitment. The pattern supports continuation rather than reversal.
Key Levels
| Level | Type | Significance | Action Zone |
|---|---|---|---|
| 76,000 | Resistance | Upper range target, prior supply zone | Take profits / fade if rejected |
| 74,200 | Pivot | Mid-range continuation marker | Hold = constructive; lose = consolidation |
| 73,274 | Session close | Reference anchor for next session | Above = continuation; below = mean revert |
| 71,800 | Support | Recent range floor, demand zone | Buy zone with defined stop |
| 70,000 | Major support | Prior breakout retest level | Stop-out below for longs |
Three Scenarios
Continuation
Bitcoin (BTC/USD) holds 73,274 and pushes higher on continued institutional flow and positive macro mood. The 24/7 tape supports trending moves when traditional markets are risk-on.
Range
Bitcoin (BTC/USD) churns around 73,274. Range-bound without a fresh catalyst. Weekend liquidity dynamics can create noise.
Mean Reversion
Bitcoin (BTC/USD) fades on a risk-off shift or specific headline, breaks support. Crypto gives back faster than it gains — size discipline essential.
Risk Score
Risk sits at Around 65%
Risk sits around 65 per cent. Vix at 15.7 supports a measured risk posture. sentiment at 60 is in greed territory. Crypto carries 24/7 liquidity risk and higher-beta positioning. Standard sizing with defined stops — discipline beats conviction.
How to Walk It
Entry / Stop / Target structure:
- Long 71,800 pullback | Stop 70,000 | Target 74,200 | R:R 2:1
- Long 74,200 breakout | Stop 73,274 | Target 76,000 | R:R 1.5:1
- Fade 76,000 rejection | Stop above resistance | Target 73,274 | R:R 2:1
Experience-level guidance:
Beginner: Reduce size to half your standard. Trade only the cleanest setup from the entries above. If the tape opens against your bias, do nothing — wait for the second hour, when the institutional flow has tipped its hand.
Intermediate: Use the levels table to define the trading range. Fade the extremes with defined stops, take profits before the round-number resistance levels.
Advanced: The vol regime supports defined-risk structures around the key pivot levels. Keep notional small relative to your book — asymmetric speculation, not core positioning.
Continue Reading
The macro frame driving this read is unpacked in the session briefs:
Check the latest session briefs on the site.
This analysis is for educational and informational purposes only. It does not constitute financial advice. Always manage your risk independently and in accordance with your own financial circumstances.
Thursday 28 May 2026
Bitcoin (BTC/USD) — Daily Framework Read | Thursday 28 May 2026
Bitcoin (BTC/USD) | Pre Asia Setup Daily Read | Data basis: 2026-05-28 close
Where It Sits
Structure
Structurally Bitcoin (BTC/USD) has pulled back into the session close. The broader trend remains intact on the daily timeframe but the shorter timeframe has softened. The structure is contested near the 74,307 level.
Momentum
Momentum is firm with the daily timeframe showing clear acceleration. Internal readings sit in the upper portion of the range. The risk is not that momentum fails but that it stalls at round-number resistance and triggers profit-taking.
Volume & Flow
Flow on the session close was measured. Positioning data suggests steady accumulation rather than aggressive directional commitment. The pattern supports continuation rather than reversal.
Key Levels
| Level | Type | Significance | Action Zone |
|---|---|---|---|
| 76,900 | Resistance | Upper range target, prior supply zone | Take profits / fade if rejected |
| 75,200 | Pivot | Mid-range continuation marker | Hold = constructive; lose = consolidation |
| 74,307 | Session close | Reference anchor for next session | Above = continuation; below = mean revert |
| 72,900 | Support | Recent range floor, demand zone | Buy zone with defined stop |
| 71,200 | Major support | Prior breakout retest level | Stop-out below for longs |
Three Scenarios
Continuation
Bitcoin (BTC/USD) holds 74,307 and pushes higher on continued institutional flow and positive macro mood. The 24/7 tape supports trending moves when traditional markets are risk-on.
Range
Bitcoin (BTC/USD) churns around 74,307. Range-bound without a fresh catalyst. Weekend liquidity dynamics can create noise.
Mean Reversion
Bitcoin (BTC/USD) fades on a risk-off shift or specific headline, breaks support. Crypto gives back faster than it gains — size discipline essential.
Risk Score
Risk sits at Around 65%
Risk sits around 65 per cent. Vix at 16.3 supports a measured risk posture. sentiment at 61 is in greed territory. Crypto carries 24/7 liquidity risk and higher-beta positioning. Standard sizing with defined stops — discipline beats conviction.
How to Walk It
Entry / Stop / Target structure:
- Long 72,900 pullback | Stop 71,200 | Target 75,200 | R:R 2:1
- Long 75,200 breakout | Stop 74,307 | Target 76,900 | R:R 1.5:1
- Fade 76,900 rejection | Stop above resistance | Target 74,307 | R:R 2:1
Experience-level guidance:
Beginner: Reduce size to half your standard. Trade only the cleanest setup from the entries above. If the tape opens against your bias, do nothing — wait for the second hour, when the institutional flow has tipped its hand.
Intermediate: Use the levels table to define the trading range. Fade the extremes with defined stops, take profits before the round-number resistance levels.
Advanced: The vol regime supports defined-risk structures around the key pivot levels. Keep notional small relative to your book — asymmetric speculation, not core positioning.
Continue Reading
The macro frame driving this read is unpacked in the session briefs:
Check the latest session briefs on the site.
This analysis is for educational and informational purposes only. It does not constitute financial advice. Always manage your risk independently and in accordance with your own financial circumstances.
Tuesday 26 May 2026
The Euro has been fighting Dollar weakness all week and winning. The pair pushed to a fresh high earlier in the session, pulled back into a well-established demand zone, and then recovered into the close. That sequence, an attempt at a high, a controlled test of support, and a close in the upper half of the weekly range, is the kind of price action that precedes further upside rather than a reversal. The structure is clearly defined. Sellers have tried repeatedly to regain control and failed.
The analysis flagged trend line breaks at key highs and lows this week, and the read throughout has remained long. A key development was the moment when the pair broke through a prior reference level mid-week and then came back to retest it from above. That retest held. When a level that was previously resistance flips to support and price confirms it, that is about as clean a continuation signal as FX gives you. The momentum has been building in EUR’s favour for several sessions now.
The level to watch on any Tuesday open is the 1.1270 to 1.1290 zone. That is where the prior breakout occurred and where buyers stepped in on the mid-week retest. A clean hold there keeps the 1.1400 target alive. A break below 1.1250 on volume would be a different conversation entirely, suggesting the weekly structure is in question and requiring a reassessment of the bias before committing fresh capital.
| Level | Price | Notes |
|---|---|---|
| Entry Zone | 1.1270 – 1.1295 | Breakout retest zone, prior resistance flipped support |
| Stop | 1.1220 | Below structural demand, weekly bias invalidated |
| Target 1 | 1.1400 | Weekly resistance, measured upside |
| Target 2 | 1.1480 | Extension target, multi-month level |
| R:R | 2.9 : 1 | To Target 1 from mid-entry |
The structural setup here is one of the cleaner ones in FX right now. The trend is defined, the levels are clear, and the analysis has been consistent. The risk score sits at 40% primarily because of two factors: the extended nature of the Dollar’s decline and the bank holiday weekend effect on liquidity. EUR/USD is also highly sensitive to any shift in ECB or Fed commentary over the weekend. If a central bank official makes noise, the pair can move 50 to 80 pips before anyone can react. That is a calendar risk, not a structural one.
The best EUR/USD setups always come from patience. If you missed the move earlier in the week, the long weekend actually gives you an opportunity rather than a problem. Wait for Tuesday’s open, watch how the pair trades through the first hour, and only enter if the 1.1270 to 1.1295 zone holds. An impulsive entry on Sunday evening or at the first sign of a gap higher is how traders give back profits. Let the structure confirm first, then size in. The trade is not going anywhere if the thesis is right.
Saturday 23 May 2026
Euro / Dollar (EUR/USD) — Weekend Daily Read
Framework Bias
NEUTRAL BIAS
EUR/USD dipped 0.18% on Friday to 1.1605, giving back a small portion of recent gains. The pair has been in a strong uptrend through 2026, driven by dollar weakness. The DXY at 99.32 reflects a US dollar that is well off its peak strength, and as long as that stays below 100, EUR/USD has structural support.
Friday’s modest pullback from 1.1625 to 1.1605 is not a trend reversal; it is a pause. The question for the week ahead is whether the pair consolidates in the 1.16 to 1.17 range before the next leg higher, or whether Monday’s thin-market conditions allow a more exaggerated move to test either the 1.15 support or the 1.17 resistance.
The framework is neutral at current levels because the pair is in the middle of a range rather than at a clearly defined edge. Neutral does not mean do nothing; it means wait for the range to give you an entry at an extreme rather than chasing the middle. The 1.1593 Friday low and the 1.1625 Friday high define the immediate range to watch.
Key Levels
| Level Type | Price | Note |
|---|---|---|
| Major Resistance | 1.1800 | Multi-year high zone and key upside target |
| Near Resistance | 1.1700 | Round number and recent swing high area |
| Near Resistance | 1.1625 | Friday session high |
| Current Price | 1.1605 | Friday close |
| Near Support | 1.1593 | Friday session low |
| Key Support | 1.1500 | Round number and prior breakout level |
| Major Support | 1.1350 | Monthly demand and structural base |
Trade Framework
| Scenario | Entry Zone | Stop | Target | R:R |
|---|---|---|---|---|
| Long from key support | 1.1500 to 1.1520 | 1.1450 | 1.1650 | approx 3.0:1 |
| Long on 1.1625 break and hold | 1.1630 | 1.1570 | 1.1750 | approx 2.0:1 |
| Short at major resistance | 1.1780 to 1.1800 | 1.1830 | 1.1620 | approx 5.3:1 |
Confidence level: around 55%. The pair is mid-range in a neutral setup. The 55% reflects the lack of a clean edge to lean on at 1.1605. Trade from the boundaries of the range, not the middle. Wait for 1.1500 or 1.1625 to define a proper setup.
Weekend Context
The ECB has been cutting rates in 2026, which theoretically should weaken the euro. The fact that EUR/USD is holding above 1.16 despite ECB cuts tells you the story is all about dollar weakness, not euro strength specifically. That means the primary risk to the EUR/USD long thesis is not an ECB surprise but a sharp dollar recovery driven by US data or Fed hawkishness.
The US fiscal situation remains the key dollar driver. If the bond market becomes more agitated about US debt sustainability, the dollar could see a relief bounce which would weigh on EUR/USD. Friday’s slight DXY uptick to 99.32 might be the early edge of that. Watch 100 in DXY as the line in the sand.
EUR/USD liquidity is typically the highest of all FX pairs, meaning the spread impact of the holiday is smaller than in exotic pairs. That said, moving into a position ahead of Tuesday still carries the gap risk. A tighter position ahead of the holiday with the ability to add on Tuesday confirmation is the sensible approach.
Friday 22 May 2026
FX | Friday 22 May 2026
EUR/USD: Slight Pullback but the Dollar Ceiling Is Still There
Thursday close: 1.1617 | Daily change: -0.07% | Bias: Neutral with Upside Watch
Current Read
The euro slipped seven basis points on Thursday. That is not a pullback, that is a rest. EUR/USD has been trading in a tight band between roughly 1.1580 and 1.1680 for the better part of a fortnight, and neither party to this stalemate has found a reason to break the deadlock. On both sides of the equation, the policy story is effectively on pause.
The European Central Bank has signalled that additional rate cuts remain on the table through summer, but the pace has slowed. On the other side, US Federal Reserve commentary has remained cautious, with officials unwilling to commit to cuts until inflation data cooperates more convincingly. That shared ambiguity creates a low-volatility FX environment, which is exactly what we are seeing in this pair.
At 1.1617, the euro is holding ground well above the critical 1.1400 level that marked the line between a healthy correction and a shift in the broader trend. The macro backdrop, with European growth data surprising to the upside in recent weeks, has provided a floor that sellers cannot comfortably trade through.
Key Levels
What Changed Thursday
Thursday’s slight dollar bid came through across most major pairs, not just EUR/USD. That points to a broad dollar move rather than any specific euro weakness. The US PMI data released during the New York morning session came in marginally stronger than forecast, giving the dollar a small boost that faded through the afternoon but was enough to close the pair seven pips lower.
Eurozone-specific newsflow was quiet. There were no major ECB speakers scheduled, and the German industrial output figures from earlier in the week had already been digested. The euro is essentially a passenger on this pair at present, with the dollar in the driving seat.
Friday Scenarios
Bull Case
A recovery through 1.1650 during the London session, with DXY failing to hold above 99.50. If risk sentiment holds stable and there is no US data shock, the path of least resistance points toward retesting the 1.1680 zone. A break above 1.1700 would be the week’s most significant development and would signal a run toward 1.1750.
Base Case
More of the same. The pair drifts between 1.1590 and 1.1650 through a low-volume Friday session. No catalyst, no commitment, and traders square their books ahead of the weekend. This outcome changes nothing about the medium-term picture.
Bear Case
A clean break below 1.1580 targets 1.1540, and if that fails, 1.1500 comes into play. The trigger would need to be a meaningful dollar catalyst, whether that is hawkish Fed commentary, a strong US data print, or risk-off positioning driving dollar demand. Below 1.1500, the short-term bullish thesis is under genuine pressure.
Sizing and Approach
EUR/USD is the most liquid FX pair in the world, so Friday slippage risks are lower here than in many other instruments. That said, this pair has been in compression for two weeks. Breakout traps are common in this environment, where price pushes through a level, triggers stops, then reverses sharply. Be careful chasing moves above 1.1680 or below 1.1580 without confirming the move holds for at least one hourly close.
Standard sizing is appropriate here, but targeting range edges rather than breakouts is the lower-risk strategy for a Friday in a compressed market.
Cross-References
- DXY: As always, the primary driver. A sustained move above 99.50 in the dollar index puts 1.1580 support under real pressure.
- GBP/USD: Sterling moving in the same direction confirms it is a dollar story. Divergence between the two would indicate currency-specific factors at play.
- Gold: EUR/USD and gold tend to move together when dollar is the variable. Gold holding above $4,500 is supportive of the euro.
- USD/JPY: If USD/JPY starts reversing from the 159 zone, that would represent broad dollar weakness and would benefit EUR/USD.
Sunday 17 May 2026
—
title: “EURUSD Weekly Review : 16 May 2026”
date: “2026-05-16”
instrument: “EURUSD”
type: ticker-review
—
Weekend Ticker Review | 16 May 2026
EURUSD : The Cleanest Rate Differential Trade in G10
EURUSD | Spot FX | 12-16 May 2026
1. Week at a Glance
| Friday Close | 1.1631 |
| Friday Move | -0.73% |
| ECB-Fed Rate Gap | 185bps : ECB cutting, Fed holding |
| COT Positioning | -7,800 contracts WoW : pre-built institutional short |
| Entry Zone | 1.1680-1.1700 |
| Stop | 1.1730 |
| Target | 1.1550 (R:R ~2.6:1) |
| Signal | SHORT REDUCED : secondary dollar expression after GBP |
2. What Happened
EURUSD fell 0.73% on Friday. It ranks fourth-worst in G10 by magnitude on the day. The driver is simple: the ECB is cutting and the Fed is not. Every ECB rate cut widens the gap between European and US yields. Capital follows yield. It flowed toward dollar assets and away from EUR.
This is a mechanical trade. 185 basis points separates the ECB’s effective rate from the US 10-year. That gap does not close quickly. The Fed just had rate-cut expectations removed by strong retail sales data. The ECB is actively cutting. The direction of that gap is widening, not narrowing.
Institutions built the position before the catalyst. COT data for week ending 12 May shows -7,800 EUR contracts : both sides short EUR. That’s -7,800 contracts placed before Friday’s retail sales number. The move was pre-built. The data just confirmed the direction they already expected.
EURUSD is the cleaner, more mechanical expression of the dollar-strength thesis compared to GBP. GBP has six structural factors compounding simultaneously. EUR has the rate differential as its primary driver. Both are short opportunities. GBP is the higher-conviction setup. EUR is the cleaner mechanical one with better R:R on paper.
3. What the Alpha Insights Said
FX Focus : Post 11
EURUSD ranked fourth-worst G10 performer at -0.73%. Driver: ECB cutting versus Fed holding : mechanical rate differential trade. COT EUR -7,800 WoW : both sides short. No institutional floor in EUR on dips. Trade: short 1.1680-1.1700, stop 1.1730, target 1.1550, R:R approximately 2.6:1. Sized REDUCED : secondary after GBP. Invalidation: ECB hawkish surprise or DXY reversal below 98.80.
Macro Pulse : Post 01
Dollar bidding noted specifically: DXY 99.27 +0.39% crushing non-USD assets. EUR -0.73% cited alongside GBP -1.50% as direct consequence of dollar strength. The causal chain: hot retail sales removing rate cuts, 10-year rising, DXY bid, EUR falls. Every link in that chain is intact and the macro framework says it continues until either the Fed turns or the ECB stops cutting.
Global Grid : Post 06
EUR rated REDUCED in allocation guidance. DXY futures at modest premium to theoretical carry confirms speculative demand for forward dollar exposure beyond the rate differential alone. That speculative demand layer means EUR weakness has institutional conviction behind it, not just rate math on a spreadsheet. The DXY 98.80 threshold is the single invalidation point for the entire EUR short framework.
Basis Edge : Post 10
DXY futures at slight premium to theoretical carry : speculative demand for forward dollar beyond rate differential alone. COT confirmation: GBP -11,200 and EUR -7,800 WoW pre-built before Friday. Basis-level confirmation that the dollar bid is pre-positioned institutional flow, not reactive news-driven moves.
Signals : Post 15
EURUSD is in the DXY cluster alongside GBP and gold shorts. The correlation warning is explicit: all three reverse simultaneously on DXY break below 98.80. Combined portfolio exposure at REDUCED + STANDARD + REDUCED sizing is approximately 18%. Understand your cluster before sizing : this is not three independent trades.
4. Key Levels
| Level | Price | Significance |
|---|---|---|
| Short Entry Zone | 1.1680-1.1700 | Resistance : sell rallies here, don’t chase |
| Stop | 1.1730 | ECB surprise or DXY reversal : thesis broken |
| Target | 1.1550 | Rate differential structural basis : primary target |
| DXY Invalidation | 98.80 | Below this : close all EUR shorts immediately |
| Rate Gap Watch | 185bps | ECB cut narrows this : each cut widens EUR pressure |
| R:R | ~2.6:1 | At entry 1.1695 : best R:R in the FX set |
5. Signal + Bias
Signal: SHORT REDUCED. Secondary dollar expression after GBP. Cleanest mechanical setup in G10 on pure rate differential basis.
Entry: Wait for bounce to 1.1680-1.1700. Not a chase : a patience trade. EUR fell 0.73% Friday and needs a bounce to give you the entry.
Condition: DXY must remain above 98.80. If DXY reverses, close this alongside GBP and gold shorts. They are one cluster, not three separate positions.
Sizing: Reduced : secondary trade. VIX 18.43 regime applies the 30-40% reduction on top. Don’t overweight this relative to GBP.
Conviction ranking: Second after GBP in FX, but much lower than crude in the overall framework. Know where it sits in the hierarchy before sizing.
6. Next Week Setup
FOMC minutes Wednesday 14:00 ET is the primary event for the EUR. Hawkish-hold confirms the ECB-Fed gap stays wide, EUR stays under pressure. Dovish surprise narrows the gap : EUR rallies, close the trade. No new entries 12:00-13:45 ET Wednesday. Wait for the minutes.
Any ECB communication through the week matters. A pause signal from the ECB narrows the rate differential and removes the mechanical short thesis. That’s the primary threat to the trade. Watch for any Governing Council members signalling concern about overshooting to the downside.
Monitor EUR alongside GBP. If GBP reverses sharply before EUR does, that tells you the DXY bid is softening and the cluster trade is at risk. GBP leads EUR in signalling because it has more structural factors. If GBP bounces hard, revisit EUR short sizing immediately.
Consolidation is the base case (45% probability). In that scenario, entries at the 1.1680-1.1700 resistance with tight stops and patience are the approach. No new entries before FOMC minutes resolve the direction.
7. Risk Score
Around 55%
The ECB-Fed rate differential of 185bps is structural and widening. COT -7,800 contracts are pre-positioned institutional shorts. The R:R is the best in the FX set at approximately 2.6:1. The main risk is the DXY cluster correlation : all three short trades (GBP, EUR, gold) reverse simultaneously if DXY breaks 98.80. Size appropriately for that correlation, not as if EUR is an independent position.
Saturday 16 May 2026
—
title: “EURUSD Weekly Review : 16 May 2026”
date: “2026-05-16”
instrument: “EURUSD”
type: ticker-review
—
Weekend Ticker Review | 16 May 2026
EURUSD : The Cleanest Rate Differential Trade in G10
EURUSD | Spot FX | 12-16 May 2026
1. Week at a Glance
| Friday Close | 1.1631 |
| Friday Move | -0.73% |
| ECB-Fed Rate Gap | 185bps : ECB cutting, Fed holding |
| COT Positioning | -7,800 contracts WoW : pre-built institutional short |
| Entry Zone | 1.1680-1.1700 |
| Stop | 1.1730 |
| Target | 1.1550 (R:R ~2.6:1) |
| Signal | SHORT REDUCED : secondary dollar expression after GBP |
2. What Happened
EURUSD fell 0.73% on Friday. It ranks fourth-worst in G10 by magnitude on the day. The driver is simple: the ECB is cutting and the Fed is not. Every ECB rate cut widens the gap between European and US yields. Capital follows yield. It flowed toward dollar assets and away from EUR.
This is a mechanical trade. 185 basis points separates the ECB’s effective rate from the US 10-year. That gap does not close quickly. The Fed just had rate-cut expectations removed by strong retail sales data. The ECB is actively cutting. The direction of that gap is widening, not narrowing.
Institutions built the position before the catalyst. COT data for week ending 12 May shows -7,800 EUR contracts : both sides short EUR. That’s -7,800 contracts placed before Friday’s retail sales number. The move was pre-built. The data just confirmed the direction they already expected.
EURUSD is the cleaner, more mechanical expression of the dollar-strength thesis compared to GBP. GBP has six structural factors compounding simultaneously. EUR has the rate differential as its primary driver. Both are short opportunities. GBP is the higher-conviction setup. EUR is the cleaner mechanical one with better R:R on paper.
3. What the Alpha Insights Said
FX Focus : Post 11
EURUSD ranked fourth-worst G10 performer at -0.73%. Driver: ECB cutting versus Fed holding : mechanical rate differential trade. COT EUR -7,800 WoW : both sides short. No institutional floor in EUR on dips. Trade: short 1.1680-1.1700, stop 1.1730, target 1.1550, R:R approximately 2.6:1. Sized REDUCED : secondary after GBP. Invalidation: ECB hawkish surprise or DXY reversal below 98.80.
Macro Pulse : Post 01
Dollar bidding noted specifically: DXY 99.27 +0.39% crushing non-USD assets. EUR -0.73% cited alongside GBP -1.50% as direct consequence of dollar strength. The causal chain: hot retail sales removing rate cuts, 10-year rising, DXY bid, EUR falls. Every link in that chain is intact and the macro framework says it continues until either the Fed turns or the ECB stops cutting.
Global Grid : Post 06
EUR rated REDUCED in allocation guidance. DXY futures at modest premium to theoretical carry confirms speculative demand for forward dollar exposure beyond the rate differential alone. That speculative demand layer means EUR weakness has institutional conviction behind it, not just rate math on a spreadsheet. The DXY 98.80 threshold is the single invalidation point for the entire EUR short framework.
Basis Edge : Post 10
DXY futures at slight premium to theoretical carry : speculative demand for forward dollar beyond rate differential alone. COT confirmation: GBP -11,200 and EUR -7,800 WoW pre-built before Friday. Basis-level confirmation that the dollar bid is pre-positioned institutional flow, not reactive news-driven moves.
Signals : Post 15
EURUSD is in the DXY cluster alongside GBP and gold shorts. The correlation warning is explicit: all three reverse simultaneously on DXY break below 98.80. Combined portfolio exposure at REDUCED + STANDARD + REDUCED sizing is approximately 18%. Understand your cluster before sizing : this is not three independent trades.
4. Key Levels
| Level | Price | Significance |
|---|---|---|
| Short Entry Zone | 1.1680-1.1700 | Resistance : sell rallies here, don’t chase |
| Stop | 1.1730 | ECB surprise or DXY reversal : thesis broken |
| Target | 1.1550 | Rate differential structural basis : primary target |
| DXY Invalidation | 98.80 | Below this : close all EUR shorts immediately |
| Rate Gap Watch | 185bps | ECB cut narrows this : each cut widens EUR pressure |
| R:R | ~2.6:1 | At entry 1.1695 : best R:R in the FX set |
5. Signal + Bias
Signal: SHORT REDUCED. Secondary dollar expression after GBP. Cleanest mechanical setup in G10 on pure rate differential basis.
Entry: Wait for bounce to 1.1680-1.1700. Not a chase : a patience trade. EUR fell 0.73% Friday and needs a bounce to give you the entry.
Condition: DXY must remain above 98.80. If DXY reverses, close this alongside GBP and gold shorts. They are one cluster, not three separate positions.
Sizing: Reduced : secondary trade. VIX 18.43 regime applies the 30-40% reduction on top. Don’t overweight this relative to GBP.
Conviction ranking: Second after GBP in FX, but much lower than crude in the overall framework. Know where it sits in the hierarchy before sizing.
6. Next Week Setup
FOMC minutes Wednesday 14:00 ET is the primary event for the EUR. Hawkish-hold confirms the ECB-Fed gap stays wide, EUR stays under pressure. Dovish surprise narrows the gap : EUR rallies, close the trade. No new entries 12:00-13:45 ET Wednesday. Wait for the minutes.
Any ECB communication through the week matters. A pause signal from the ECB narrows the rate differential and removes the mechanical short thesis. That’s the primary threat to the trade. Watch for any Governing Council members signalling concern about overshooting to the downside.
Monitor EUR alongside GBP. If GBP reverses sharply before EUR does, that tells you the DXY bid is softening and the cluster trade is at risk. GBP leads EUR in signalling because it has more structural factors. If GBP bounces hard, revisit EUR short sizing immediately.
Consolidation is the base case (45% probability). In that scenario, entries at the 1.1680-1.1700 resistance with tight stops and patience are the approach. No new entries before FOMC minutes resolve the direction.
7. Risk Score
Around 55%
The ECB-Fed rate differential of 185bps is structural and widening. COT -7,800 contracts are pre-positioned institutional shorts. The R:R is the best in the FX set at approximately 2.6:1. The main risk is the DXY cluster correlation : all three short trades (GBP, EUR, gold) reverse simultaneously if DXY breaks 98.80. Size appropriately for that correlation, not as if EUR is an independent position.
Saturday 16 May 2026
EUR/USD (Fibre) — Daily Read | Friday 15 May 2026
Friday close | EUR/USD 1.1631 | Euro outperformed Cable on dollar squeeze | Not financial advice
WHAT CHANGED FROM YESTERDAY
Yesterday EUR/USD was under pressure from the dollar bid that followed the CPI print — the read noted the dollar was being bid despite lower inflation, an unusual setup. DXY had broken above the prior range ceiling of 98.5 to print 98.79. Today the picture diverges from Cable. EUR/USD closed at 1.1631 — notably higher than the Cable equivalent would imply. While DXY extended to 99.27, EUR/USD held and even recovered, suggesting euro-specific strength rather than pure dollar-move dynamics. This is the interesting development of Friday: EUR/USD moved differently to Cable against the same dollar backdrop.
HEADLINE STATE: HOLDING — EUR/USD 1.1631, Euro Relative Strength Against DXY Extension
EUR/USD at 1.1631 while DXY prints 99.27 is an apparent tension. The dollar is stronger — but EUR/USD is not weak. This means one of two things: either euro-specific flows (ECB expectations, eurozone data) are supporting EUR/USD against the dollar bid, or the dollar’s strength is concentrated in other crosses (JPY, AUD, GBP) rather than EUR. The EUR/USD divergence from Cable (-90 pips Friday) is the single most interesting signal in the FX complex on this session.
| Metric | Thu 14 May | Fri 15 May | Signal |
|---|---|---|---|
| EUR/USD | ~1.1280 (dollar bid) | 1.1631 | EUR recovered vs USD |
| DXY | 98.79 (above ceiling) | 99.27 (+0.39%) | Dollar up, EUR up = divergence |
| GBP/USD | 1.3445 (-0.68%) | 1.3355 | Cable weaker than EUR — EUR/GBP rising |
| Implied EUR/GBP | ~0.839 | ~0.871 | Euro outperforming sterling |
KEY LEVELS INTO NEXT WEEK
- 1.1631 — Friday close, the reference for Monday. EUR/USD holding above 1.16 into next week is euro strength.
- 1.1700 — next resistance. A move here confirms the euro’s relative strength narrative.
- 1.1500 — support. A break here would confirm DXY dominance over the euro.
- DXY 100 — if this level is reached, it tests whether EUR/USD can hold 1.15. Critical structural battle.
OVERWATCH CONTEXT
The Overwatch highlighted the dollar squaring paradox — dollar bid despite growth concerns. EUR/USD’s divergence from Cable on Friday suggests the dollar is not uniformly strong. The euro is holding its ground. This may reflect ECB rate expectations diverging from Fed expectations, or it may reflect position squaring in GBP after a significant move. Either way, EUR/USD at 1.1631 while DXY prints 99.27 is a data point worth tracking. If this divergence persists next week, EUR/USD outperforms in any dollar softening scenario.
WHAT TO WATCH NEXT WEEK
- EUR/USD vs DXY correlation — if EUR/USD holds 1.16 while DXY extends above 99.5, the divergence is confirmed structural.
- ECB commentary next week. Any hint of rate path divergence from the Fed amplifies EUR/USD moves.
- Eurozone data — if Europe’s numbers hold up while US growth disappoints, EUR/USD catches a bid.
- 1.1500 is the floor to defend. Lose it and the euro’s relative strength story breaks down.
Friday 15 May 2026 | Not financial advice. For informational purposes only.
Friday 15 May 2026
EUR/USD — Daily Read | Friday 15 May 2026
Post-CPI close | 1.1677 — rate differential story in play | Not financial advice
WHAT CHANGED FROM YESTERDAY
Yesterday EUR/USD was identified as holding constructively above 1.16 while the dollar short-covering was building post-CPI. The pair has settled at 1.1677 — fractionally off the day’s levels, holding above the 1.16 structural floor. What changed is that the CPI confirmation shifted the rate differential narrative meaningfully: if the Fed is now on a confirmed rate-cut path, the gap between Fed policy and ECB policy narrows over the coming months. That rate differential compression is structurally euro-positive. The Overwatch identified the dollar’s direction after position squaring completes as the key unresolved FX question into next week. EUR/USD at 1.1677 is sitting in exactly that transition zone.
HEADLINE STATE: HOLDING — Rate Differential Compressing, Dollar Squaring Not Complete
EUR/USD at 1.1677 is not a weak level — it is the euro holding ground while the dollar completes its post-CPI short squeeze mechanics. DXY at 98.89 represents short-covering, not new dollar longs being established. When the squaring finishes, the medium-term thesis takes over: a confirmed rate-cut path is dollar-negative, which is EUR/USD-positive. The Overwatch said this explicitly. The pair is not moving dramatically because it is caught between two forces: short-term dollar mechanics (upward pressure) and medium-term rate differential (downward pressure on the dollar). Retail Sales today determines which force has more weight in the immediate term.
Key Levels
| Level | Price | Significance |
|---|---|---|
| Thursday close | 1.1677 | Holding above 1.16 structural floor — rate differential intact |
| Structural floor | 1.1600 | Must hold for medium-term EUR/USD bull thesis |
| Strong RS (dollar extends) | 1.1620–1.1650 | Short-covering continues — tests the structural floor |
| Weak RS (dollar fades) | 1.1720–1.1760 | Squaring completes — medium-term thesis reasserts |
| Medium-term resistance | 1.1850–1.1900 | Rate differential target if rate-cut path fully expressed |
| DXY | 98.89 | Post-CPI short-covering mechanics — not new structural dollar strength |
Structure · Momentum · Flow
Structure
Above 1.16 = trend intact. The CPI week has not broken the EUR/USD bull thesis — it has temporarily pressured it. The structure requires 1.16 to hold as a weekly close level.
Momentum
Flat to slightly negative on the short term. The pair is consolidating rather than trending. This is appropriate — the two forces (dollar squaring vs rate differential) are in rough balance right now.
Flow
Dollar-dominated for now. The DAX tailwind (weaker dollar = stronger European equities in global capital flows) provides a cross-market floor for EUR. ECB speakers next week are the verbal tripwire for the rate differential thesis.
| Bias | NEUTRAL SHORT-TERM — BULLISH MEDIUM-TERM |
| Risk estimate | Around 35% — dollar mechanics vs rate differential in balance |
| Must hold | 1.1600 on a weekly close — lose it and the thesis breaks |
| Medium target | 1.1850–1.1900 when dollar squaring completes |
| Week carry | Unresolved — same watch as Cable. Dollar direction is the key. |
This content is for educational and informational purposes only and does not constitute financial advice. Past analysis does not guarantee future results. Always conduct your own research before making any trading decisions.
Thursday 14 May 2026
EUR/USD (Fibre) — Daily Read | Thursday 14 May 2026
Post-CPI mid-session | Dollar bid weighing on EUR | Not financial advice
WHAT CHANGED FROM YESTERDAY
Yesterday EUR/USD was LEANING LONG at 78% — but with sellers pressing and momentum not confirming cleanly. The analysis said “you need momentum to flip positive before committing to a full position.” Momentum did not flip positive. Sellers pressing became sellers winning. EUR/USD is now at 1.1677 (-0.50%). The 78% long bias was the structural view — the sellers pressing was the near-term reality. The near-term reality dominated, exactly as the caution suggested.
HEADLINE STATE: DOLLAR BID OVERRIDES LONG BIAS — Down 0.50%
The long structural bias for EUR/USD is still the bigger picture view. But CPI day brought a dollar bid that has temporarily overridden that bias. Down 0.50% with the DXY up 0.31% is the clean inverse relationship. The reason EUR is still down less than cable (0.50% vs 0.68%) is EUR has its own relative strength against GBP today. The 78% long read from the analysis has not been destroyed — it has been deferred to a better entry point. This is a buy-the-dip moment on the long thesis, not an exit from it.
Key Levels
| Level | Price | Significance |
|---|---|---|
| Current price | 1.1677 | -0.50% — dollar bid in control |
| Long-term bias | 78% long | Structural view intact — this is a dip within the trend |
| DXY | 98.79 (+0.31%) | Dollar index rising — direct EUR/USD headwind |
| vs cable comparison | EUR outperforming GBP | EUR/GBP cross supports relative EUR strength |
| Yesterday’s warning | Sellers pressing | Called correctly — sellers pressed and won near-term |
Structure · Momentum · Flow
Structure
Structurally still within the 78% long read. Today’s drop is the pullback that the analysis had been waiting for as a better entry. The structural picture has not changed — price is coming to a potentially better buying level.
Momentum
Short-term momentum is with the sellers. The analysis flagged “momentum mixed, not confirming the bias cleanly.” Mixed became bearish on the CPI dollar bid. Until momentum resets, the long thesis waits.
Flow
Dollar flow is dominating. DXY up means EUR/USD down — mechanical relationship on a macro event day. The flow should stabilise as the initial CPI reaction trades exhaust. Watch whether 1.165x holds as support.
TODAY’S BIAS: WAIT — Long Thesis Intact, Better Entry Building
The structural long read has not been invalidated. What has happened is CPI created a better entry opportunity than the levels available yesterday. The 78% long bias is still the macro view. The question is where EUR/USD finds a floor after the dollar bid. If 1.165-1.167 holds as support, that becomes the long entry zone with the macro thesis intact.
Risk: Around 45%
Going long now into an active dollar bid is fighting the current. The risk is highest if DXY continues higher through resistance — that would put additional pressure on 1.165. Wait for the dollar bid to exhaust before entering the long thesis.
By Experience Level
New to this
Yesterday’s analysis had a 78% long structural read but said sellers pressing and momentum mixed. That was the warning: the direction is long but the timing is not right. Today proved it. The lesson is that a strong directional bias does not mean you enter immediately — timing matters as much as direction.
Developing
EUR/USD outperforming GBP/USD today (down 0.50% vs 0.68%) is telling you the EUR/GBP cross is supporting EUR. That is a relative strength signal within a generally weak move. Pairs analysis — comparing related crosses — gives you information that single-pair analysis misses.
Experienced
The CPI dollar bid is a familiar pattern. The question is always whether it holds or fades. In 2025, most post-CPI dollar bids faded within one to two sessions. If that pattern repeats, EUR/USD at 1.165-1.167 is the entry for the long thesis with a tight stop below the CPI reaction low. That is the setup to watch Friday.
This is a daily analysis read for educational and informational purposes only. Nothing here is financial advice. Past performance is not a guide to future results. Trading carries significant risk of loss. Always apply your own risk management.
Wednesday 13 May 2026
EUR/USD (Fibre) — Daily Framework Read | Wednesday 13 May 2026
analysis as of pre-market | CPI 3.8% shock context | Not financial advice
HEADLINE STATE: LEANING LONG — Sellers Pressing, Momentum Mixed
EUR/USD carries a 78% long read — the same as Gold today. The framework leans upward but sellers are actively pressing the price. Momentum is not confirming the long bias cleanly. This is a market where the direction is broadly correct but the execution timing is difficult. The DXY short bias supports EUR/USD structurally, but you need momentum to flip positive before committing to a full position. CPI at 3.8% complicates the Fed’s path — that is medium-term EUR/USD positive.
Key Levels to Watch
| Reference | Note |
|---|---|
| Long bias | 78% — majority lean upward |
| Momentum | Mixed — not confirming the bias cleanly |
| Seller pressure | Active — sellers pressing against the long lean |
| DXY context | DXY range 97.5–98.5, bearish — EUR benefits |
| Framework state | Leaning long — wait for seller pressure to exhaust |
Structure · Momentum · Flow
Structure
Structure is supporting the long bias at 78%. The framework’s directional read comes from structural analysis — the majority of price behaviour is pointing up. Sellers pressing means they are testing this structure. Whether it holds determines the next move.
Momentum
Mixed. This is the problem. A 78% long read with mixed momentum means the direction is correct but the timing is uncertain. Momentum often precedes structure — if momentum is not confirming yet, the entry point may still be ahead. Wait for the momentum to align with the bias.
Flow
DXY in a 97.5–98.5 range with a bearish bias creates a tailwind for EUR/USD. Every point DXY loses, EUR/USD gains. But that tailwind is not yet strong enough to overcome the current seller pressure. Watch DXY for a breakdown — that becomes the EUR/USD trigger.
Long Case vs Short Case
LONG CASE
- 78% long read — structural majority is bullish
- DXY bearish bias — dollar weakness benefits EUR
- CPI 3.8% complicates Fed — dollar stays under pressure
- Seller exhaustion = long entry opportunity
- Medium-term: EUR/USD well-supported above current levels
SHORT CASE
- Sellers are actively pressing — they are not done yet
- Mixed momentum with active selling = potential further dip
- If structure breaks on selling volume, the long bias invalidates
- Counter-trend shorts risky given DXY setup
- Framework does not support short bias at 22%
Sizing Guidance
Reduced position size for initial entry. The setup is directionally sound but the timing conflict between momentum and bias means a full position carries unnecessary uncertainty. Build the long as seller pressure exhausts — do not buy into active selling. Scale in as momentum confirms.
Watch DXY for breakdown confirmation. EUR/USD long becomes a higher-quality setup once sellers step back and DXY accelerates its decline.
Tuesday 12 May 2026
Daily Framework Read · Tuesday 12 May 2026
Euro (EURUSD) — Daily Framework Read | Tuesday 12 May 2026
Published pre-market · Time-gated member content
Current State
WATCHING — Misaligned
Long bias: 78%. Structure is rising but momentum is mixed and sellers are active in the flow. The framework doesn’t agree with itself today.
Key Levels
| Level | Price | Notes |
|---|---|---|
| Structural Bias | Rising | Higher lows and highs in place |
| Momentum | Mixed | No clean directional read |
| Volume Flow | Selling active | Counter to structural direction |
| Entry Trigger | Wait for alignment | Structure + momentum + flow must agree |
Structure Read
EURUSD’s structural picture is tilted long — the sequence of higher highs and higher lows is intact and the broader trend is upward. Structure tells the story of where the market has been and where it’s likely heading over time, and on that basis the Euro has a legitimate bullish case. The question is whether today’s timing lines up for an entry, and right now the answer is no.
Momentum Read
Momentum is giving a mixed read — neither firmly bullish nor cleanly bearish. That ambiguity is the problem. Good setups have momentum that confirms the structural direction; what you have here is structure pointing up while momentum sits on the fence. Trading without momentum confirmation means you’re one layer short of the alignment that makes a trade worth taking.
Volume & Flow Read
Volume flow is actively selling into the current price range, which runs counter to the structural bullish lean. When sellers are pressing and momentum isn’t backing up the structure, the honest call is to wait. The flow divergence doesn’t guarantee a reversal, but it does mean the path of least resistance isn’t clearly higher right now.
The Verdict
The structural case for EURUSD long is real — the trend is up and the 78% long bias reflects that. But this is a watch, not a trade, because the layers don’t line up cleanly today. Momentum is ambiguous and sellers are active in the flow — that combination means the setup hasn’t matured. The framework requires alignment before committing capital. When structure, momentum, and flow all agree, you’ll have something worth acting on. Today is not that day.
Long Case vs Short Case
78%
Structure rising. Broad bullish trend intact. Longer-term momentum supports upside.
22%
Active selling flow + mixed momentum creates near-term headwind.
Position Sizing Guidance
No active position. The structural bias of 78% long means this belongs on the watchlist as a high-priority instrument to re-evaluate. When momentum turns and flow begins to support rather than resist the structural direction, revisit with standard risk. Until then, preserve capital and let the setup mature rather than forcing a trade on a partial read.
This content is for educational and informational purposes only. Nothing here constitutes financial advice or a recommendation to buy or sell any instrument. Trading involves substantial risk of loss. Past performance is not indicative of future results. Always conduct your own due diligence and manage risk appropriately.
Tuesday 5 May 2026
EUR/USD — Daily Framework Read | Tuesday 5 May 2026
EUR/USD (Fiber) | Daily Framework Read | Tuesday 5 May 2026
EUR/USD prints 1.1695 into the London close on Tuesday, down roughly twenty-eight pips on the session and giving back the early-week relief bid. The framework has shifted out of last week’s neutral and now reads structurally softer: trend tooling rolled lower on the daily, retracement polarity flipped, and price is pinned beneath the value-area top that has capped every push since mid-April. The dollar index sits flat at 98.48 but EUR has underperformed the broader greenback today — euro crosses tell the same story, with EUR/JPY giving back ground and EUR/GBP barely holding the 0.86 handle. Until the framework prints a fresh higher low, every bounce belongs to the seller.
Tuesday thesis on EUR/USD. The pair has slipped from a neutral read to a softer one. The bullish case from the week of 28 April relied on the dollar capping below 99 and the rate-differential narrative compressing back in EUR’s favour. Neither has happened cleanly. The framework now flags broken trend structure on the daily, a retracement-polarity flip, and value-area rejection at 1.1750. Until 1.1750 is reclaimed on a closing basis, the path of least resistance is a re-test of the 1.1580 structural floor. The Fed minutes on Wednesday and the ECB account on Thursday are the only catalysts that change this read before Friday.
Where It Sits Today
Close
1.1695
-0.27% / -32 pips
Day Range
1.1683 – 1.1731
48-pip range
Prev Close
1.1727
Monday print
Framework
SOFTER
trend rolled lower
5-Day Chg
-23 pips
DXY flat at 98.48
A 48-pip range is unusually compressed for a session that contained the European retail-sales print and a soft eurozone services PMI revision. That compression is meaningful. When data lands and the pair refuses to extend, the bid-side conviction is missing. EUR/USD has been offered into every push above 1.1720 for six sessions running. The seller is consistent. The buyer is reactive. Until that reverses, the daily candle prints the structure the framework already reads.
DXY closing flat at 98.48 while EUR/USD lost twenty-eight pips is a tell. It says the euro underperformed on its own merits today, not because the dollar bid. Cross-checks confirm: EUR/GBP barely holds 0.8640, EUR/JPY gave back to 183.79, and EUR/CHF sits offered at 0.9165. Continental momentum has cooled. The euro-specific weakness is the story, not the dollar.
What the Framework Reads
The daily read on EUR/USD has rotated from neutral to SOFTER — trend structure broken, value-area rejection. Three components moved against the bull case in the past two sessions and the read now reflects that.
The trend read flipped. Daily trend tooling rolled below its prior pivot for the first time since the 14 April low. The retracement polarity, which sat in long mode for the entirety of the Q1 rally, has now flipped to short — that is the second polarity shift of the year, and the prior one in mid-March preceded a 320-pip retracement. This is not a noise signal. It is a structural read change.
Value area top is the live ceiling. The framework places the value-area top at 1.1750. That level has rejected every push since 21 April. Today’s session high at 1.1731 stalled before reaching it, and the close back at 1.1695 confirms the structure: buyers cannot get sellers to step aside above 1.1720. Until a daily candle closes above 1.1750 with follow-through volume, the value-area read remains rotational, and rotation in a softer trend means lower lows.
What changed since yesterday. Monday’s read sat neutral with a slight bullish lean — the framework wanted a close above 1.1730 to confirm the recovery from the Powell-shock low. Today’s close at 1.1695 denies that confirmation. The trend tooling rolled, polarity flipped, and the daily candle printed a clean lower high. Every component moved against the bull. That is what triggers the read change.
What changes the read again. Two events in this week’s calendar can flip the read back to neutral or stronger. The Fed minutes at 19:00 BST on Wednesday will reveal whether the Powell hawkish-symmetric language was a committee view or a chair view — if the minutes show internal dissent toward easing, the dollar gives back ground and EUR/USD has room to retest 1.1750 from below. The ECB monetary-policy account at 12:30 BST on Thursday is the mirror image — if the account reads dovish, the rate differential widens against the euro and the framework’s softer read accelerates toward 1.1580. Outside those two prints, the read holds.
FX Focus cross-reference
Monday’s FX Focus brief flagged EUR/USD as the slowest mover in the G10 dollar complex and noted the cross divergence: GBP/USD was carrying the dollar story while EUR/USD lagged. Tuesday’s session has now caught EUR/USD up to that read — the pair lost ground on its own weight, not on a dollar surge. The cross with cable confirms it. GBP/USD lost 0.38% to 1.3530 today, more than EUR/USD’s 0.27% loss, but EUR/GBP still printed positive at 0.8640. Euro is the weaker leg of the pair when the dollar is quiet.
Key Levels
| Level | Price | Type | Meaning |
|---|---|---|---|
| Q1 rally ceiling | 1.1800 – 1.1850 | Bull invalidation upside | Mid-April high. Reclaim here ends the softer read entirely. |
| Value area top | 1.1750 | Rejection ceiling | The line that has capped every rally since 21 April. Daily close above flips the framework back to neutral. |
| Session high | 1.1731 | Today’s rejection | Rolled over before reaching 1.1750. The close beneath confirms the seller’s control of the ceiling. |
| Current price | 1.1695 | Range middle | Below the 1.17 handle and below the value-area mid. Gravity points to the floor, not the ceiling. |
| Immediate support | 1.1680 | Today’s low zone | First test on a fresh push lower. Loss here opens 1.1640 as the next stop. |
| Structural floor | 1.1580 | Key downside validator | Held the March dollar surge. Loss invalidates the entire 2026 EUR bull thesis and opens 1.1450. |
Yesterday Versus Today
| Component | Monday read | Tuesday read |
|---|---|---|
| Bias | Neutral, slight bullish lean | Softer, structural rejection |
| Trend tooling | Holding pivot | Rolled lower |
| Retracement polarity | Long mode | Flipped short |
| Value-area read | Rotational, neutral | Rejected at top |
| Cross signal | EUR/GBP holding 0.8633 | EUR/GBP up to 0.8641 (euro firm vs cable, soft vs dollar) |
The Call
The analysis reads short below 1.1750 with the structural floor at 1.1580 as the destination if conditions hold. The cleanest tactical short is a rally back into the 1.1720 to 1.1735 zone where the pair has been rejected six times in two weeks — that is the seller’s shelf, and the analysis reads it as the highest-probability re-entry. A daily close above 1.1750 invalidates the short and flips the read back to neutral. A clean break of 1.1680 with momentum opens 1.1640 first and 1.1580 next.
The asymmetry favours patience over chasing. Monday’s tight 30-pip range and Tuesday’s 48-pip range both compressed beneath the ceiling. When compression resolves it tends to resolve quickly — the analysis reads the pair as poised, not committed. Wait for the catalyst.
Risk read: around 60 percent
The framework gives this a moderate-to-elevated risk read. Three factors push it above the median: the Fed minutes on Wednesday can reset the dollar narrative in either direction without warning, the ECB account on Thursday is the symmetric event-risk on the other side of the same coin, and the value-area rejection has been so clean for so long that one strong rally above 1.1750 forces a wholesale repricing of the short setup. The mitigating factor is the structure itself — the trend roll and polarity flip happened together, which historically clusters with directional moves rather than noise.
The Bottom Line
EUR/USD has slipped from neutral to softer in a single session because the structural components moved together, not because the dollar surged. The 1.1750 value-area ceiling holds. The trend tooling has rolled. Retracement polarity has flipped. The cross checks confirm it is a euro story, not a dollar story. Until 1.1750 is reclaimed on a daily close, the path of least resistance points at 1.1680 first and the structural 1.1580 floor behind it. The Fed minutes on Wednesday and the ECB account on Thursday are the catalysts that can rewrite this read; outside those, the framework holds its softer call into Friday’s session.
Daily framework reads are educational analysis of major instruments based on a proprietary multi-component framework. They are not personalised advice or a recommendation to buy or sell any instrument. Trading FX involves risk of loss including losses greater than the deposit on leveraged positions. Past performance does not predict future results. Always size positions to your own risk tolerance and seek independent advice where appropriate.
Continue with Titan Protect
Twenty-plus instruments. One framework.
We read more than twenty instruments daily across four sessions. The framework’s sunrise call landed across the day — the Pre-NY case study shows what the lines drew, what New York did, and where the read stands.
Core
£59/mo
Indicator suite plus daily framework reads.
Edge Popular
£109/mo
Core plus Shield dashboard and member-only briefs.
Elite
£179/mo
Edge plus weekly 1:1 call and early access to new tools.
Save 15% on annual billing
Want to see the framework in action? Free Explorer tier — no card required.
Join the live community: Discord channel · Shield dashboard
Education, not financial advice. Trade your own analysis.
Sunday 3 May 2026
EUR/USD — Daily Framework Read | Sunday 3 May 2026
EUR/USD | Monday Open Framework Read | Data basis: Friday 1 May 2026 close
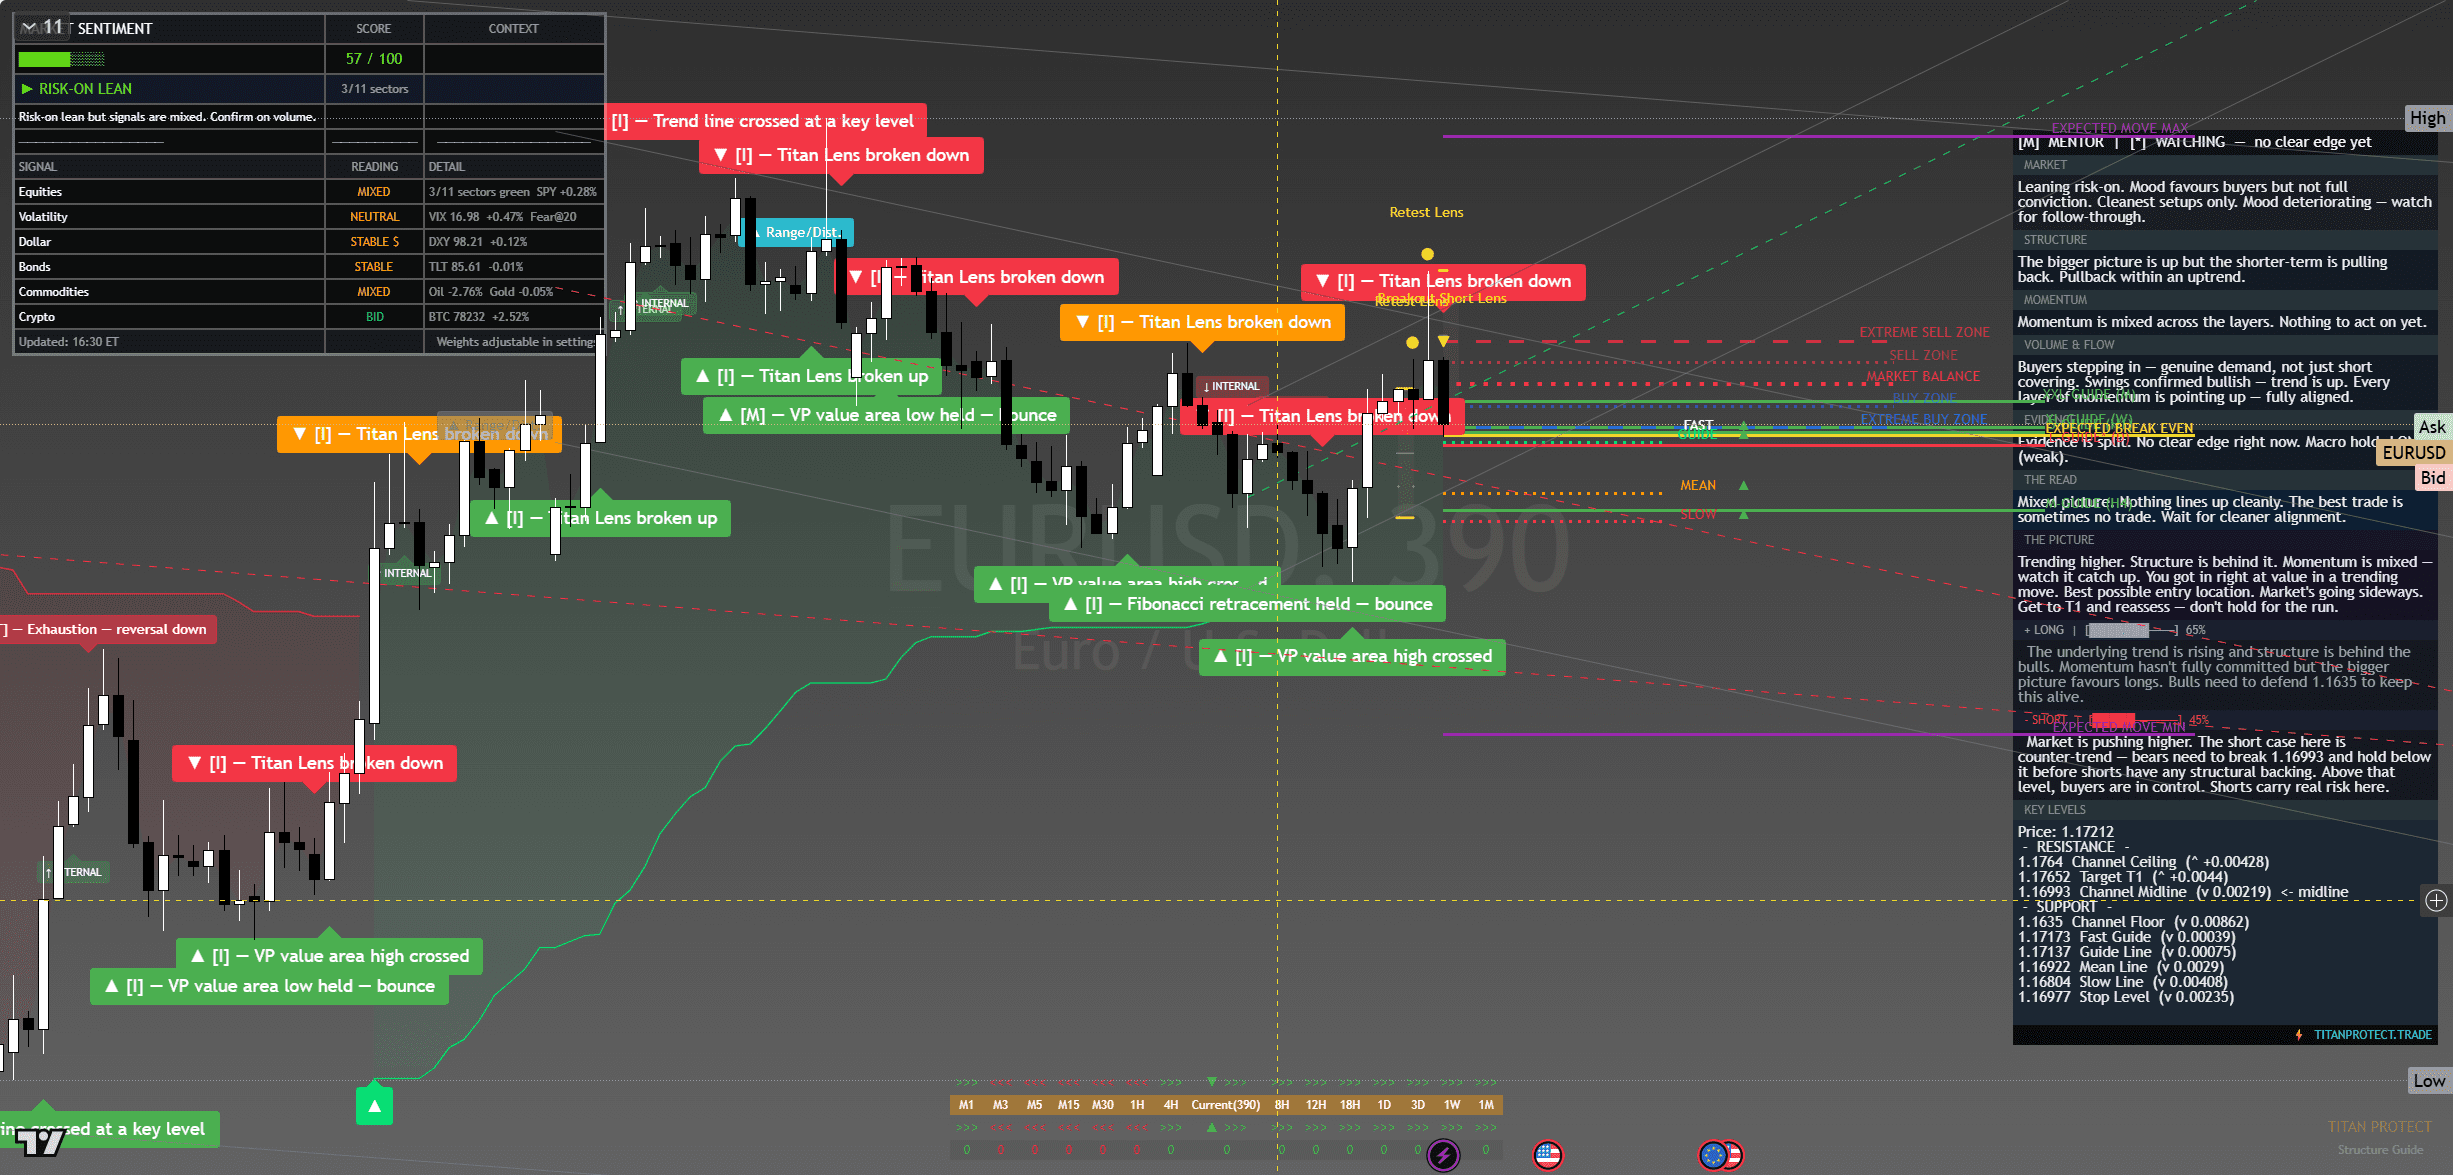
EUR/USD — chart with framework overlay. The Lens annotations show structural breaks, reversal triggers and confluence zones at the levels referenced below.
Where It Sits
Structure
Structurally EUR/USD remains in a clear uptrend on daily timeframes, with higher highs and higher lows since the early-April low. The 4-hour structure is contested following Friday’s pullback. Daily trend constructive, intraday timeframe in consolidation.
Momentum
Momentum has rolled over on intraday timeframes but the daily picture remains supportive. That divergence is consolidation behaviour, not reversal. The 1.1430 support level is the structural decision point.
Volume & Flow
FX flow signals show modest dollar buying into Friday’s close, more positioning than directional. The euro side has been neutral. The pullback reflects USD strength not EUR weakness — a distinction that matters for how Monday plays.
Key Levels
| Level | Type | Significance | Action Zone |
|---|---|---|---|
| 1.1560 | Resistance | Recent swing high, supply | Take profits / fade if rejected |
| 1.1520 | Pivot | Mid-range trigger | Hold above = bullish bias |
| 1.1480 | Friday close | Reference anchor | Bias line for Monday open |
| 1.1430 | Support | Recent breakout retest | Buy zone with defined stop |
| 1.1380 | Major support | Prior congestion floor | Stop-out below for longs |
Three Scenarios Into Monday Open
Continuation
Pair opens firm, holds 1.1480, takes 1.1520 in European session on softer USD. Runs to 1.1560 zone by NY. Bullish reversal of Friday’s pullback.
Range
Pair opens flat, churns 1.1450-1.1530 through the session. Range trade dominates. ECB and Fed in quiet windows ahead of next data prints.
Mean Reversion
Pair opens weak on USD strength, breaks 1.1430, runs to 1.1380. Continuation of Friday’s drift lower.
Risk Score
Risk sits at Around 45% heading into Monday open.
Risk is moderate. EUR/USD has held its broader uptrend but Friday’s pullback weakened the short-term picture. The pair sits at a decision point above the prior breakout level. Position-sized longs on support tests; no aggressive entries until structure rebuilds.
How to Walk It
Entry / Stop / Target structure:
- Long 1.1450-1.1470 pullback | Stop 1.1420 | Target 1.1525 | R:R 2.5:1
- Long 1.1525 breakout | Stop 1.1490 | Target 1.1560 | R:R 1:1
- Short 1.1570+ rejection | Stop 1.1600 | Target 1.1500 | R:R 2.3:1
Experience-level guidance:
Beginner: The Monday open after a Friday record close is exactly the situation where over-confidence costs money. Reduce size to half your standard. Trade only the cleanest setup from the entries above. If the tape opens against your bias, do nothing — wait for the second hour, when the institutional flow has tipped its hand.
Intermediate: Use the levels table to define the trading range. Fade the extremes with defined stops, take profits before the round-number resistance levels. Do not carry directional positions through the day if you cannot watch the tape — Monday opens are prone to fast reversals.
Advanced: The vol regime is supportive of trending moves. Defined-risk options structures around the key pivot levels capture the asymmetry cleanly. Keep notional small relative to your book — Monday after a record-close week is asymmetric speculation, not core positioning.
The Sunday Composite — How This Read Sits Inside The Cross-Asset View
This single-instrument framework read is one slice of the larger Sunday weekend synthesis. The composite takes positioning, macro, sentiment, volatility, sector dispersion and trade structure as separate analytical layers and arrives at a unified composite verdict for Monday open. Each layer below is unpacked in full.
Read the full composite for the cross-asset context driving this instrument:
The institutional positioning split — Asset Managers vs Leveraged Funds in size
PCE clearance and the macro case for Monday’s carry
The three-layer sentiment disagreement — surface greed, retail neutral, professionals hedged
The vol curve term structure and what VVIX is signalling
Sector dispersion and the breadth problem behind the record close
The Monday position-management playbook — sizing tiers and trade plans
Sunday Overwatch — the unified composite verdict
Continue Reading
The macro frame driving this read is unpacked in the weekend briefs:
Sunday Setup — Reading The Tape Into Monday Open
PCE Cleared, VIX Crushed, SPY Closed 720 — Friday Post-Close Recap
This analysis is for educational and informational purposes only. It does not constitute financial advice. Always manage your risk independently and in accordance with your own financial circumstances.


