VIX Spot Dynamics and Drivers
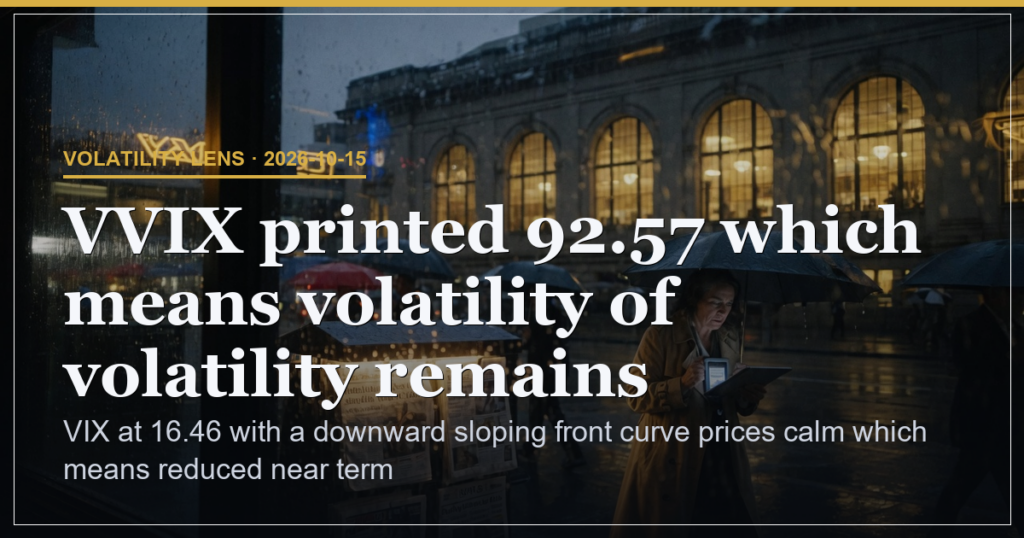
VIX fell 2.43 percent to 16.46 because the session low reached 16.34 which means near term fear eased from the 16.87 prior close. The move reversed the 10.48 percent jump recorded the previous session and therefore returned the index below its five day average of 16.36. Volume stayed at zero which leaves the percentage decline and the intraday low as the sole measurable signals. VVIX printed 92.57 which means volatility of volatility remains elevated even as VIX itself declined.
Front Curve Positioning
VIX9D at 13.97 versus spot at 16.46 because the front curve sits lower which means the market prices reduced volatility over the next nine days. The 2.49 point gap between VIX9D and spot VIX holds because front month expectations sit at a discount to the main index and therefore reduces the immediate chance of a sustained spike. This downward slope contrasts with the prior session configuration and therefore signals a quicker return to contained swings.
Support and Resistance Boundaries
VIX low at 16.34 acts as support and the 17.55 open marks resistance which means these bound today’s range. A sustained print above 17.55 would reopen the path toward the prior high of 18.01 because that level previously capped the rebound. Conversely a break below 16.34 would extend the decline toward the five day average of 16.36 because the index has already tested that zone intraday.
| Metric | Value | Meaning |
|---|---|---|
| VIX change | -2.43 percent | Eased fear after yesterday’s 10.48 percent spike |
| VIX9D to spot gap | 2.49 points | Prices lower volatility nine days ahead |
Scenario Triggers and Weights
40 percent chance the curve stays downward sloping if VIX holds below 17.00 because front month discounts would persist. 35 percent chance VIX retests 17.55 if macro data surprises because that level marked today’s open and prior resistance. 25 percent chance VVIX climbs above 95 if equity swings widen because volatility of volatility already sits at 92.57 and remains sensitive to further repricing.
Risk Assessment
Risk sits at 25 percent because VVIX remains elevated at 92.57 which keeps the potential for rapid VIX repricing alive despite the spot decline.
| Experience Level | What to Watch on Tape |
|---|---|
| Beginner | How the VIX9D discount to spot narrows or widens on each print |
| Intermediate | Whether the 16.34 low holds as support or gives way on follow through volume |
| Advanced | Whether VVIX at 92.57 begins to compress in tandem with spot VIX or diverges further |
VIX at 16.46 with a downward sloping front curve prices calm which means reduced near term swings.
This is analysis, not financial advice. Always manage your risk.