Silver (XAG/USD) – Daily Read
6 October 2026 | Commodity | Titan Macro Desk
$60.83
Silver is under near-term pressure, but the broader advance is not yet broken. Last price is $60.83, 1.9 percent lower on the day, leaving it down near the floor of its one-month range. The clear view is that this remains a corrective phase inside a longer upward structure, provided nearby support holds. That distinction matters because the market is approaching the point where bargain buyers must reappear or a routine pullback can develop into a deeper liquidation.
The macro backdrop is pulling silver in opposite directions. Its monetary side remains sensitive to the dollar, real-rate expectations, and demand for precious-metal protection, while its industrial side depends on confidence in manufacturing, electrification, and the wider growth cycle. That combination can amplify moves when macro conviction is weak. The one month average is $64.34; price is below it, and the structure reads as a pullback, slipping under the one-month average while the longer trend still points up. Momentum roughly 7.4 percent down over the last two weeks confirms that sellers currently control the short horizon, even though it does not by itself overturn the larger trend.
The first recovery test is $62.00. Reclaiming that nearer round number handle would show that buyers can absorb supply above the latest decline and would begin repairing short-term confidence. The $60.00 handle is more important immediately because it concentrates psychological demand just above the shelf of support at $59.99, about 1.4 percent below. That shelf is the practical dividing line between consolidation and structural deterioration. Holding it would preserve the case for accumulation near the range floor. Losing it would suggest that buyers defending the pullback have stepped aside.
Above, the month swing high is $68.98, about 13.4 percent above the current price. That level represents the supply ceiling that stopped the prior advance, so merely approaching it would not be enough. A decisive move above $68.98 opens the path toward $71.78, because the market would have cleared the most relevant recent barrier. The broader three month range is $56.13 to $71.78, framing both the downside consequence of failure and the upside objective of renewed trend strength.
The bull path is straightforward: if $59.99 holds, then a recovery through $60.00 and $62.00 would indicate that forced selling is fading. If price subsequently regains $64.34, then the pullback would look increasingly complete, with $68.98 becoming the next meaningful test. If that ceiling breaks decisively, then $71.78 comes into play.
The bear path begins if $59.99 fails. If sellers can keep price below that shelf, then losing $59.99 exposes $56.13, with the break signaling that weakness is spreading beyond a shallow correction. The bullish read is invalidated by sustained acceptance beneath support, while the bearish read is invalidated by a firm recovery through $64.34 followed by strength above $68.98. Net, silver remains longer-term constructive but tactically fragile, and the response around $60.00 and $59.99 should decide whether this is accumulation or the start of a deeper reset.
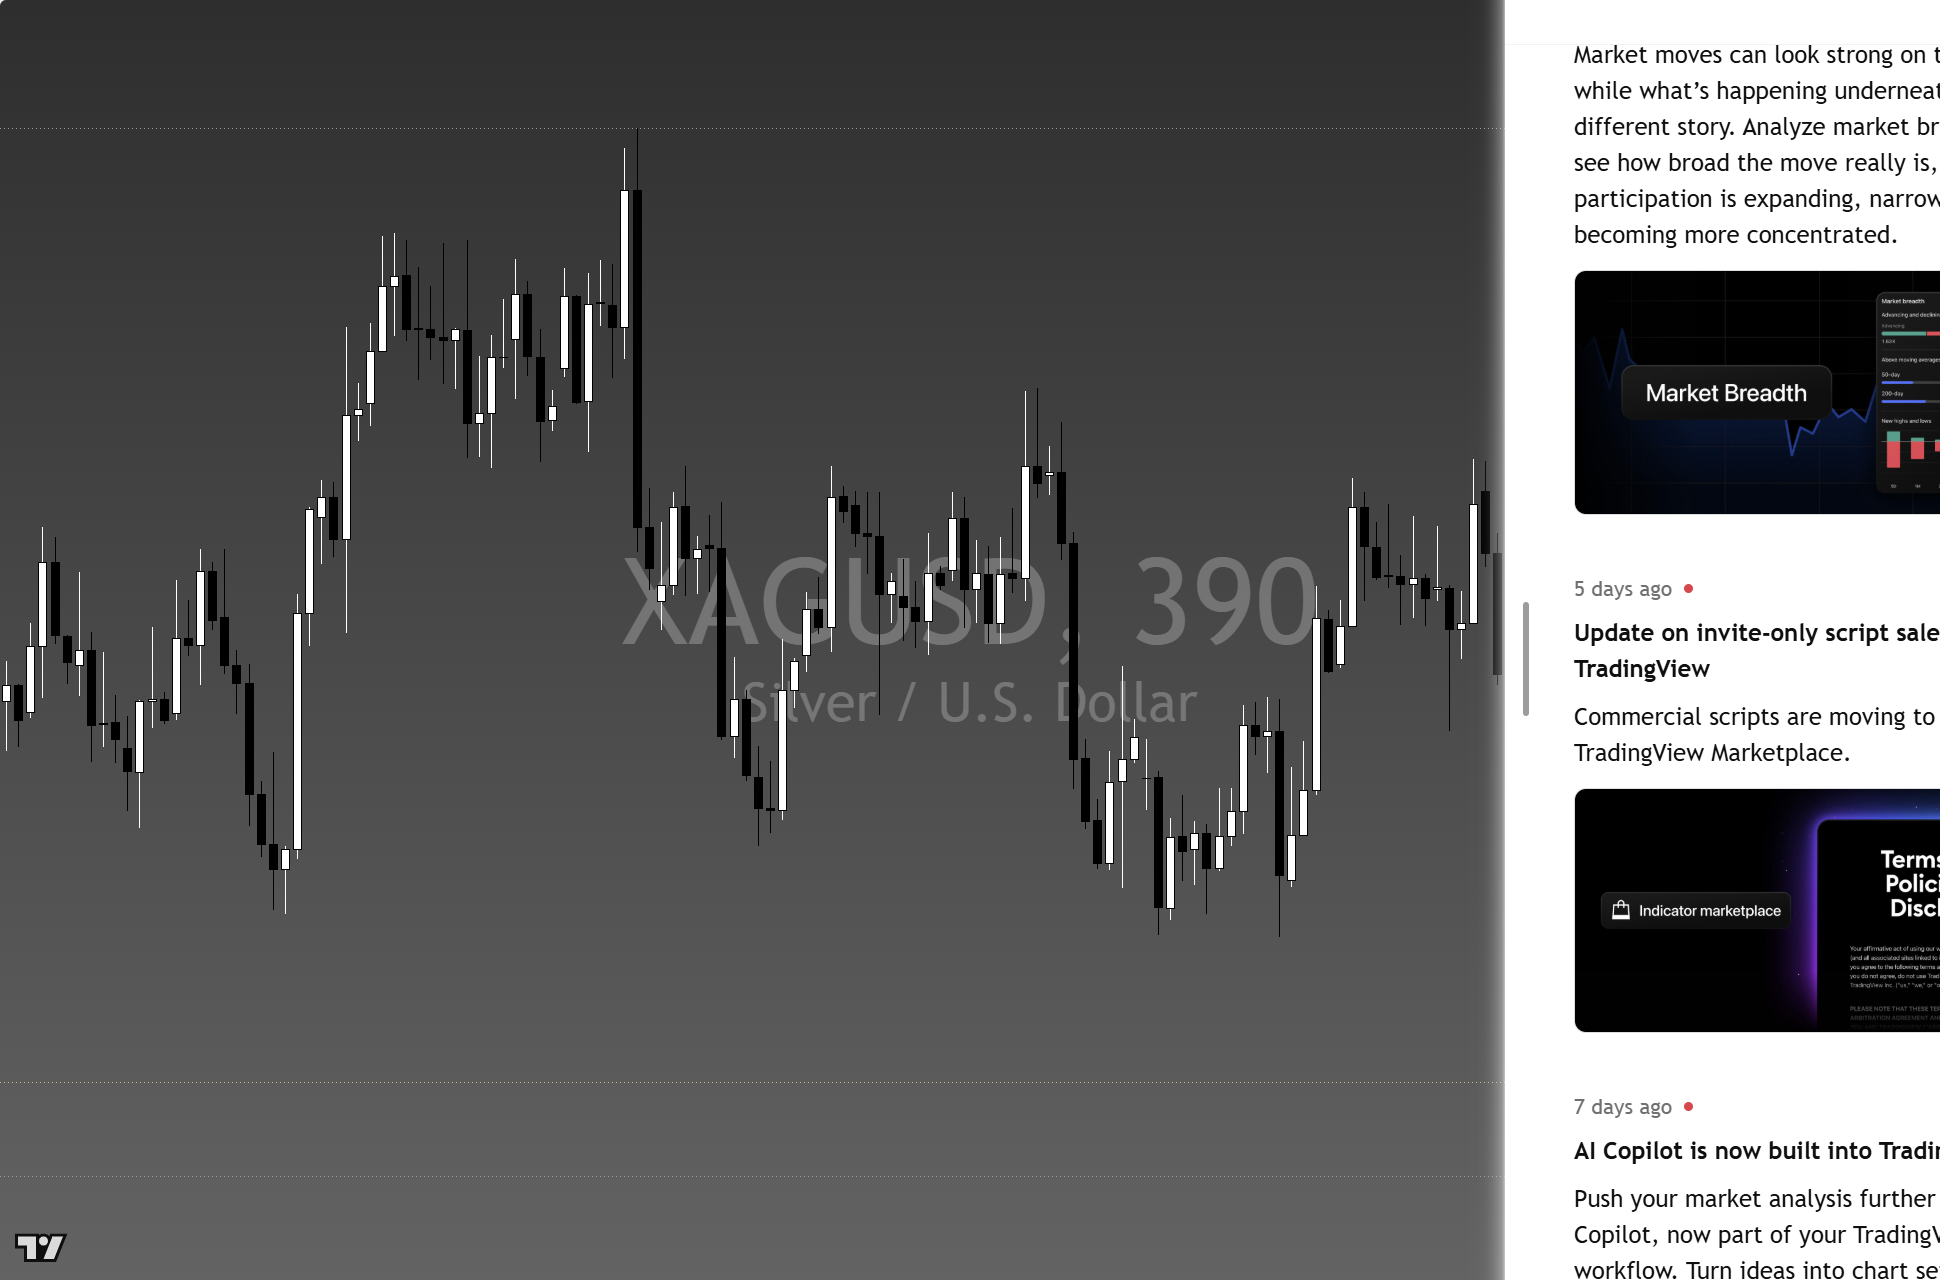
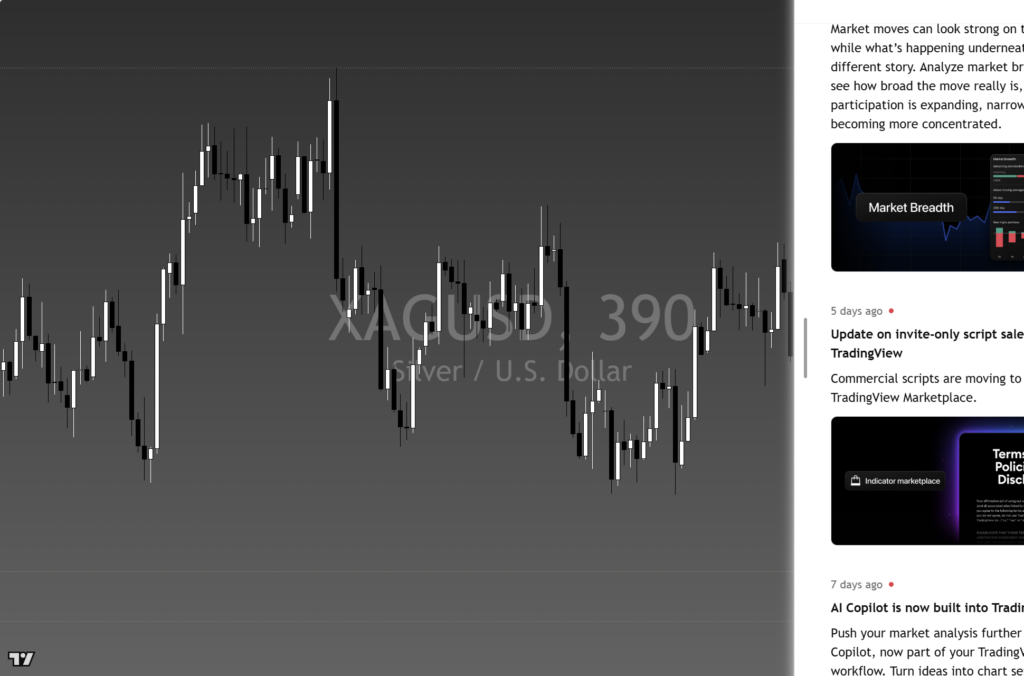
The chart above is the full daily read: structure, momentum, the levels that matter, and where the current price sits against them. Read it top to bottom for the complete picture, and pair it with our session briefs for the wider market context.
This is analysis, not financial advice. It reflects our multi-factor framework and is not a recommendation to buy or sell. Always do your own research and manage your risk.