Russell 2000 (RTY) – Daily Read
20 September 2026 | Index | Titan Macro Desk
2,860.4
Russell 2000 (RTY) is pinned at 2,860, 0.0 percent higher on the day, but the unchanged headline masks a weak underlying position. It is down near the floor of its one-month range, with sellers still controlling the broader structure. The clear view is cautiously bearish while price remains below the key recovery levels. This matters because small caps are more sensitive than larger companies to financing conditions, domestic demand, and shifts in risk appetite, so weakness here can signal that investors remain reluctant to embrace economically exposed assets.
The macro backdrop is therefore central. Uncertainty around rates, funding costs, and the durability of domestic growth tends to weigh disproportionately on smaller companies, whose balance sheets and margins often have less room for error. At the same time, any easing in financial pressure or improvement in growth expectations could produce a forceful rebound because positioning is already defensive. The one month average is 2,923; price is below it, and the structure reads as a downtrend, price under both its one-month and longer averages. The tape is roughly 2.1 percent down over the last two weeks, confirming that recent pressure is persistent rather than confined to one session.
The nearer round number handles at 2,900 and 2,850 frame the immediate contest. Holding 2,850 keeps the market just above the lower boundary and gives buyers a base from which to challenge 2,900. Reclaiming 2,900 would be the first evidence that demand is absorbing supply, but 2,923 remains the more meaningful repair point because recovery above that reference would weaken the current bearish structure. Below, a shelf of support at 2,832, about 1.0 percent below, is the critical defense. It is also the bottom of the three month range 2,832 to 3,070, so failure there would represent both a local breakdown and an escape from the broader range. The month swing high is 3,019, about 5.6 percent above the current price. That level marks the point where a rebound becomes a genuine trend challenge rather than another rally into supply.
The bull path is straightforward: if 2,850 holds, then a recovery through 2,900 can target 2,923; if buyers establish acceptance above that area, then pressure can build toward 3,019. A decisive move above 3,019 opens the path toward 3,070, with the range ceiling becoming the next test of demand. The bear path begins if rebounds fail beneath 2,900 and sellers press the lower shelf. Losing 2,832 exposes 2,800, because the established range floor would no longer be containing liquidation.
The main risk to the bearish view is a rapid improvement in the macro tone that draws capital back into domestic cyclicality and produces sustained recovery above 2,923. Conversely, repeated failure at 2,900 would reinforce the case for another support test. The read is invalidated as bearish on a decisive break above 3,019. Until then, the net take is defensive: support is close enough for a rebound, but buyers still need to prove control.
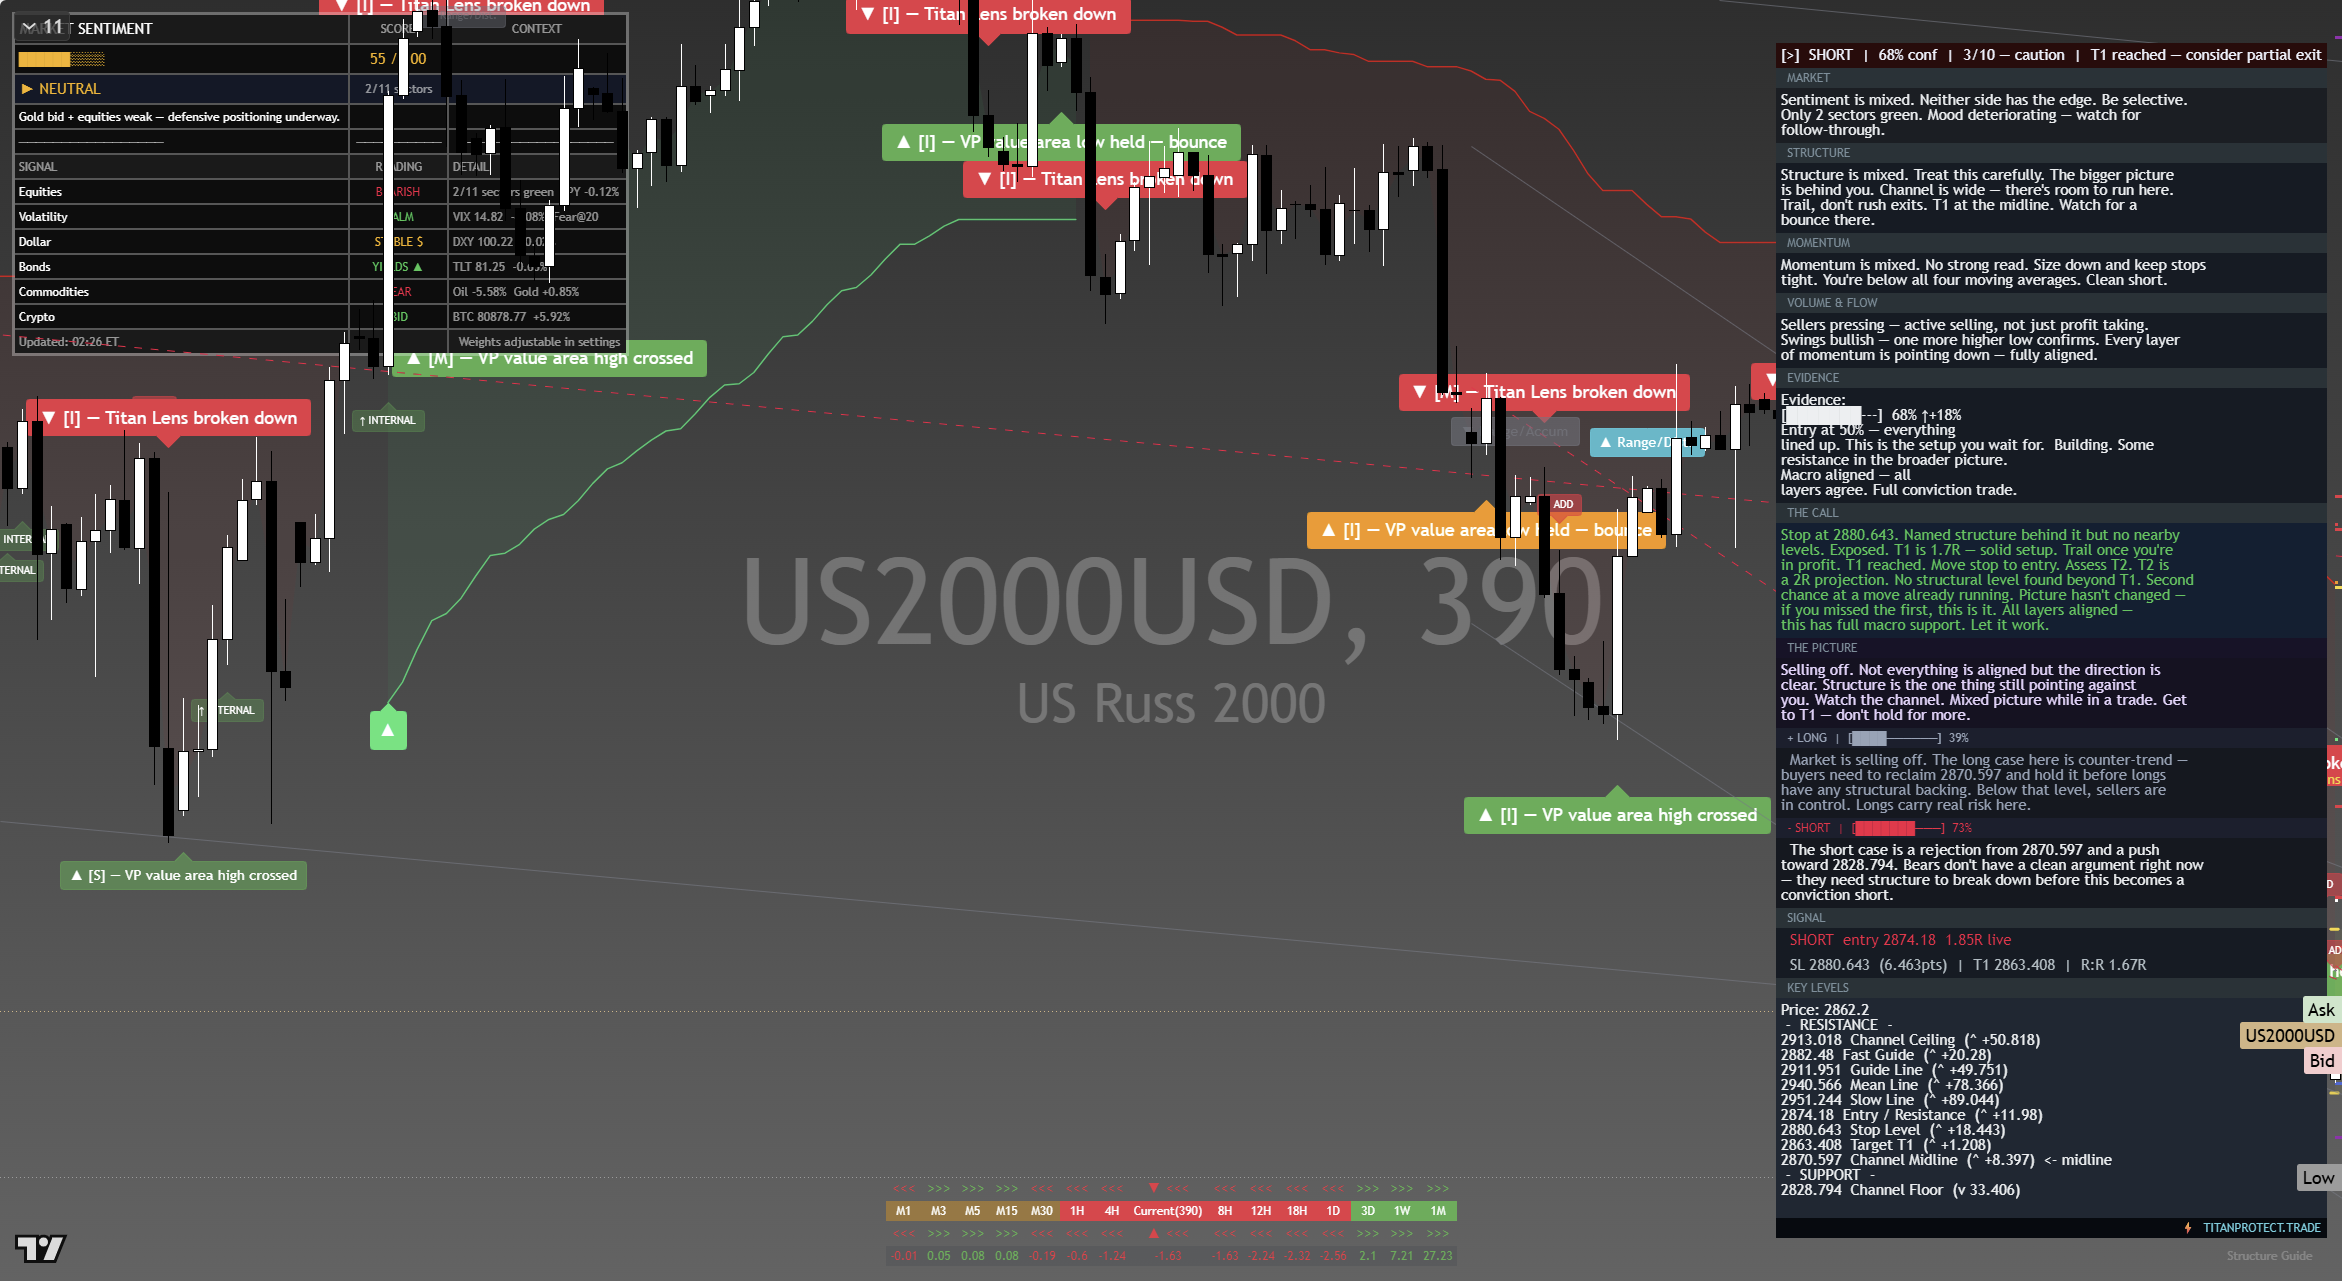
The chart above is the full daily read: structure, momentum, the levels that matter, and where the current price sits against them. Read it top to bottom for the complete picture, and pair it with our session briefs for the wider market context.
This is analysis, not financial advice. It reflects our multi-factor framework and is not a recommendation to buy or sell. Always do your own research and manage your risk.