Position Sizing Calculator: The Math That Protects Your Account
🛡️ SL/TP Intelligence Series — Article 10 of 10 | Video: 13 min
📋 What You’ll Learn:
- 🎯 Why position sizing is the most important math in trading
- 💡 The simple formula pros use
- ⚠️ Common sizing mistakes that blow up accounts
- 📊 Position size calculator with examples
- 🔢 Ready-to-use calculator tool
🎥 Video coming soon — Subscribe to @Titan_Protect for the full breakdown with live charts.
️ The Math That Keeps You Alive
Here’s the uncomfortable truth: You can have the best strategy in the world and still go broke with bad position sizing.
Position sizing is how much you buy. It seems simple, but it’s the difference between surviving bad streaks and blowing up your account.
Get this right, and you can lose half your trades and still make money. Get this wrong, and even a winning strategy will bankrupt you.
The Position Size Formula
Professional traders use one simple formula:
Position Size = Account Risk Amount ÷ Trade Risk Amount
Let’s break it down:
Account Risk Amount
This is how much of your total account you’re willing to lose on one trade. Typically 1-2%.
> Example: $10,000 account, 2% risk
> $10,000 × 0.02 = $200 maximum loss per trade
Trade Risk Amount
This is the distance from your entry to your stop loss.
> Example: Entry at $100, stop at $95
> $100 − $95 = $5 risk per share
Calculate Position Size
> $200 (account risk) ÷ $5 (trade risk) = 40 shares
If the trade hits your stop, you lose exactly $200 (2% of your account). No more, no less.
Real Examples
Example 1: Stock Trade
| Account Size | $25,000 |
| Risk per Trade | 1% ($250) |
| Entry Price | $150 |
| Stop Price | $145 |
| Trade Risk | $5 per share |
| Position Size | $250 ÷ $5 = 50 shares |
| Total Investment | 50 × $150 = $7,500 |
| Maximum Loss | 50 × $5 = $250 (1%) |
Example 2: NAS100 (Index) Trade
| Account Size | $10,000 |
| Risk per Trade | 2% ($200) |
| Entry Price | 19,850 |
| Stop Price | 19,700 |
| Trade Risk | 150 points |
| Position Size | $200 ÷ 150 = 1.33 contracts |
| Maximum Loss | $200 (2%) |
Can’t trade fractional contracts? Round down to 1 contract. Never round up.
Example 3: Tight Stop (High Risk/Reward)
| Account Size | $5,000 |
| Risk per Trade | 1% ($50) |
| Entry Price | $50 |
| Stop Price | $49 (tight stop) |
| Trade Risk | $1 per share |
| Position Size | $50 ÷ $1 = 50 shares |
Tight stop = larger position for same risk. But be careful — tight stops get hit by normal market noise.
️ Common Position Sizing Mistakes
Mistake #1: Fixed Share Amount
“I always buy 100 shares.”
Problem: 100 shares of a $10 stock ($1,000) is very different from 100 shares of a $500 stock ($50,000). And neither considers your stop distance.
💡 Fix: Size based on risk, not round numbers.
Mistake #2: Dollar Amount Investing
“I’ll put $5,000 into this trade.”
Problem: $5,000 with a 1% stop = $50 risk. $5,000 with a 20% stop = $1,000 risk. Same investment, wildly different outcomes.
💡 Fix: Risk amount comes first. Position size comes second.
Mistake #3: Varying Risk Based on “Conviction”
“I’m really sure about this one, so I’ll risk 5%.”
Problem: Your “conviction” doesn’t change the market’s behavior. A 5% loss requires a 5% win just to break even. String a few losses together and your account is devastated.
💡 Fix: Same risk percentage on every trade. No exceptions.
Mistake #4: Ignoring Correlation
You risk 2% on 5 different tech stocks. Tech sells off. You lose 10% in one day.
Problem: Correlated positions = concentrated risk.
💡 Fix: If positions move together, reduce size on each.
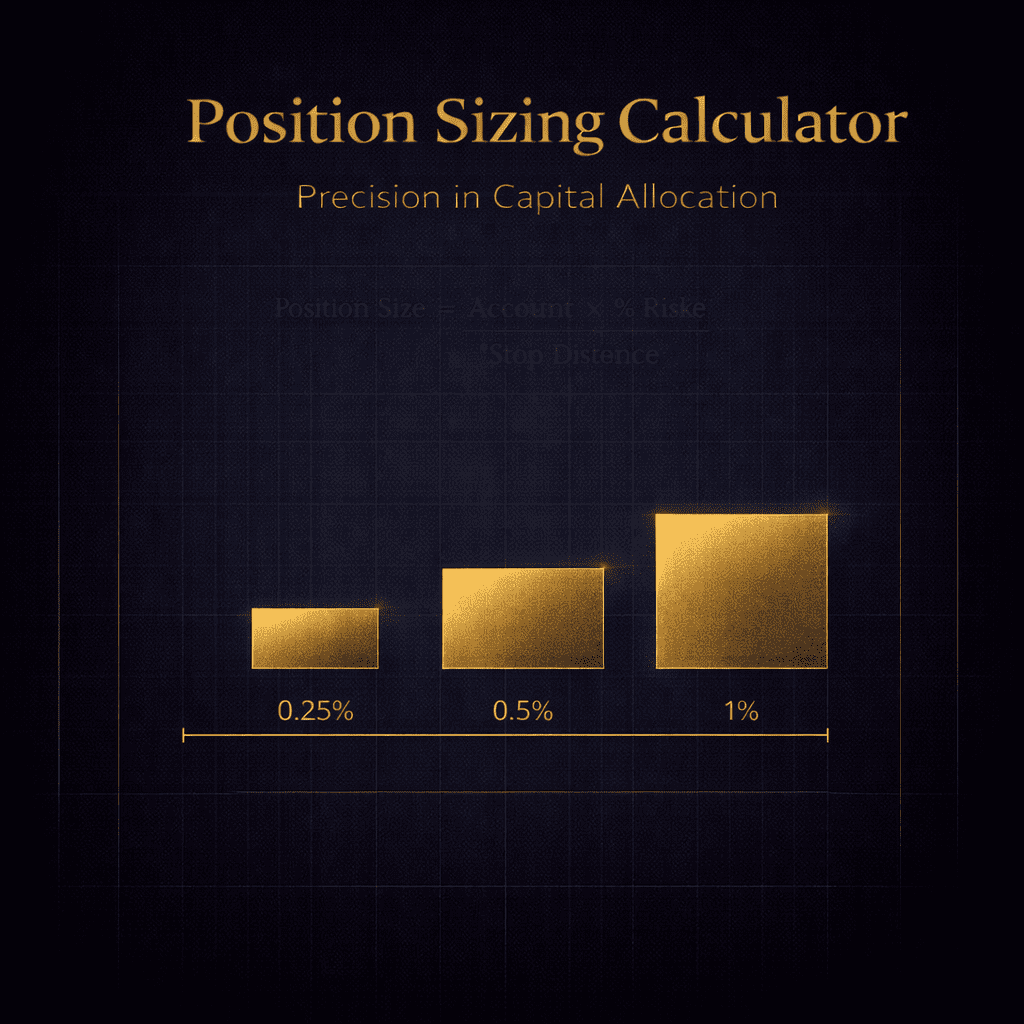
Position Size Quick Reference
| Account Size | 1% Risk | 2% Risk |
|---|---|---|
| $5,000 | $50 | $100 |
| $10,000 | $100 | $200 |
| $25,000 | $250 | $500 |
| $50,000 | $500 | $1,000 |
| $100,000 | $1,000 | $2,000 |
As your account grows, your dollar risk grows — but your percentage risk stays the same.
The Professional Approach
Pros follow these rules:
- Same risk % on every trade — usually 1-2%
- Calculate before entering — never after
- Account for correlation — reduce size on related positions
- Adjust for volatility — smaller size in wild markets
- Never risk more because you’re “sure” — the market doesn’t care about your confidence
Position Size Calculator
Use this before every trade:
Step 1: Account Size × Risk % = Account Risk
Step 2: Entry Price − Stop Price = Trade Risk
Step 3: Account Risk ÷ Trade Risk = Position Size
Your Action Plan
- Pick your risk % — 1% for beginners, 2% max for experienced traders
- Calculate position size — before every trade, no exceptions
- Never deviate — same risk % on every trade
- Track your exposure — watch correlations across positions
- Review weekly — did you follow your sizing rules?
Congratulations — You’ve Completed the SL/TP Intelligence Series!
You now understand:
- Why stops matter more than entries
- Risk-to-reward ratios
- Volatility-based sizing
- Dynamic vs. static stops
- Profit target strategies
- Psychology of holding winners
- Advanced exit techniques
- Pre-trade checklists
- Post-trade analysis
- Position sizing math
Master these concepts, and you’ve built a foundation most traders never achieve. Now go practice. Theory without execution is just entertainment.
A Final Thought:
Position sizing is boring. It doesn’t feel like trading. But it’s the difference between surviving long enough to become profitable and blowing up before you get there. Respect the math. Protect your capital. Trade another day.
This week: Use the position size calculator on every trade. Write down your calculations. After 10 trades, review — did you follow the math? Did it protect you?
— Titan
Get the daily framework intelligence
Trade the framework, not the noise.
The principles in this article are how we read markets every day. Members get the live application: daily Pre-Asia, Pre-London, Pre-NY and Post-Close briefs across 20+ instruments, the indicator suite, the Foundry library, and live community.
Free Explorer tier · No card required · Upgrade when you’re ready