US Equity Session Close
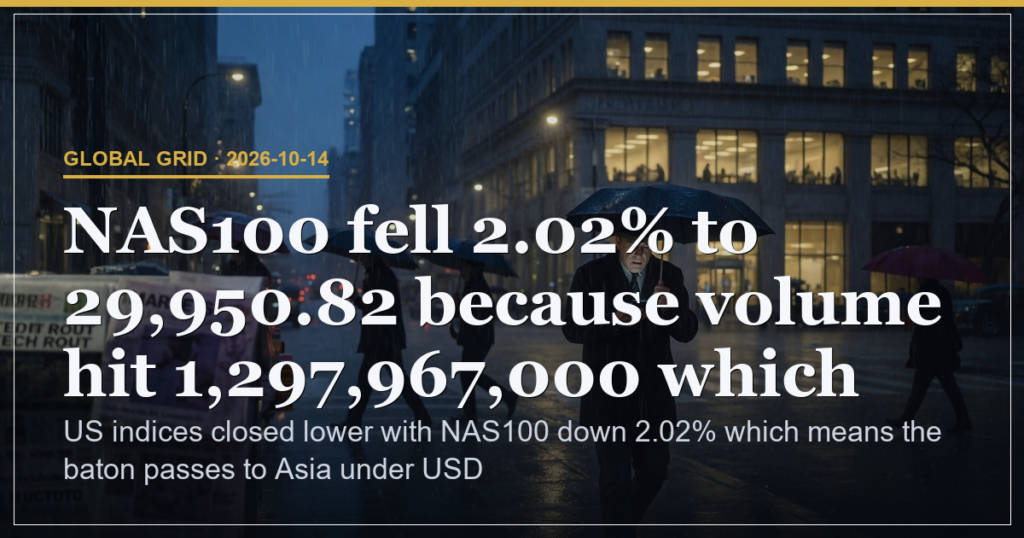
SP500 fell 1.11% to 7,718.94 because it opened at 7,774.18 and hit a low of 7,693.31 which means sellers controlled the full session range. Nasdaq dropped 2.02% to 29,950.82 because volume reached 1,297,967,000 and price closed below the 30,316.03 open which means tech led the downside momentum. SPY closed at 769.60 down 1.08% on 54,511,707 shares which means broad market participation aligned with the index losses. Dow finished at 51,621.48 down 0.09% because volume hit 442,523,838 which means large-cap names offered limited support.
Index Performance Breakdown
QQQ fell 1.97% to 728.95 because volume reached 49,885,770 and the close sat below the 738.00 open which means momentum stayed negative through the close. IWM declined 1.93% to 271.37 on 37,130,334 shares which means small caps matched the tech-led weakness. NDX and Nasdaq printed identical closes at 29,950.82 down 2.02% because heavy volume of 1,297,967,000 confirmed the heaviest downside pressure hit tech indices.
| Index | Close / Change | Driver |
|---|---|---|
| SP500 | 7,718.94 / -1.11% | Low of 7,693.31 shows seller control |
| Nasdaq | 29,950.82 / -2.02% | Volume of 1,297,967,000 confirms tech pressure |
| QQQ | 728.95 / -1.97% | Close below open on 49,885,770 shares |
Currency and USD Impact
DXY rose 0.35% to 102.54 because it traded up from the 102.21 open which means USD strength added direct pressure on equities. EURUSD fell 0.01% to 1.1159 while GBPUSD dropped 0.15% to 1.3190 which means European currencies weakened and reinforced the dollar bid. USDJPY eased 0.12% to 158.33 which means yen strength failed to offset broader dollar gains.
Volume and Momentum Drivers
Futures data is empty which means overnight handoff signals remain unavailable. SP500 volume of 3,388,032,000 shares exceeded the prior session which means downside participation increased. QQQ volume of 49,885,770 shares paired with a close below open which means momentum stayed negative into the next session.
Key Levels and Next Session Outlook
SP500 holds support at 7,693.31 and resistance at 7,789.15 which means a break below support extends losses while a reclaim of resistance would ease pressure. Nasdaq support sits at 29,861.06 with resistance at 30,436.60 which means tech direction hinges on those prints. SPY support at 766.71 and resistance at 776.30 which means the ETF tracks the same range as the cash index.
| Experience Level | What to Watch on Tape |
|---|---|
| Beginner | Track whether Nasdaq holds 29,861.06 or breaks lower on volume |
| Intermediate | Monitor DXY moves above 102.54 and any equity response |
| Advanced | Observe SP500 volume profile around 7,693.31 for follow-through |
Three scenarios carry the following odds: 45% chance of further downside if Asia opens below 29,861.06 on Nasdaq which means USD strength extends; 30% chance of stabilisation if DXY pulls back below 102.21 which means equities find a base; 25% chance of rebound if SP500 reclaims 7,789.15 on lower volume which means sellers step aside. Risk sits at 55% because DXY strength at 102.54 continues to weigh on risk assets.
US indices closed lower with Nasdaq down 2.02% which means the baton passes to Asia under USD strength.
This is analysis, not financial advice. Always manage your risk.