Nasdaq 100 (NAS100) – Daily Read
21 September 2026 | Index | Titan Macro Desk
29,644.2
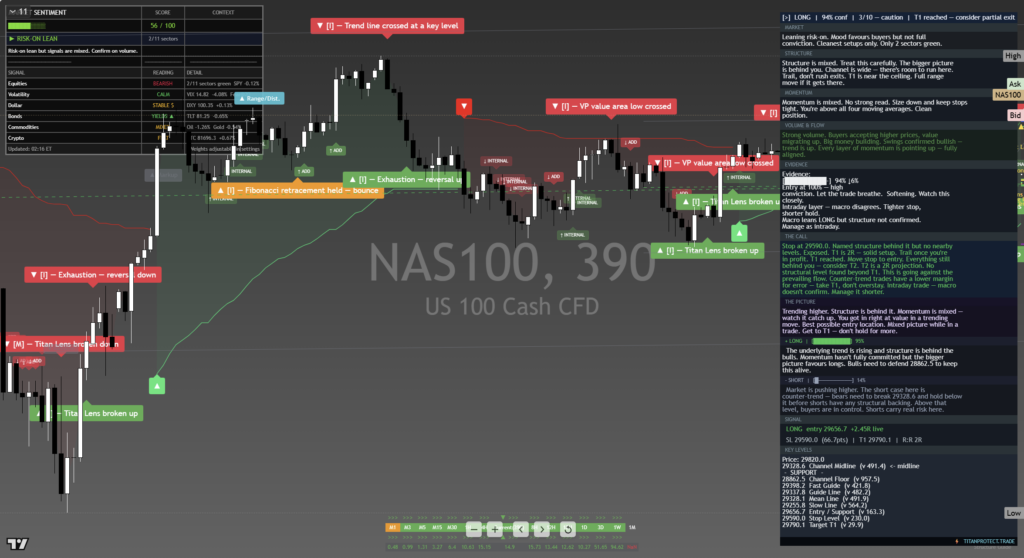
Nasdaq 100 is testing the upper edge of its recent range with the structure still bullish, but the next move must be earned rather than assumed. Last price is 29,644, 0.0 percent higher on the day, so the market is holding firm without yet extending. It is pressing the top of its one-month range after momentum ran roughly 1.9 percent up over the last two weeks. That combination matters because persistent strength near a ceiling often signals accumulation, but failure to convert pressure into a breakout can leave late buyers exposed. The clear view is constructive while the market holds its underlying structure, with confirmation still required overhead.
The macro backdrop is challenging but supportive at the margin. The Federal Reserve has turned more restrictive, keeping borrowing costs and valuation sensitivity in focus, particularly for long-duration technology shares. Against that, easing pressure from oil and bond markets has helped risk appetite recover, while semiconductor and AI-linked demand continue to favor the Nasdaq 100 over more economically sensitive areas. The index is therefore trading on a tension between tighter financial conditions and confidence in durable technology earnings. That explains why resilience matters more than simple daily direction. Buyers are absorbing the macro headwind, but they still need follow-through to prove that the move is more than defensive rotation.
The one month average at 29,374 is the nearest structural reference. Price is above it, and the structure reads as a clean uptrend, with price above both its one-month and longer averages. Holding that area would show that pullbacks remain controlled and that buyers are willing to defend the recent advance. The nearer round number handles at 30,000 and 29,500 frame immediate positioning. Sustained trade above 29,500 keeps pressure on the month swing high at 29,753, about 0.4 percent above the current price, while 30,000 is the psychological test that could attract both profit-taking and breakout demand. The broader three month range runs from 27,176 to 30,643, making the upper boundary the natural destination if resistance gives way. Below, a shelf of support sits at 28,753, about 3.0 percent below. It is the key line defending the bullish structure because a failure there would turn an orderly pullback into a broader range reversal.
The bull path is straightforward: if buyers produce a decisive move above 29,753, then overhead supply has been absorbed and the path opens toward 30,643. Acceptance above 30,000 would strengthen that case by showing that the market can hold beyond a conspicuous handle rather than merely spike through it. The bear path begins if repeated rejection near the highs pushes price back through 29,500 and the one month average at 29,374. If that weakness then reaches and loses 28,753, the bullish structure is damaged and 27,176 becomes exposed.
The principal risk is a renewed tightening in financial conditions or a reversal in AI and semiconductor leadership, either of which could make elevated technology valuations harder to defend. The read is invalidated by sustained trade below 28,753, not by ordinary hesitation near resistance. Net, the Nasdaq 100 remains upwardly biased, but conviction belongs with a confirmed break above 29,753; until then, this is a strong market confronting meaningful supply.
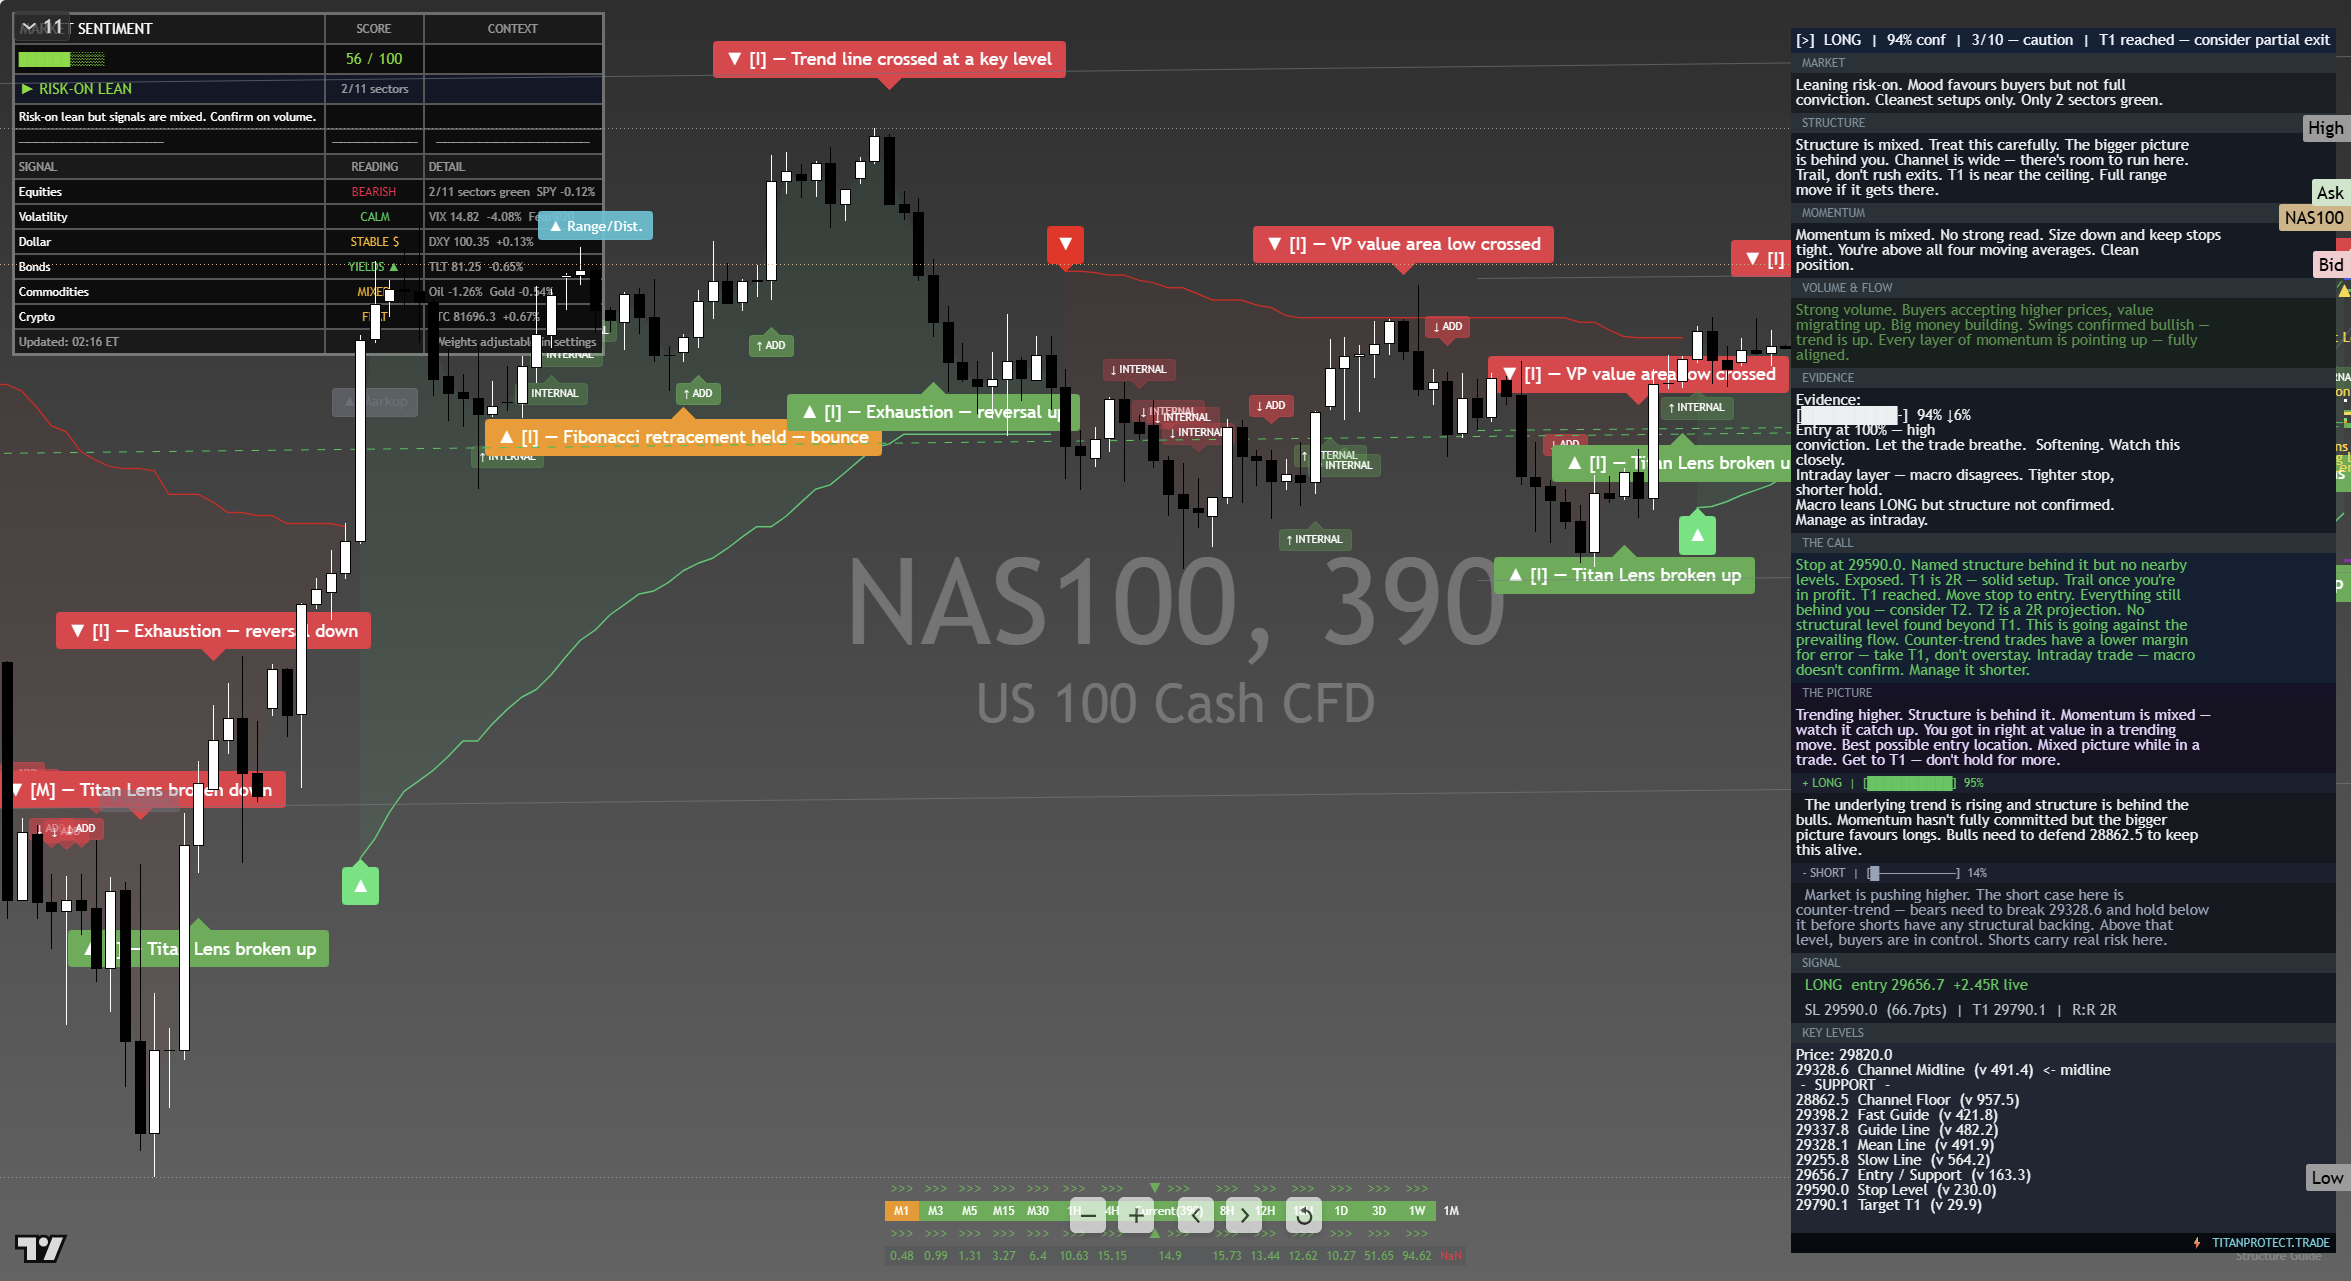
The chart above is the full daily read: structure, momentum, the levels that matter, and where the current price sits against them. Read it top to bottom for the complete picture, and pair it with our session briefs for the wider market context.
This is analysis, not financial advice. It reflects our multi-factor framework and is not a recommendation to buy or sell. Always do your own research and manage your risk.