Microsoft (MSFT) – Daily Read
9 October 2026 | Stock | Titan Macro Desk
$522.61
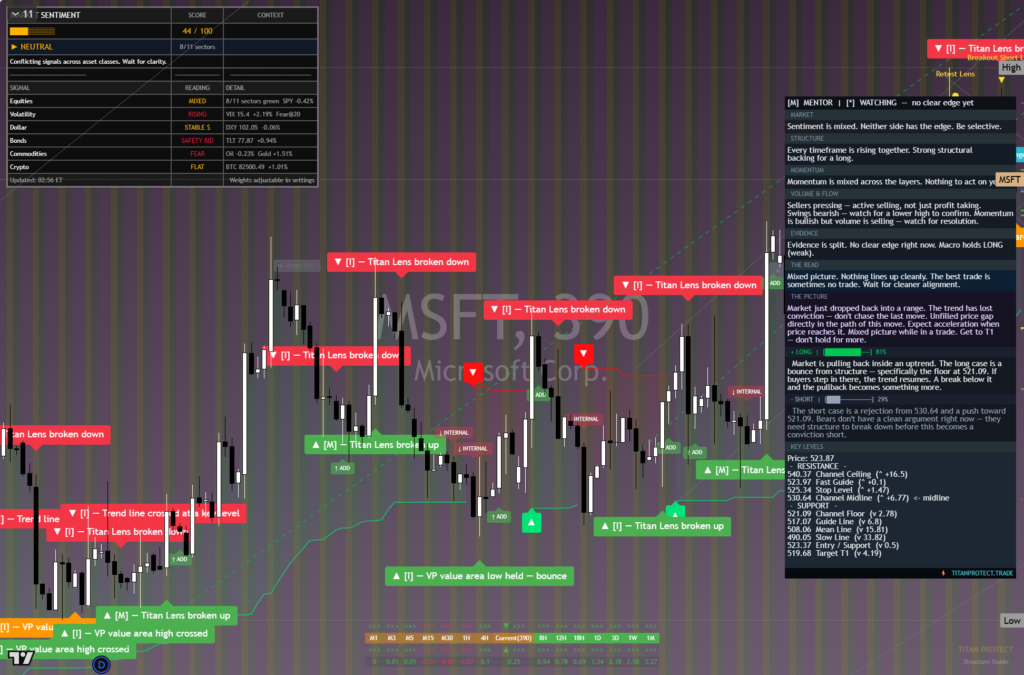
Microsoft is absorbing a routine pullback without damaging its broader advance. Last price $522.61, 1.3 percent lower on the day. That softness matters because it tests whether buyers still view weakness as an entry point after a strong run, rather than the beginning of a deeper reset. The working view remains constructive: the stock is holding in the upper half of its one-month range, its trend is intact, and recent momentum has not yet been meaningfully unwound.
The wider backdrop is one in which large technology stocks remain highly sensitive to changes in growth expectations, financing conditions, and confidence in sustained corporate spending. For Microsoft specifically, the key debate is whether enthusiasm around cloud and artificial intelligence can continue translating into durable earnings growth without expectations becoming too demanding. That makes price behavior near recent highs especially informative. Momentum roughly 5.0 percent up over the last two weeks shows that buyers have retained control despite the latest decline. The one month average $507.55; price is above it, and the structure reads as a clean uptrend, price above both its one-month and longer averages. This is not merely positive positioning. It means sellers have yet to force a meaningful change in the market’s assessment of the stock.
The nearer round number handles at $530.00 and $520.00 frame the immediate contest. Holding $520.00 would show that buyers are defending the lower edge of the current trading pocket and treating the daily weakness as consolidation. Reclaiming $530.00 would restore pressure on the month swing high $535.69, about 2.5 percent above the current price. That high matters because it is both the recent ceiling and the upper boundary of the three month range $355.43 to $535.69. A decisive move above $535.69 opens the path toward $540.00, signaling that supply at the range top has been absorbed and that price discovery can resume.
Below the market, a shelf of support at $486.00, about 7.0 percent below, is the more important structural defense. It sits far enough beneath the current price to distinguish ordinary volatility from genuine trend failure. Buyers defending it would preserve the broader sequence of strength, while sustained trade below it would show that the market is no longer willing to support Microsoft at the prior value area. Losing $486.00 exposes $355.43, not as an automatic destination, but as the next major reference within the established range once the key shelf has failed.
The bull path is straightforward: if $520.00 holds and price regains $530.00, then another test of $535.69 becomes likely; if that ceiling breaks decisively, then $540.00 is the next logical objective. The bear path begins if rebounds fail beneath $530.00 and sellers establish control below $520.00. If that weakness extends through $507.55, then momentum has cooled materially and attention shifts toward $486.00. If $486.00 fails, then the bullish structure is invalidated and downside risk broadens toward $355.43.
The central risk is that expectations around Microsoft’s growth engines weaken at the same time the broader market reduces exposure to richly valued technology shares. The read is also invalidated by a clear loss of $486.00. Until then, the net take is constructive but selective: the trend favors buyers, though confirmation requires renewed strength through the recent ceiling rather than confidence based on reputation alone.
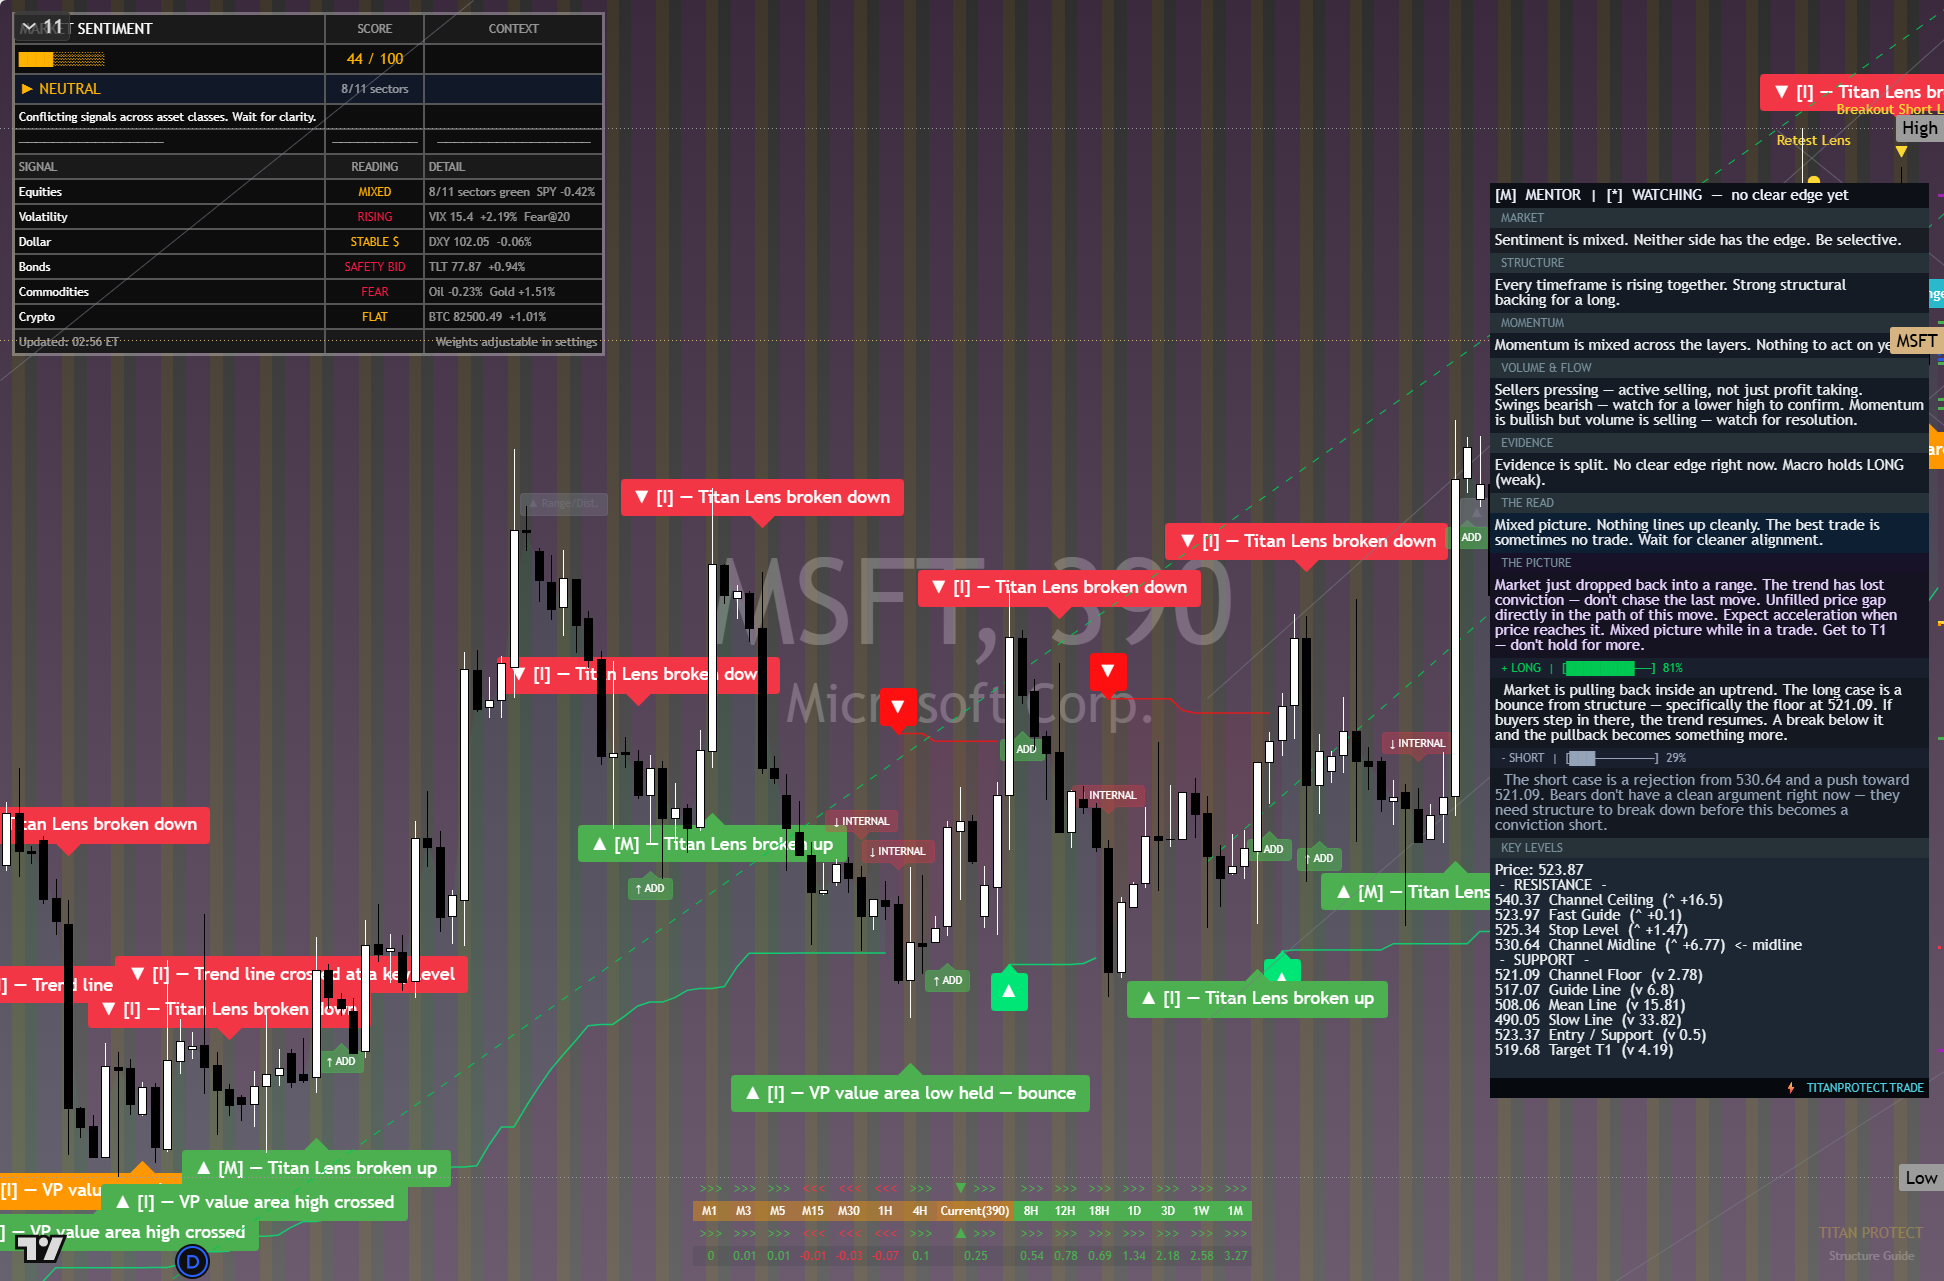
The chart above is the full daily read: structure, momentum, the levels that matter, and where the current price sits against them. Read it top to bottom for the complete picture, and pair it with our session briefs for the wider market context.
This is analysis, not financial advice. It reflects our multi-factor framework and is not a recommendation to buy or sell. Always do your own research and manage your risk.