Microsoft (MSFT) – Daily Read
2 October 2026 | Stock | Titan Macro Desk
$512.80
Microsoft is consolidating near the top of its recent range while the broader market wrestles with volatile bonds, elevated energy risk, and an important US employment catalyst. Last price $512.80, 0.0 percent lower on the day. That flat performance matters because MSFT is absorbing a less forgiving backdrop without surrendering its upward structure. The clear view is constructive while support holds, but buyers still need to prove they can convert resilience into a fresh breakout.
The macro tension is straightforward. Bond-market instability and persistent inflation concerns are challenging richly valued growth stocks, while geopolitical pressure around energy keeps the rate outlook uncertain ahead of key labor data. That creates a higher hurdle for the technology complex because future earnings become less valuable when financing conditions tighten. Against that, Microsoft retains company-specific support from strong enterprise demand across cloud and artificial intelligence services, with adoption and capacity expansion reinforcing the revenue case. The counterweight is the cost of building that capacity and the pressure sustained investment can place on margins and cash generation. In this environment, the market is rewarding visible monetization rather than spending alone. ([AP market context](https://apnews.com/article/a2b99562febc21d84955e243c87f5d31), [Microsoft investor update](https://www.microsoft.com/en-us/investor/events/fy-2026/earnings-fy-2026-q3))
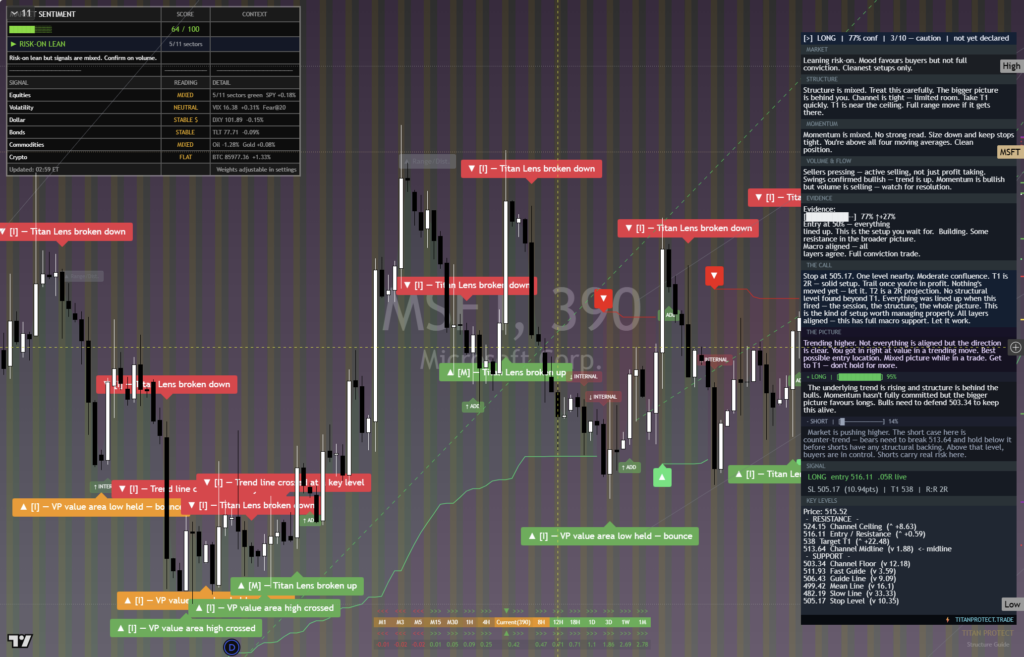
The stock is holding in the upper half of its one-month range. The one month average $500.72 sits below price, and the structure reads as a clean uptrend, price above both its one-month and longer averages. Momentum roughly 3.9 percent up over the last two weeks confirms that buyers have maintained control, although the proximity of resistance raises the chance of consolidation. The nearer round number handles at $520.00 and $510.00 define the immediate contest. Holding $510.00 shows that shallow weakness is still attracting demand, while acceptance above $520.00 would indicate that sellers near the range ceiling are being absorbed.
The month swing high $522.85, about 2.0 percent above the current price, is the decisive ceiling because it marks the point where the latest advance previously stopped. The three month range $355.43 to $522.85 also makes that upper boundary strategically important. A shelf of support at $486.00, about 5.2 percent below, is the deeper line defending the uptrend. It should attract buyers who missed the advance, but failure there would show that positioning has shifted from orderly profit-taking toward genuine distribution.
The bull path is clear: if MSFT holds $510.00, reclaims $520.00 with conviction, and sustains demand through the range ceiling, then a decisive move above $522.85 opens the path toward $530.00. That sequence would confirm that company-specific cloud and artificial intelligence enthusiasm is outweighing macro pressure. The bear path begins if $510.00 repeatedly rejects recovery attempts. If that weakness pulls price below the one month average $500.72, then attention turns to $486.00. Losing $486.00 exposes $355.43, although exposure means the protective structure has failed, not that the lower boundary must be reached immediately.
The main risk is a renewed bond selloff or evidence that investment costs are outrunning monetization. A sustained break below $486.00 invalidates the constructive read. Net, MSFT remains bullish above support, but $522.85 is the proof point separating a healthy consolidation from a completed advance.
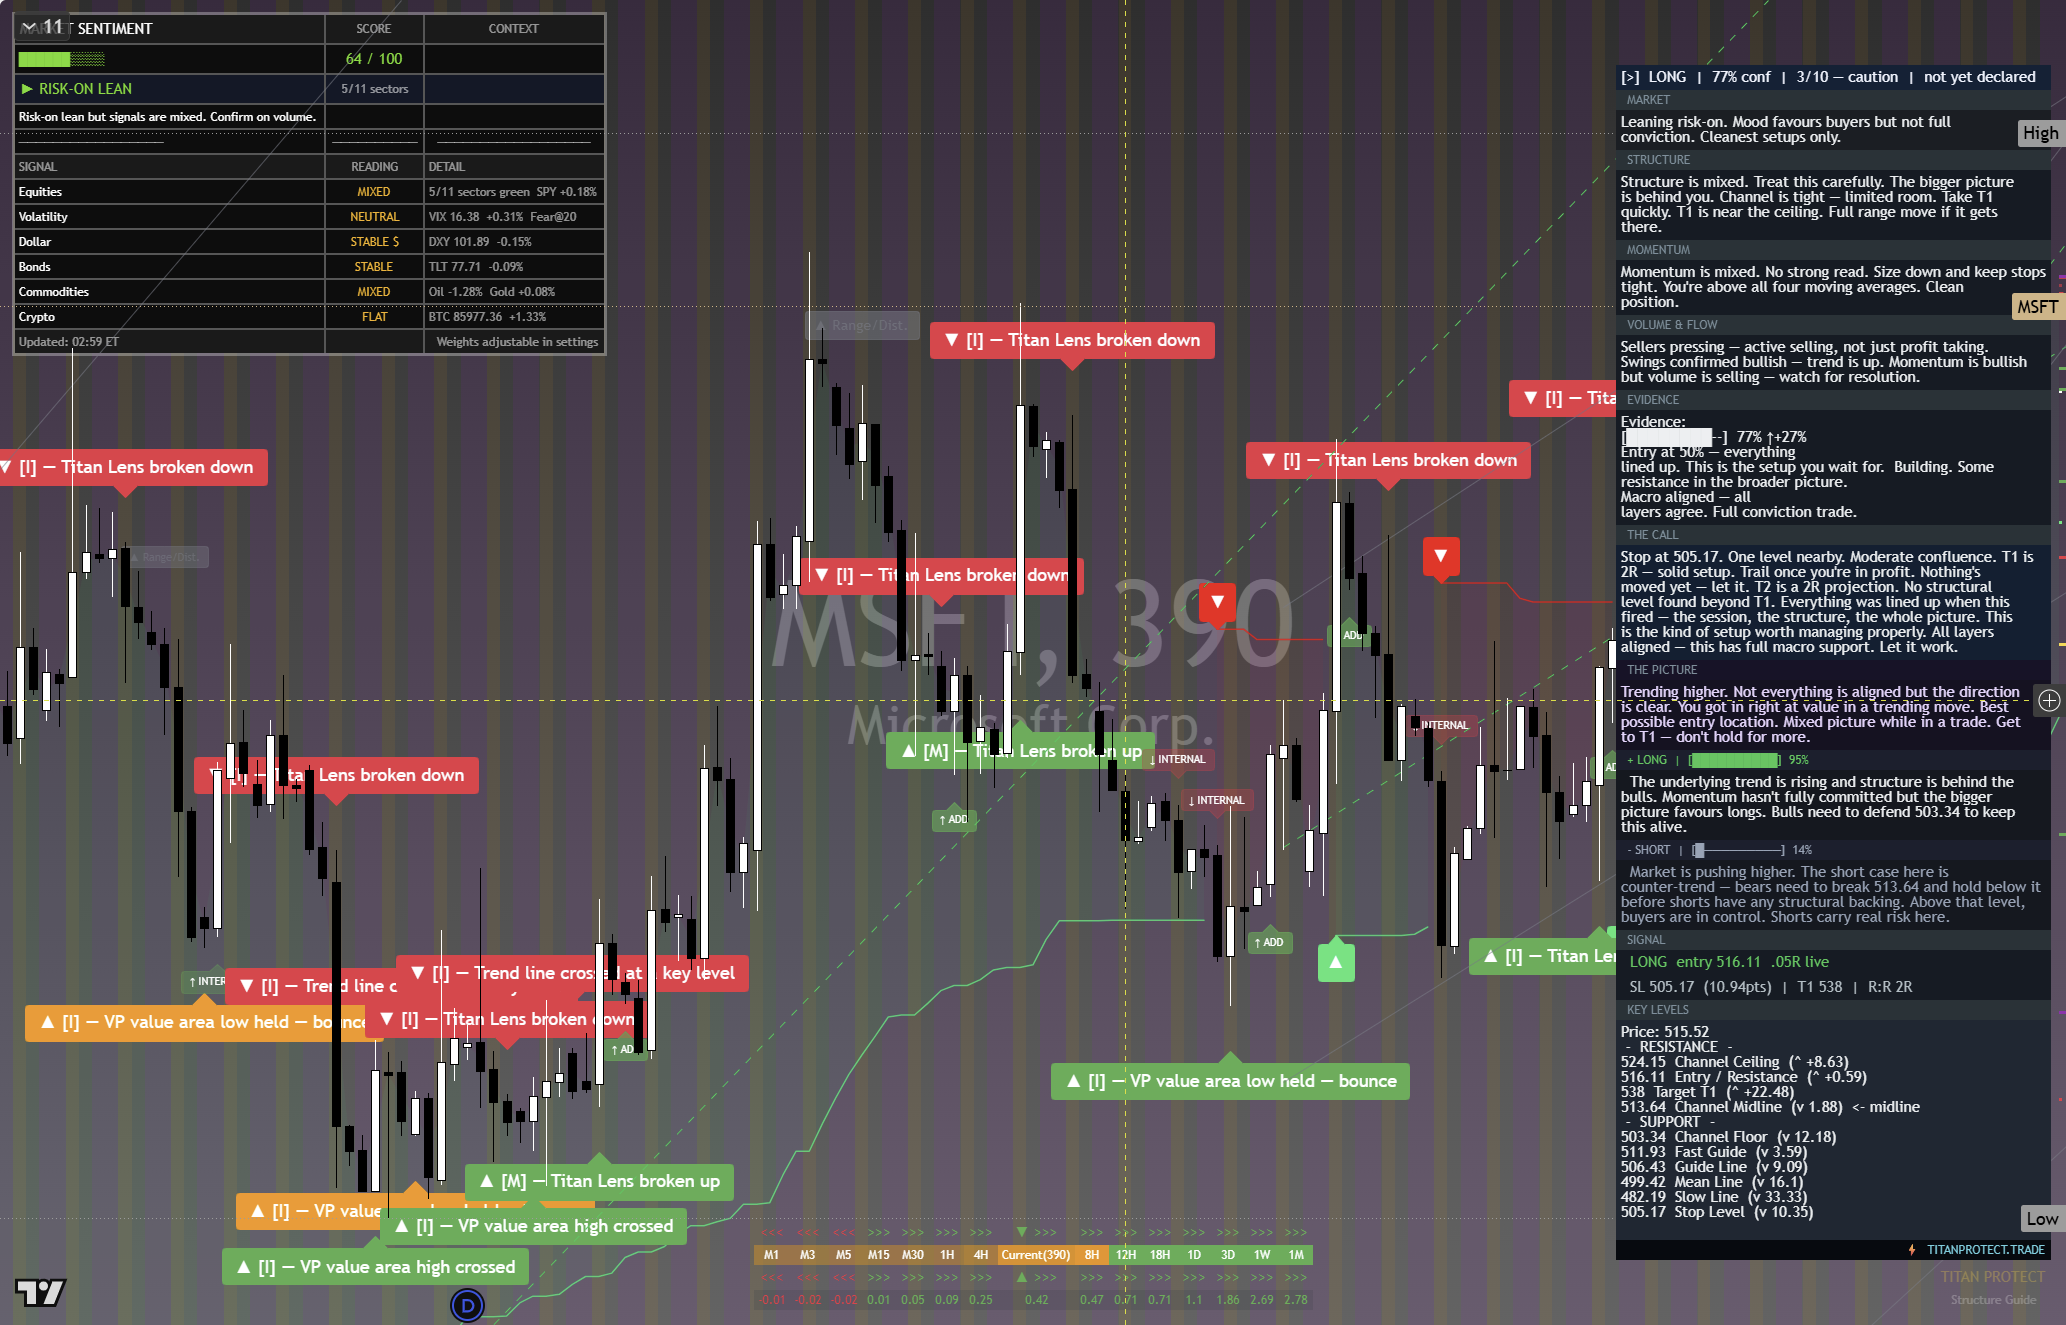
The chart above is the full daily read: structure, momentum, the levels that matter, and where the current price sits against them. Read it top to bottom for the complete picture, and pair it with our session briefs for the wider market context.
This is analysis, not financial advice. It reflects our multi-factor framework and is not a recommendation to buy or sell. Always do your own research and manage your risk.