Meta (META) – Daily Read
9 October 2026 | Stock | Titan Macro Desk
$720.89
Meta is consolidating within a broader advance, with the last price at $720.89, 0.1 percent lower on the day. The key tension is between constructive trend structure and fading near-term momentum. It is sitting mid-range over the past month, which leaves neither side in control at current levels. The clear view is that the larger trend remains bullish, but buyers need to reclaim nearby resistance before the market can treat this pullback as complete.
The wider macro backdrop matters through risk appetite, growth expectations, and the market’s willingness to pay for durable technology earnings. For Meta specifically, sentiment toward large-cap technology and confidence in its ability to convert investment into profitable growth remain central. The one month average is $715.66; price is above it, and the structure reads as a clean uptrend, price above both its one-month and longer averages. That keeps the strategic bias constructive. However, momentum roughly 7.3 percent down over the last two weeks shows that recent sellers still have influence, even though they have not yet broken the broader structure.
The immediate pivot is the nearer round number handle at $725.00. It matters because reclaiming and holding it would place price back above the current area of hesitation, giving buyers a stronger platform for another run at the upper boundary. The other nearer round number handle at $700.00 is the first meaningful test beneath the market. Buyers should defend it if the pullback is merely consolidation, while sustained trade below it would suggest that weakness is spreading beyond routine profit-taking.
The month swing high is $779.82, about 8.2 percent above the current price. This is the principal ceiling because it marks where the previous advance met enough supply to reverse. A decisive move above $779.82 opens the path toward $804.82, signaling that buyers have absorbed that supply and restored upside price discovery. Below, a shelf of support at $638.56, about 11.4 percent below, is the major structural defense. It represents the area where demand must reappear to preserve the broader bullish case. The three month range is $524.52 to $779.82, so failure at that shelf would materially change the character of the range. Losing $638.56 exposes $524.52.
The bull path is straightforward: if Meta holds above $700.00, retakes $725.00, and then sustains demand into $779.82, the pullback should be treated as a reset within the uptrend. If $779.82 then breaks decisively, $804.82 becomes the logical extension. The bear path begins if $700.00 fails and recovery attempts cannot regain $725.00. In that case, pressure can build toward $638.56. If that defense gives way, the market would be repricing the broader structure rather than merely correcting it, with $524.52 exposed.
The main risk to the bullish read is that the decline in recent momentum becomes persistent selling while price loses its established support hierarchy. A sustained break below $638.56 would invalidate the constructive trend thesis. Conversely, the bearish case loses force if buyers reclaim $725.00 and convert $779.82 from resistance into support. Net, Meta remains structurally bullish but tactically unsettled, with confirmation required before chasing strength.
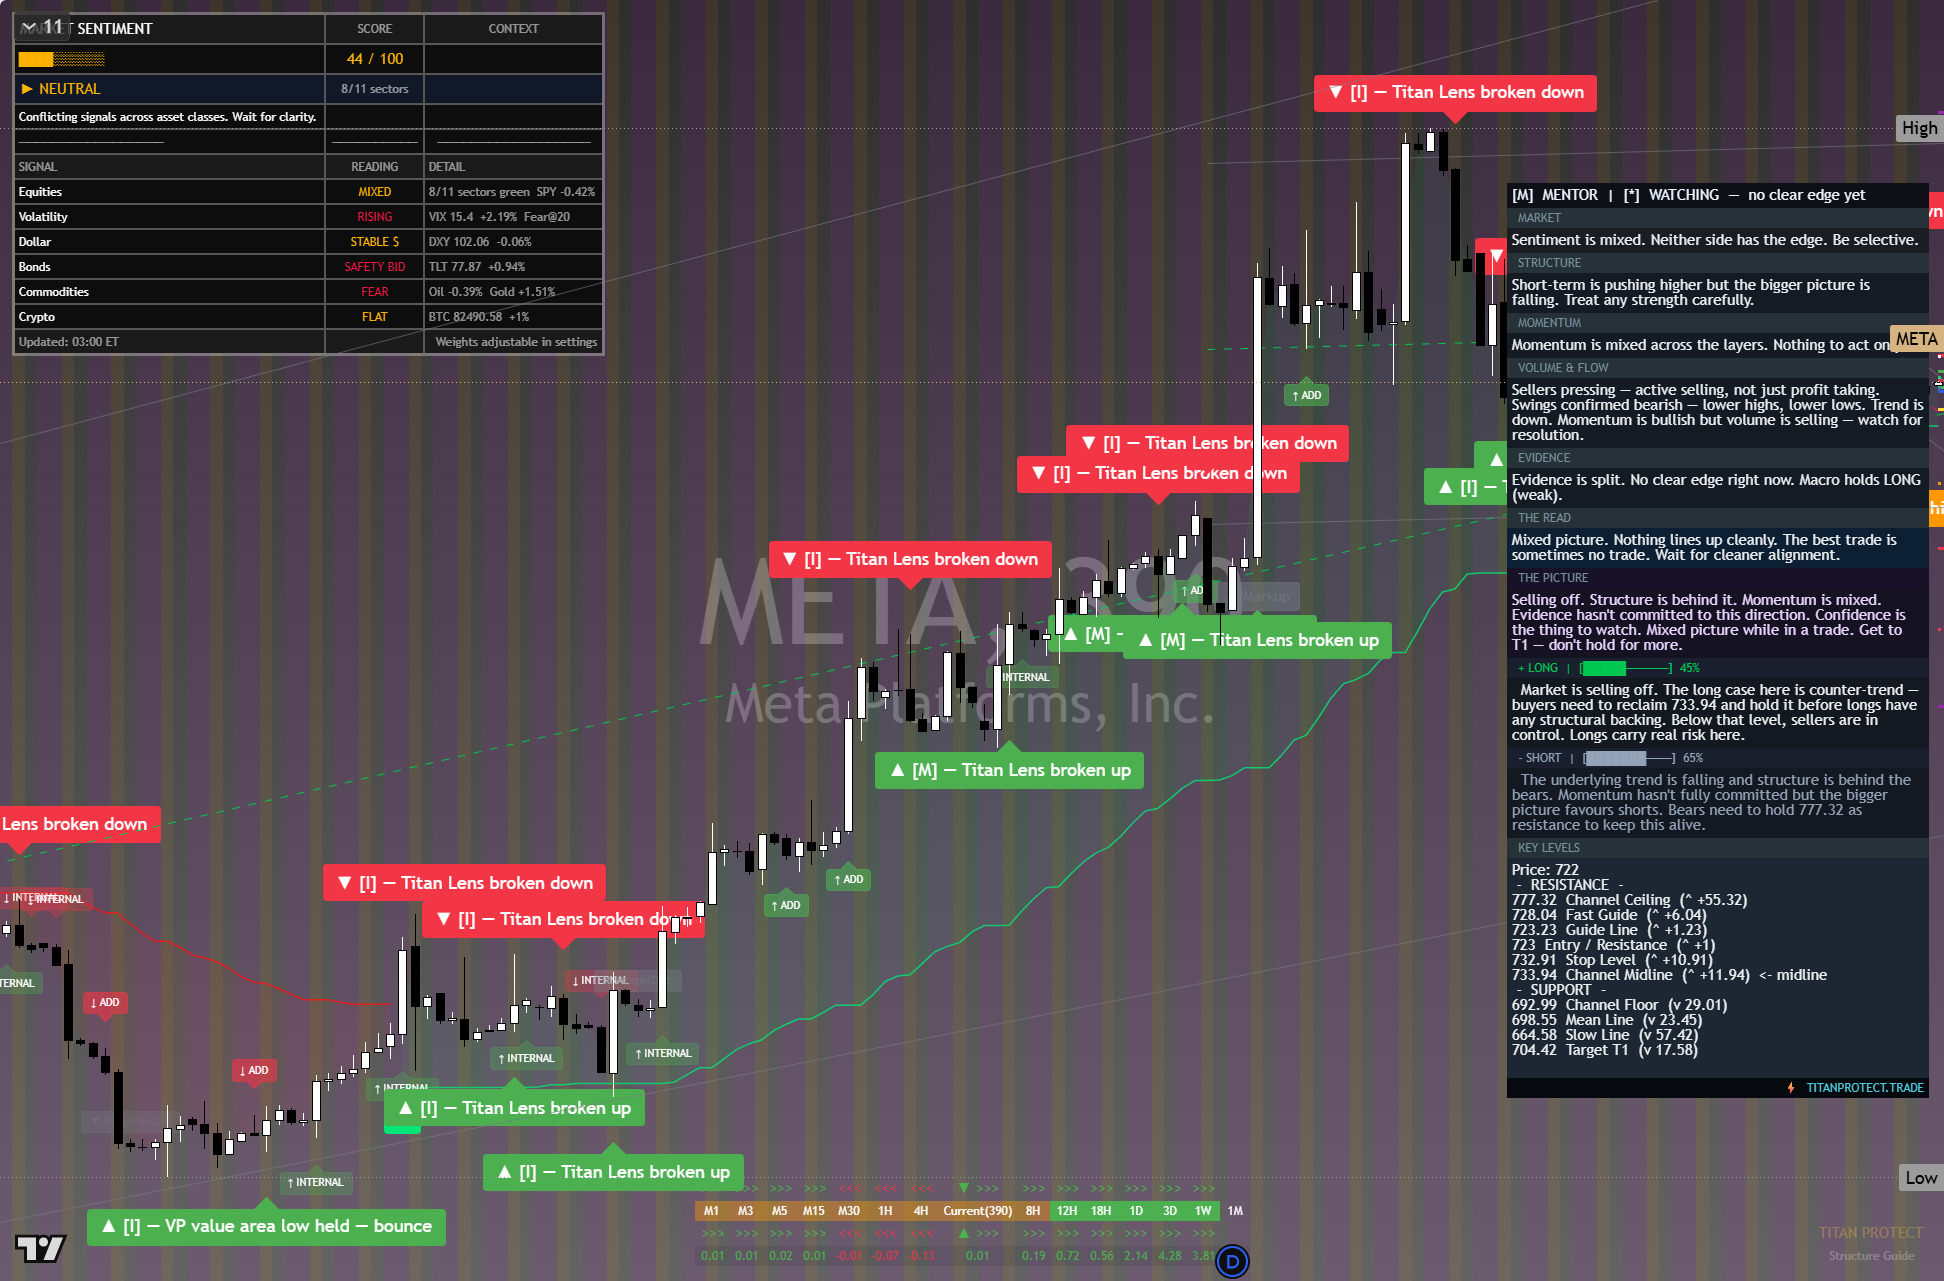
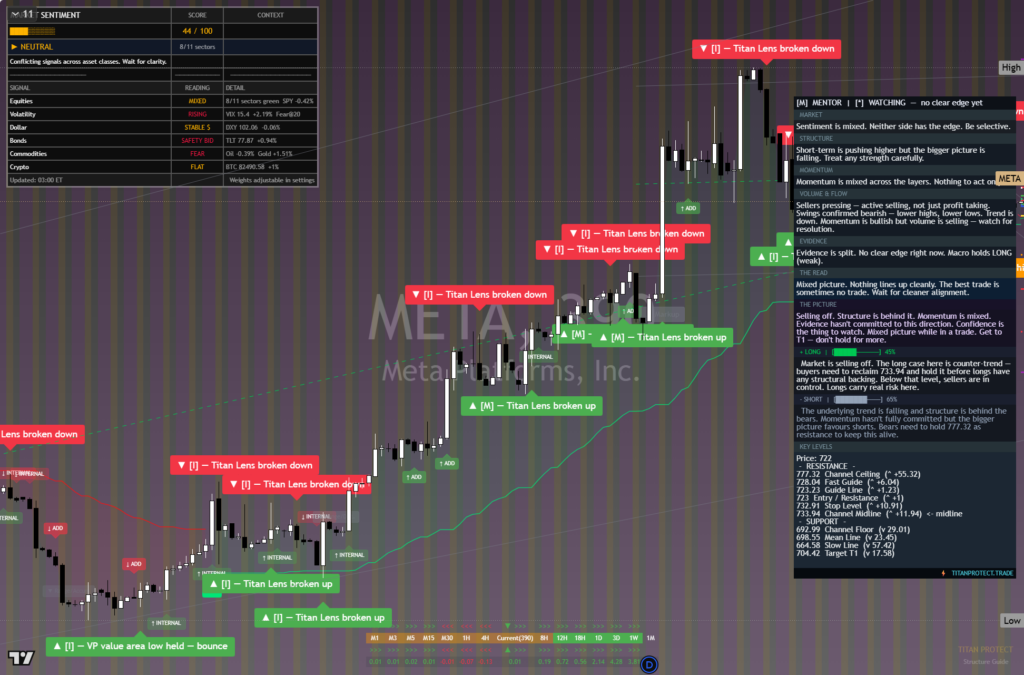
The chart above is the full daily read: structure, momentum, the levels that matter, and where the current price sits against them. Read it top to bottom for the complete picture, and pair it with our session briefs for the wider market context.
This is analysis, not financial advice. It reflects our multi-factor framework and is not a recommendation to buy or sell. Always do your own research and manage your risk.