Meta (META) – Daily Read
24 September 2026 | Stock | Titan Macro Desk
$744.10
Meta is trading like a leadership stock rather than a passive beneficiary of the broader market. Last price $744.10, 1.0 percent higher on the day, and it is pressing the top of its one-month range. That matters because strength near the upper boundary signals that buyers are accepting elevated prices instead of waiting for a meaningful pullback. The clear view is constructive, but the trade is becoming more demanding: upside confirmation now requires fresh price discovery, while failure near the highs would leave recent buyers exposed to a sharper reset.
The macro backdrop is best understood as a contest between enthusiasm for durable growth and sensitivity to changing expectations around rates, liquidity, and corporate spending. Large technology stocks can absorb that uncertainty when earnings credibility and capital investment narratives remain intact, but crowded leadership can also reprice quickly when confidence slips. Meta’s specific advantage is persistent demand for exposure to scaled digital advertising, engagement, and artificial intelligence monetization. Its one month average is $641.77; price is above it, and the structure reads as a clean uptrend, price above both its one-month and longer averages. Momentum is roughly 13.8 percent up over the last two weeks, confirming strong sponsorship while also raising the cost of chasing.
The immediate decision area is the nearer round number handle at $750.00. Sustained acceptance above it would show that buyers can carry the move through a psychologically important barrier. The other nearer round number handle at $725.00 matters as the first practical defense of the latest advance. Holding it would preserve the pattern of buyers stepping in at increasingly higher prices; losing it would suggest that enthusiasm near the range top is fading. The month swing high is $763.90, about 2.7 percent above the current price, and it is the key breakout boundary. The three month range is $524.52 to $763.90, so clearing its ceiling would convert resistance into evidence of expanding demand. Far below, a shelf of support at $546.30, about 26.6 percent below, marks the major structural defense. Its distance highlights both the strength of the advance and the limited protection available if the trend genuinely breaks.
If Meta holds $725.00, establishes acceptance above $750.00, and then delivers a decisive move above $763.90, the bull path opens toward $775.00. That sequence would show orderly demand first, followed by breakout confirmation. If price cannot hold $750.00 and then loses $725.00, the bear path becomes a cooling move back through the recent advance. If selling ultimately overwhelms $546.30, that would expose $524.52 and signal that the broader structure has failed, not merely paused.
The principal risk is extension: strong recent performance can attract late buying just as the stock reaches the hardest supply zone. The read would be weakened by repeated rejection near $763.90 and invalidated structurally by losing $546.30. Net, the bias remains bullish while $725.00 is defended, but conviction should rise only when price proves it can clear the range ceiling.
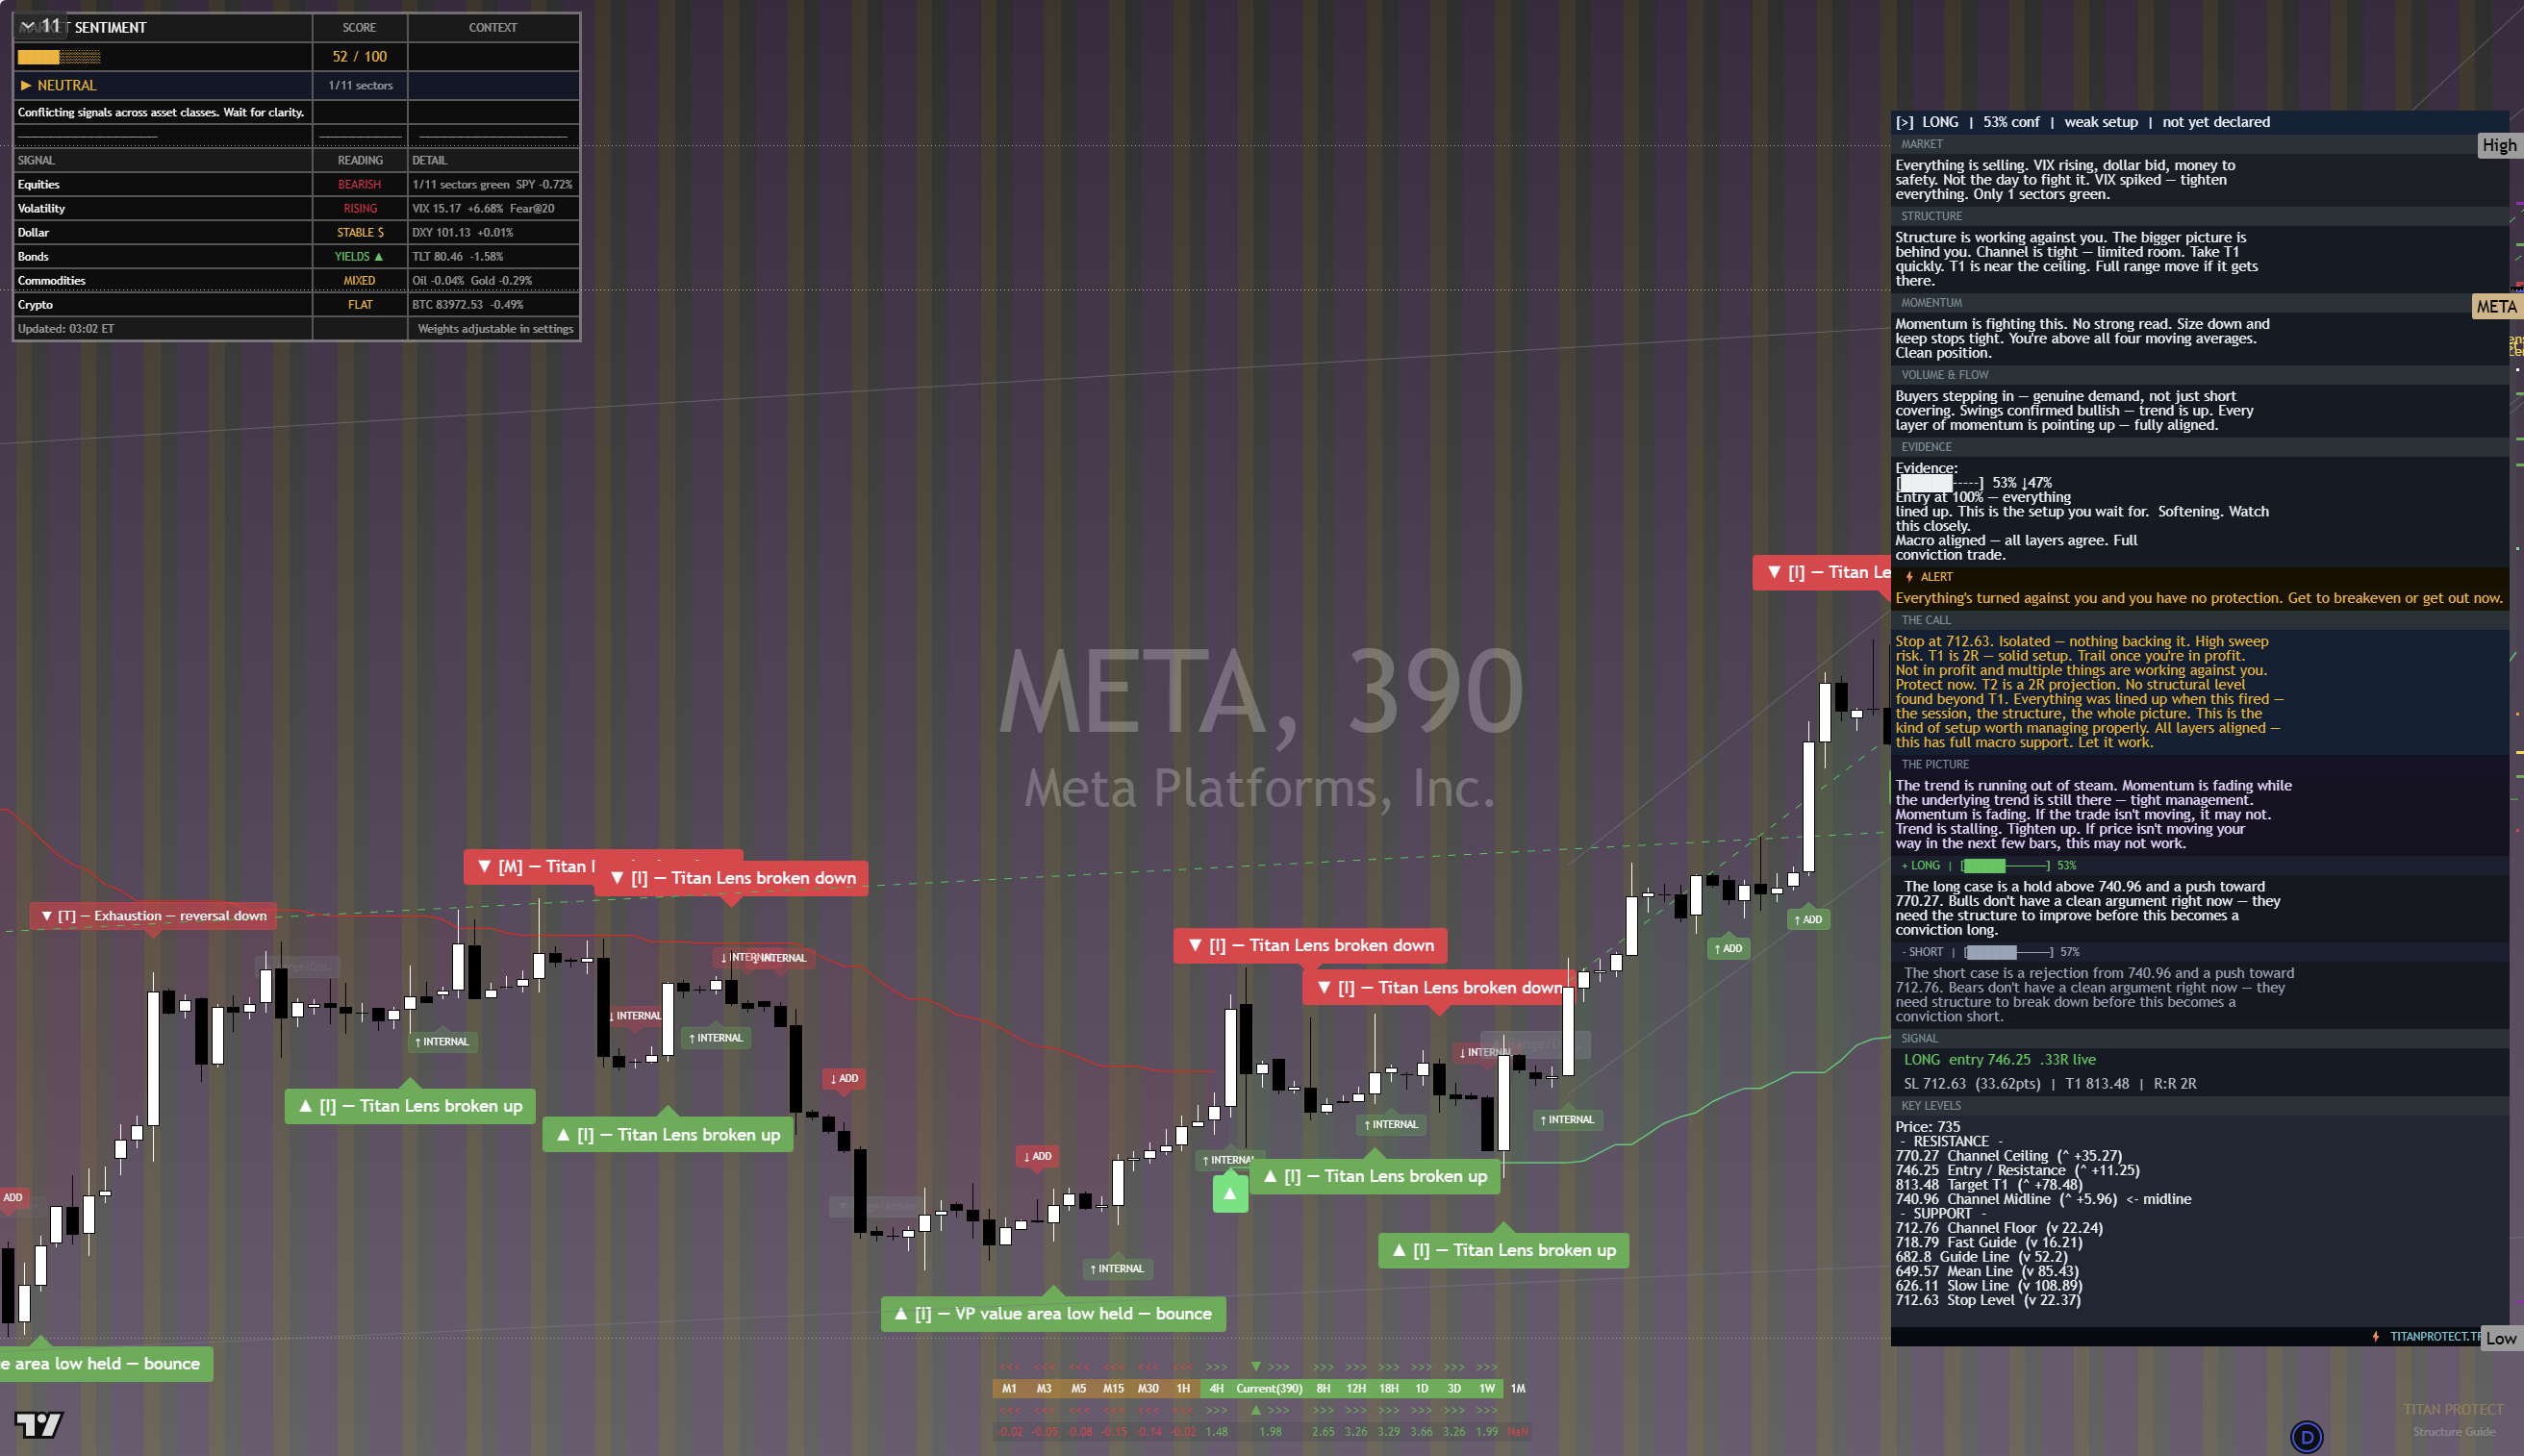
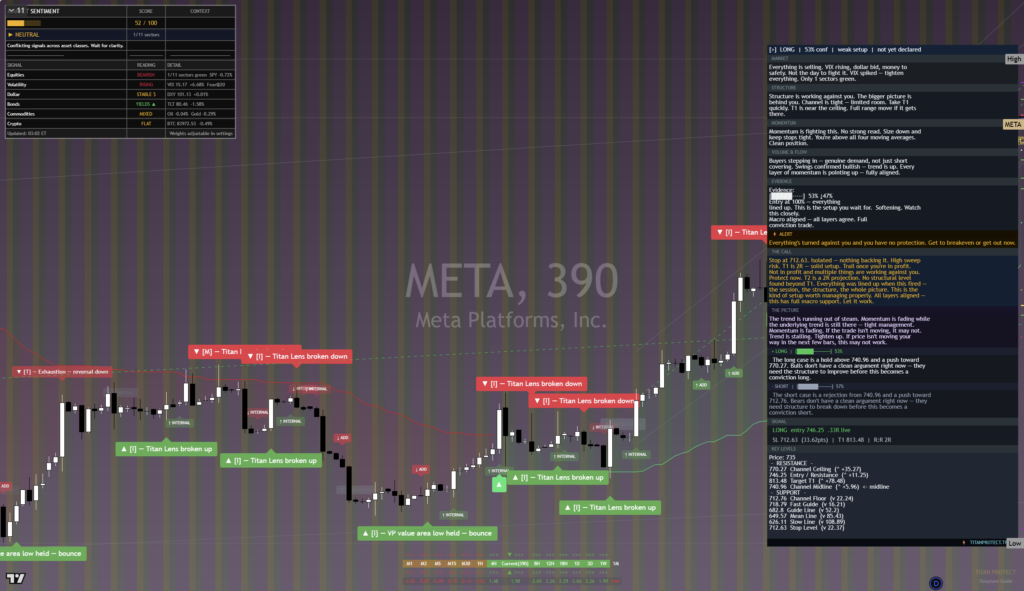
The chart above is the full daily read: structure, momentum, the levels that matter, and where the current price sits against them. Read it top to bottom for the complete picture, and pair it with our session briefs for the wider market context.
This is analysis, not financial advice. It reflects our multi-factor framework and is not a recommendation to buy or sell. Always do your own research and manage your risk.