Guide
Features
How It Works
Instructions
Strategies
Learn
FAQ
Advanced Market Analysis
Made Simple
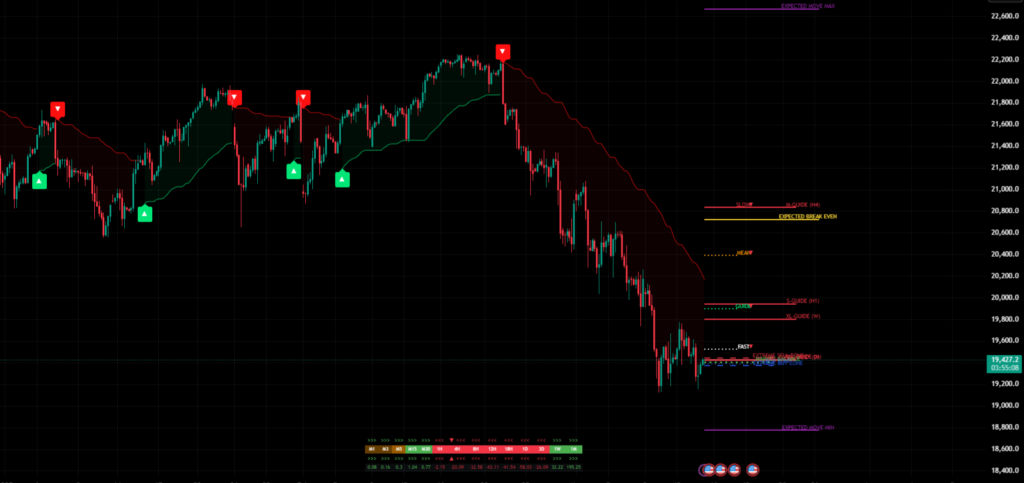
Stop guessing. Start trading with confidence using the [TP] Guide indicator that shows you exactly where the market is heading.
Comprehensive multi-timeframe analysis, clear entry/exit signals, and powerful market structure insights to help you make informed trading decisions with confidence.
By visualizing complex market data through intuitive color-coded guides and smart signals, this powerful indicator helps you identify high-probability trading opportunities across any market and timeframe.
Our members report a 32% increase in win rate when incorporating the [TP] Guide into their existing trading strategies.
Powerful Features for Every Trader
Designed for both beginners and experienced traders, the [TP] Guide offers a comprehensive suite of tools to enhance your trading.
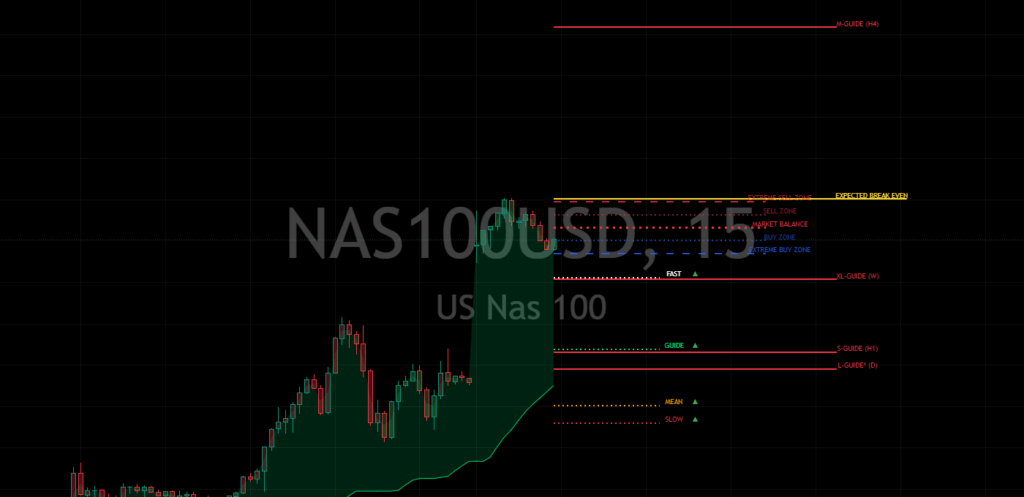
Multi-Timeframe Analysis
Gain insights from multiple timeframes simultaneously with our advanced heatmap system that shows trend strength across time horizons from M1 to Monthly.
- Intraday guides (Fast, Guide, Mean, Slow)
- High-timeframe guides (S, M, L, XL, XXL)
- Visual timeframe correlation indicators
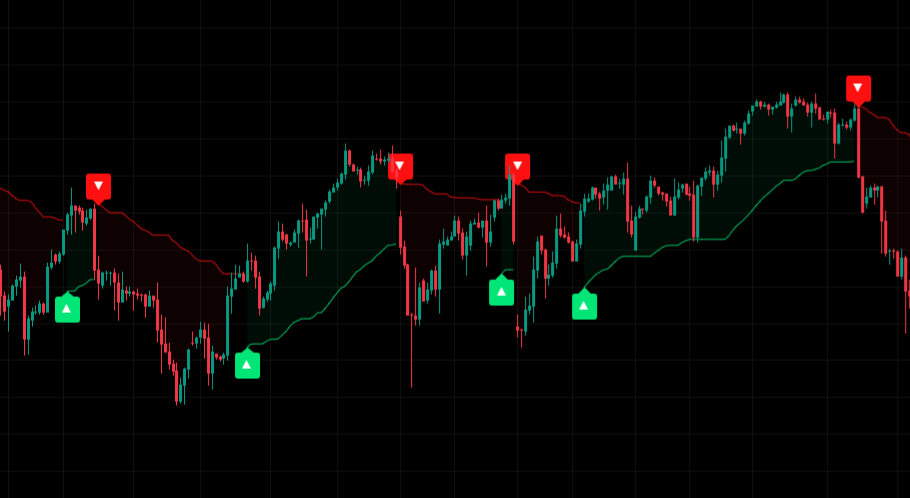
Precision Entry/Exit Signals
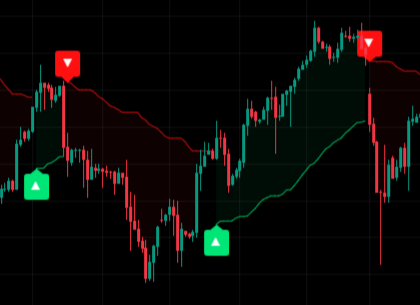
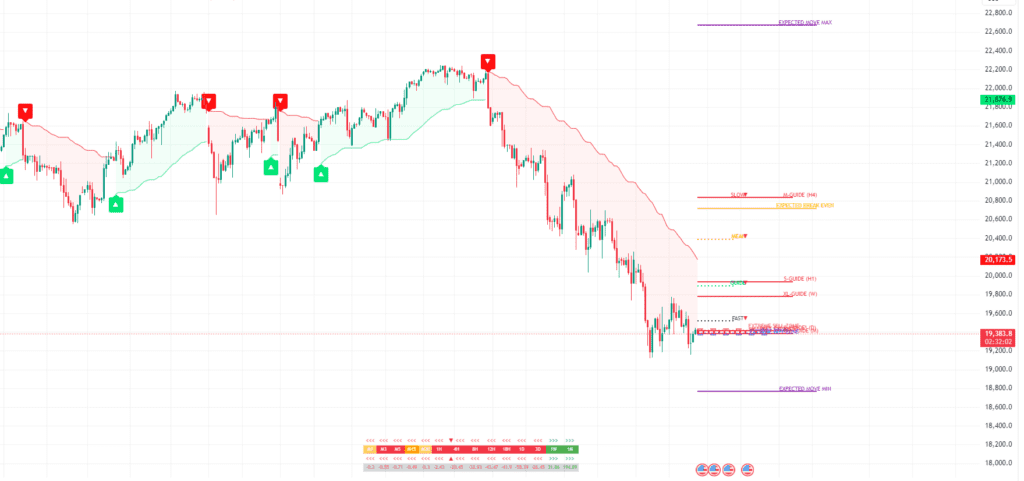
Clear buy/sell signals with distinctive indicators help you identify optimal entry and exit points with confidence.
- ▲ Buy signals with green arrows
- ▼ Sell signals with red arrows
- Adaptive signal timing based on market conditions
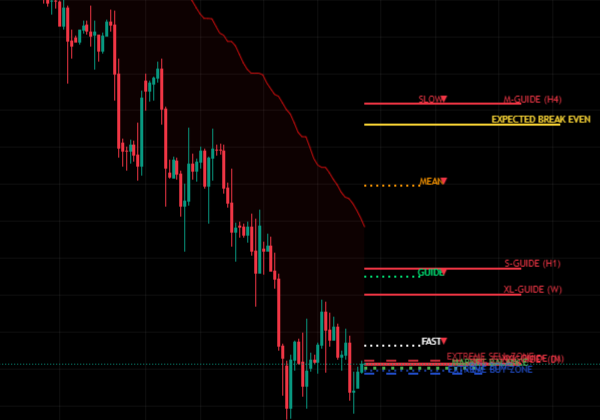
Dynamic Balance Levels
Innovative balance levels adapt to market conditions, showing key zones for buying, selling, and potential reversals.
- Market Balance central line
- BUY/SELL zones for optimal entry
- EXTREME zones for reversal potential
Expected Move Framework
Anticipate potential price boundaries with our proprietary expected move calculations, helping you set realistic targets.
- EXPECTED MOVE MAX/MIN boundaries
- EXPECTED BREAK EVEN central point
- Statistical boundaries based on market volatility
Market Structure Analysis
Visualize critical market levels with our comprehensive structure analysis tools.
- Intraday balance levels
- Expected price range projections
- Buy/Sell/Extreme zones identification
Acceleration Analysis
Unique acceleration indicators show when trends are gaining or losing momentum across different timeframes.
- Dynamic threshold detection
- Momentum state identification
- Visual acceleration arrows
Trend Quality Assessment
Gauge trend strength and quality with advanced metrics that help you identify high-probability trading opportunities
- Composite quality calculations
- Acceleration/deceleration indicators
- Trend order analysis (bullish/bearish)
Market Adaptability
Works effectively across various markets and timeframes with intelligent adaptation..
- Compatible with stocks, forex, crypto, futures
- Dynamic volatility adjustment analysis
- Responsive to changing market conditions
Customizable Experience
Tailor the [TP] Guide to match your trading style with extensive customization options.
- Light/Dark theme compatibility
- Component toggles for focused analysis
- Color and style personalization
Trade with Clarity and Precision
The Guide eliminates confusion and helps you make confident trading decisions based on proven market analysis.
See the Complete Market Picture
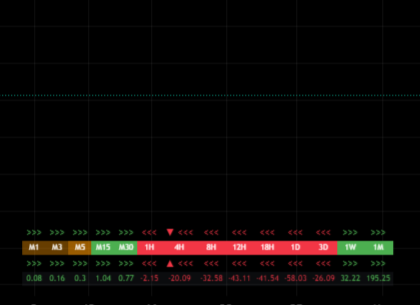
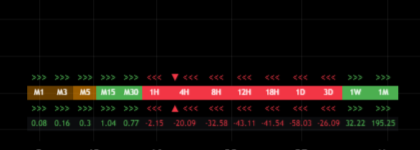
The Multi-Timeframe Flow Bar gives you instant insight into which timeframes are driving price movement.
- >>> Green arrows indicate bullish acceleration
- <<< Red arrows show bearish acceleration
- — Orange indicates transitional periods
- Different timeframes from M1 to Monthly at a glance
How It Works
The Guide uses advanced algorithms to simplify complex market data into clear visual guidance.
The Guide System
The Multi-Timeframe Flow Bar gives you instant insight into which timeframes are driving price movement.
1. Guide Alignment
When all guides align in order and share the same colour, they form a strong signal. Green from top to bottom indicates a bullish trend, while red in reverse order shows bearish conditions.
2. Multi-Timeframe Confirmation
The Flow Bar confirms which timeframes are driving price movement, helping you align with the strongest market forces and avoid false signals.
3. Entry & Exit Timing
Entry signals appear when conditions align, showing you the optimal moments to enter trades. The system adapts to changing market conditions for accurate timing.
As simple as 1, 2, 3..
1. Trend Identification
The system automatically identifies the current trend direction across multiple timeframes, giving you the complete market picture.
2. Key Level Detection
Powerful algorithms detect important price levels where the market is likely to react, helping you anticipate reversals and continuations
3. Signal Generation
When multiple factors align, the system generates high-probability trade signals, filtering out market noise for clearer decision-making.
Our Mathematical Edge
Unlike traditional indicators that rely on lagging data, the [TP] Guide uses advanced mathematical models and statistical analysis to identify high-probability trading opportunities.
The system continuously adapts to changing market conditions, ensuring consistent performance across different market regimes.
“The [TP] Guide doesn’t just follow the market – it anticipates moves before they happen.”
Understanding Guide Levels
Key Guide Components
S, M, L, XL, XXL Guides
High timeframe guides that represent key structural levels. They act as road signs marking powerful price levels where the market often reacts.
Fast, Guide, Mean, Slow
Intraday guides that show what’s happening right now. Their order and color provide clear direction for short-term trading decisions.
Guide Alignment
When guides align in a specific order and share the same color, they indicate strong trend conditions. This provides high-probability trading opportunities.
Guide Clusters & Expansions
When guides cluster together, it often indicates compression before a big move. When they expand and separate, it can signal a breakout or trend continuation.
Simple Instructions for Powerful Results
The Guide is designed to be intuitive and easy to use, regardless of your trading experience.
Getting Started
Advanced Usage
1 Understanding the Colour Rules
Green = Bullish (look for buying opportunities), Red = Bearish (look for selling opportunities), Orange = Uncertain/Transitional (exercise caution)
4 The Flow Bar (Bottom of Screen)
Green arrows (>>>) indicate acceleration up, Red arrows (<<<) show acceleration down, and Orange suggests price is slowing down or changing direction. This tells you which timeframe is pushing price right now.
2 Key Zones: The ‘S to XXL’ Guides
These act as road signs marking powerful price levels. When aligned and sharing the same color, they indicate strong trend conditions. These represent structural levels for medium to long-term analysis.
5 Guide Clusters & Expansions
When guides cluster together, it often indicates compression before a big move. When they expand and separate, it can signal a breakout or trend continuation. Watch these formations for high-probability setups.
3 Intraday Guides: Fast, Guide, Mean, Slow
These show what’s happening right now. All 4 green from top to bottom indicates safer buying conditions, while all 4 red from bottom to top suggests safer selling conditions. Perfect for scalping or intraday trading.
6 Trend Transitions
Watch for guide order flipping as a trend shift signal. XL overlapping S often indicates a retracement zone. Fast crossing Slow can signal a momentum shift. These transitions help you anticipate changes in market direction.
Tips for Beginners
- Only trade when everything lines up (colors + arrows)
- Avoid mixed signals or cluttered zones
- Start with 1-2 timeframes you understand (e.g., 15M or H1)
- Don’t overthink – the Guide does the hard work for you
- Use replay mode on TradingView to practice with it live
- Focus on the most basic signals first before moving to advanced patterns
Tips for Advanced Traders
- Customize the display to match your trading style
- Use guide clusters to identify compression before breakouts
- Pay attention to the Flow Bar for multi-timeframe confirmation
- Watch for guide order flipping as a trend shift signal
- Use the mathematical edge to develop precise entry/exit strategies
- Combine with market structure analysis for highest probability setups
Getting Started
Advanced Usage
Titan Specific Content, Login for full access.
Proven Trading Strategies
The Guide supports multiple trading approaches. Here are some effective strategies to get you started.
Trend Following Strategy
- Use the Multi-Timeframe Flow Bar to confirm the dominant trend
- Look for all guides aligned in the same direction (green for bullish, red for bearish)
- Enter when price pulls back to a guide level and a signal appears
- Set stop-loss below the next significant guide level
- Target the next major resistance/support level
“The best trend trades happen when all the guides are aligned in the same direction and the Flow Bar shows strong acceleration.”
Scalping Strategy
- Focus on the FAST and GUIDE lines for short-term direction
- Watch for Fast > Guide > Mean > Slow alignment (bullish) or reverse (bearish)
- Enter when you see a signal in the same direction as the alignment
- Use tight stops and take quick profits at the next guide level
- Use the Flow Bar to confirm the short-term momentum
“Scalpers love the Fast and Guide lines – they provide quick entries and exits with minimal risk.”
Breakout Trading Strategy
- Identify guide clusters (compression zones) where multiple guides are close together
- Wait for the guides to start expanding and separating
- Look for acceleration arrows (>>> or <<<) on the Flow Bar
- Enter in the direction of the breakout when confirmed by guide alignment
- Place stops below the closest guide level in the opposite direction
- Target the next major support/resistance level or use a trailing stop
“Guide clusters often precede the most explosive price moves. When they start to expand, be ready to capture the breakout.”
Member Insights
1. Trend Following Strategy
Capitalize on strong market trends with high-probability entries aligned with the dominant market forces.
-
Identify alignment in the guide levels
Look for all guide levels (FAST, GUIDE, MEAN, SLOW) aligned in the same direction and color.
-
Confirm with the Multi-Timeframe Flow Bar
Ensure multiple timeframes show acceleration arrows in the same direction.
-
Wait for a signal arrow
Enter when a green (buy) or red (sell) arrow appears, confirming the trend direction.
-
Set stops at the next significant guide level
Place your stop-loss below/above the nearest guide level in the opposite direction.
-
Target the EXPECTED MOVE level
Take profits at the EXPECTED MOVE MAX (for longs) or MIN (for shorts) level.
“This strategy works because it aligns you with the strongest market forces across multiple timeframes, increasing the probability of successful trades and reducing the likelihood of false signals.”
2. Guide Level Bounce Strategy
Take advantage of precise support and resistance levels to enter trades with optimal risk/reward ratios.
-
Identify strong guide levels
Focus on where multiple guide levels cluster close together, creating a powerful support/resistance zone.
-
Wait for price to approach the level
Monitor price action as it approaches the guide level cluster from above or below.
-
Look for rejection signals
Enter when you see a signal arrow confirming the bounce off the level.
-
Place a tight stop beyond the guide level
Set your stop-loss just beyond the guide level that was respected.
-
Target the next guide level or balance zone
Take profits at the next significant guide level in the direction of your trade.
“Guide levels act as institutional liquidity zones where big players enter and exit the market. By trading bounces off these levels, you’re effectively aligning with smart money flow while maintaining a favourable risk/reward ratio.”
3. Guide Breakout Strategy
Capture powerful momentum moves when price breaks through significant guide levels after compression phases.
-
Identify guide clusters (compression)
Look for periods when multiple guide levels are close together, indicating a compression zone.
-
Monitor for guide expansion
Watch for the guides to start separating and establishing a clear directional bias.
-
Wait for price to break the outer guide
Enter when price decisively breaks through the last guide level in the cluster.
-
Confirm with multi-timeframe flow
Ensure the Flow Bar shows acceleration arrows (>>> or <<<) in the breakout direction.
-
Target the EXPECTED MOVE level
Take profits at the appropriate EXPECTED MOVE level or use a trailing stop.
“Compression followed by expansion is one of the most reliable patterns in markets. This strategy helps you identify when a market is coiling for a big move and positions you to capture the bulk of the resulting momentum.”
4. Balance Level Strategy
Trade the high-probability reversal zones within the dynamic balance framework for consistent, lower-risk opportunities.
-
Monitor price relative to balance levels
Identify when price approaches the EXTREME BUY or EXTREME SELL zones.
-
Wait for rejection patterns
Look for signal arrows indicating potential reversals from these extreme zones.
-
Enter with confirmation
Take trades when the signal aligns with a rejection from the extreme level.
-
Set tight stops beyond the extreme level
Place stops just outside the level that triggered your entry.
-
Target the MARKET BALANCE line
Take profits as price returns to the equilibrium (MARKET BALANCE) level.
“Markets tend to respect statistical boundaries and revert to their mean. This strategy capitalizes on that tendency by identifying when price has extended too far from its equilibrium and is likely to snap back, providing excellent risk/reward opportunities.”
Bullish Trading Scenario
Ideal Setup: When multiple timeframes align in a bullish configuration.
Entry Conditions:
- Price is above the GUIDE level
- Intraday levels show bullish alignment (FAST > GUIDE > MEAN > SLOW)
- Green upward arrow ▲ signal appears
- Multi-timeframe heatmap shows green across key timeframes
- Price is near or rebounding from a BUY ZONE
Management:
- Target profits near EXPECTED MOVE MAX or next resistance level
- Trail stops below the GUIDE or MEAN level based on timeframe
- Monitor for changes in the multi-timeframe heatmap
- Consider partial profit taking at key HTF guide levels
Exit Signals:
- Price breaks below the GUIDE level with increased momentum
- Red downward arrow ▼ signal appears
- Multi-timeframe heatmap shifts to red in key timeframes
- Price reaches EXPECTED MOVE MAX with slowing momentum
Bearish Trading Scenario
Ideal Setup: When multiple timeframes align in a bearish configuration.
Entry Conditions:
- Price is below the GUIDE level
- Intraday levels show bearish alignment (FAST < GUIDE < MEAN < SLOW)
- Red downward arrow ▼ signal appears
- Multi-timeframe heatmap shows red across key timeframes
- Price is near or falling from a SELL ZONE
Management:
- Target profits near EXPECTED MOVE MIN or next support level
- Trail stops above the GUIDE or MEAN level based on timeframe
- Monitor for changes in the multi-timeframe heatmap
- Consider partial profit taking at key HTF guide levels
Exit Signals:
- Price breaks above the GUIDE level with increased momentum
- Green upward arrow ▲ signal appears
- Multi-timeframe heatmap shifts to green in key timeframes
- Price reaches EXPECTED MOVE MIN with slowing momentum
Advanced Usage Tips
Timeframe Alignment Analysis
The strongest trades occur when multiple timeframes align in the same direction. Use the multi-timeframe heatmap to identify when short, medium, and long-term trends are in harmony.
Mean Reversion Strategies
When price reaches EXTREME zones while higher timeframes remain in the opposite direction, look for potential mean reversion opportunities back to the MARKET BALANCE level.
Range Trading
In sideways markets, use the BUY and SELL zones as range boundaries, looking to buy at the lower boundary and sell at the upper boundary when momentum stalls.
Trend Confirmation
Use the alignment of the FAST, GUIDE, MEAN, and SLOW levels to gauge trend strength. Perfect alignment with appropriate spacing indicates strong trend momentum.
Breakout Validation
When price breaks a significant level, check the acceleration arrows in the multi-timeframe heatmap to confirm momentum behind the breakout.
Divergence Detection
Watch for divergence between price making new highs/lows and the momentum indicated by the multi-timeframe heatmap – this can signal potential reversals.
Titan Specific Content, Login for full access.
Accelerate your Learning Engine
The Guide doesn’t just show you when to enter or exit, it teaches you the underlying market mechanics (trend analysis, risk management, discipline) by putting these concepts into practice on your live chart
How it Trains You
“The Guide doesn’t just show me entry points – it trains my eye to recognize market structure before signals even appear. After a few weeks, I found myself anticipating movements based on guide alignments alone, improving my timing dramatically.”
– Michael, Titan Protect member.
-
Pattern Recognition Practice
The color-coded guide system consistently exposes you to ideal market structures, helping you internalize what strong trends look like versus choppy conditions.
-
Decision-Making Discipline
By clearly separating strong signals from weak ones, the indicator trains you to be patient and only take high-probability trades, reinforcing proper trading discipline.
-
Market Rhythm Awareness
The multi-timeframe flow bar helps you develop an intuitive sense of which timeframes are driving price, training you to align your trading with the strongest market forces.
What You Learn
“Before using the [TP] Guide, I struggled understanding how different timeframes affect each other. Now I can see exactly how a 4H trend influences 15M price action, making my trading more cohesive and purposeful.”
– Sarah, Titan Protect member.
-
Multi-Timeframe Relationships
You learn how larger timeframes create the context for smaller timeframes, and how alignment across scales creates powerful trade opportunities.
-
Market Structure Fundamentals
The guide levels teach you to identify support/resistance dynamically, showing how these levels form, break, and adapt as market conditions change.
-
Momentum vs. Mean Reversion
Through the Fast, Guide, Mean, and Slow indicators, you learn to distinguish between trending and range-bound conditions, and adapt your strategy accordingly.
-
True Signal vs. Noise Differentiation
The guide alignment patterns teach you to filter meaningful price movements from market noise, a critical skill for all successful traders.
How it Teaches You That
“What’s brilliant about the Guide is how it visually explains complex market concepts. When guides cluster and expand, you literally see compression and breakouts happening in real-time, connecting theory with actual price action.”
– Dave, Titan Protect member.
-
Visual Representation of Complex Concepts
Rather than abstract theories, the indicator provides visual cues (colours, alignments, arrows) that make advanced trading concepts tangible and easy to grasp.
-
Real-Time Feedback Loop
The immediate color changes and signal generation create a powerful feedback loop that reinforces correct pattern recognition as markets evolve.
-
Contextual Learning Environment
By showing multiple guide levels simultaneously, you learn how different market forces interact within a complete context, rather than isolated variables.
-
Progressive Complexity Design
You can start with basic colour interpretations, then gradually incorporate more nuanced guide relationships as your understanding develops.
Benefits for Your Growth
“The confidence I’ve gained from using the [TP] Guide has transformed my trading psychology. I no longer second-guess my entries because I understand exactly why I’m taking each trade based on clear market structure.”
– Jennifer, Titan Protect member.
-
Reduced Analysis Paralysis
As you internalize the guide patterns, decision-making becomes more intuitive and less stressful, freeing mental energy for strategic thinking.
-
Transfer of Skills to Other Markets
The fundamental skills you develop (trend recognition, timeframe relationships, momentum analysis) transfer to any market or asset you might trade in the future.
-
Transition from Dependent to Independent
While initially relying on the indicator’s signals, you’ll gradually develop the ability to spot these patterns independently, becoming a more self-sufficient trader.
-
Emotional Regulation Practice
The clear visual structure helps separate objective market conditions from emotional reactions, training you to trade from analysis rather than fear or greed.
Our community members consistently report that the Guide doesn’t just improve their results – it transforms how they understand markets. By making complex concepts visual and intuitive, it accelerates the learning process that typically takes years of screen time. We’re not just providing signals; we’re helping you develop the trained eye of a professional trader.
Titan Specific Content, Login for full access.
The [TP] Guide is designed to reduce stress, not add to it. Trust the visuals, focus on learning the patterns, and let the Guide teach you price action over time.
Ready to Trade Smarter?
Click Here
Frequently Asked Questions
Get answers to common questions about the [TP] Guide indicator.
Which timeframes work best with the [TP] Guide?
The indicator is designed to work on any timeframe but performs optimally on charts from 5-minute to daily. The Multi-Timeframe Flow Bar adapts to show relevant context regardless of which timeframe you’re viewing.
How should I use the different guide levels?
The guides represent different market rhythms. FAST and GUIDE are more responsive to recent price action, while MEAN and SLOW represent longer-term trends. S to XXL guides show structural levels. Use them in combination to understand the complete market structure.
Is the [TP] Guide suitable for beginners?
Absolutely! The indicator is designed with simplicity in mind. The color-coded system and clear visual signals make it accessible for traders of all experience levels. Beginners can focus on the basic color rules, while more experienced traders can leverage the advanced features.
What markets can I use the [TP] Guide with?
The [TP] Guide works effectively across all major markets including forex, cryptocurrencies, stocks, commodities, and indices. Its mathematical foundation makes it adaptable to different market environments and volatility conditions.
Does the indicator repaint or lag?
No, the [TP] Guide does not repaint. All signals are based on confirmed price data, ensuring reliability for your trading decisions. The system is designed to balance responsiveness with accuracy, giving you timely signals without excessive lag.
Can I customize the indicator to match my trading style?
Yes, the [TP] Guide offers various customization options. You can toggle different components on/off based on your preferences, adjust colors, and focus on the timeframes that matter most to your trading approach.
The indicator is designed to work on any timeframe but performs optimally on charts from 5-minute to daily. The Multi-Timeframe Flow Bar adapts to show relevant context regardless of which timeframe you’re viewing.
The guides represent different market rhythms. FAST and GUIDE are more responsive to recent price action, while MEAN and SLOW represent longer-term trends. S to XXL guides show structural levels. Use them in combination to understand the complete market structure.
Absolutely! The indicator is designed with simplicity in mind. The color-coded system and clear visual signals make it accessible for traders of all experience levels. Beginners can focus on the basic color rules, while more experienced traders can leverage the advanced features.
The [TP] Guide works effectively across all major markets including forex, cryptocurrencies, stocks, commodities, and indices. Its mathematical foundation makes it adaptable to different market environments and volatility conditions.
No, the [TP] Guide does not repaint. All signals are based on confirmed price data, ensuring reliability for your trading decisions. The system is designed to balance responsiveness with accuracy, giving you timely signals without excessive lag.
Yes, the [TP] Guide offers various customization options. You can toggle different components on/off based on your preferences, adjust colors, and focus on the timeframes that matter most to your trading approach.
Take Your Trading to the Next Level
Join traders who have transformed their results with the [TP] Guide indicator. Stop guessing and start trading with confidence.
Join Titan Protect and get access to:
- [TP] Guide
- Complete Setup Instructions
- Strategy guides
- Regular updates and improvements
30-day money-back guarantee. No questions asked.