Gold (XAU/USD) – Daily Read
7 October 2026 | Commodity | Titan Macro Desk
$4,160.20
Gold is testing whether this retreat is a corrective reset or the start of a deeper liquidation. Last price $4,160, 0.7 percent lower on the day, leaves the market vulnerable because it is down near the floor of its one-month range. The clear view is defensive: sellers retain control until price repairs the damaged structure, but nearby support makes chasing weakness unattractive. This is a decision area where the next break should carry more information than the latest daily move.
The macro backdrop remains central because gold must balance demand for defensive assets against the pressure that tighter financial conditions, resilient real yields, or a firm currency can create. Expectations around monetary policy, inflation credibility, fiscal risk, and geopolitical hedging can therefore change positioning quickly, even without altering the broader case for owning gold. For this instrument specifically, the immediate problem is persistent selling pressure. The one month average $4,310 sits above price, and the structure reads as a downtrend, price under both its one-month and longer averages. Momentum roughly 5.1 percent down over the last two weeks confirms that buyers have not yet regained initiative.
The nearer round number handles at $4,200 and $4,100 frame the immediate contest. Reclaiming $4,200 would show that demand is absorbing supply and would begin repairing short-term confidence, while failure there keeps rallies vulnerable to renewed selling. A shelf of support at $4,131, about 0.7 percent below, matters more because it is the nearest defined defense against range expansion lower. Buyers need to hold that shelf to preserve the possibility of stabilization around the lower end of the recent range. Losing it would turn a controlled pullback into a more consequential breakdown. The month swing high $4,489, about 7.9 percent above the current price, is the major upside barrier because only a recovery through that point would overturn the sequence of weakness. The three month range $3,990 to $4,755 provides the broader map, with each boundary representing the next meaningful destination after confirmation.
The bull path is straightforward: if $4,131 holds, price recovers $4,200, and subsequent buying carries it through $4,310, then the market can build a base and challenge the monthly peak. A decisive move above $4,489 opens the path toward $4,755, because that break would invalidate the prevailing lower structure and force defensive sellers to reassess. The bear path begins if rebounds fail beneath $4,200 and demand cannot defend the nearby shelf. Losing $4,131 exposes $3,990, with a break below $4,100 likely reinforcing the move by confirming that round-number demand has also failed.
The main risk to the bearish lean is a sharp shift in macro expectations that restores urgent defensive demand and drives a sustained recovery through the overhead barriers. Conversely, repeated failure to bounce from support would invalidate the stabilization case. The net take is cautious below $4,310: the trend still favors sellers, but proximity to $4,131 makes confirmation essential. Hold and reclaim favors repair; break and acceptance lower favors continuation toward the bottom of the broader range.
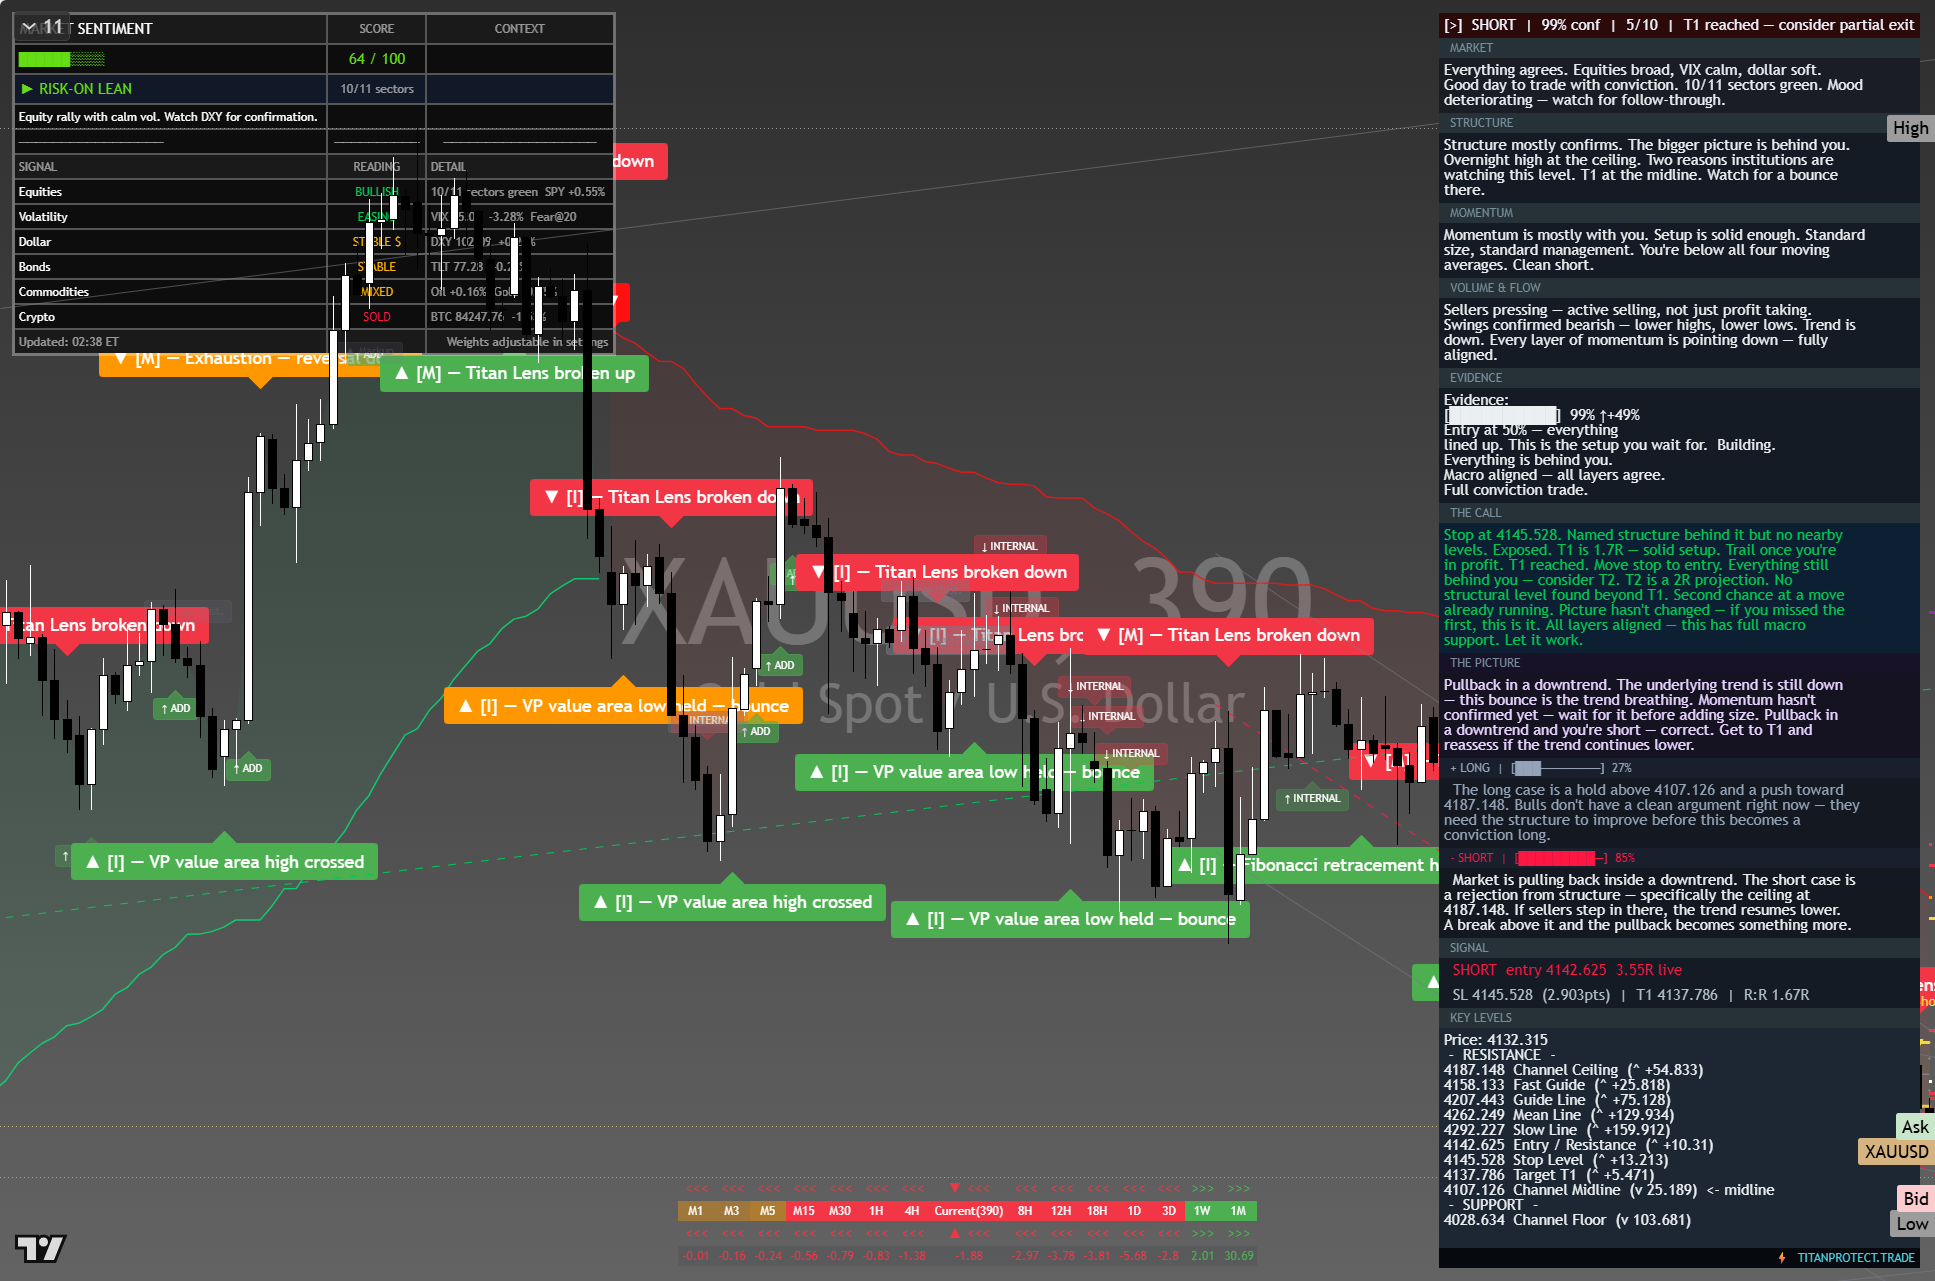
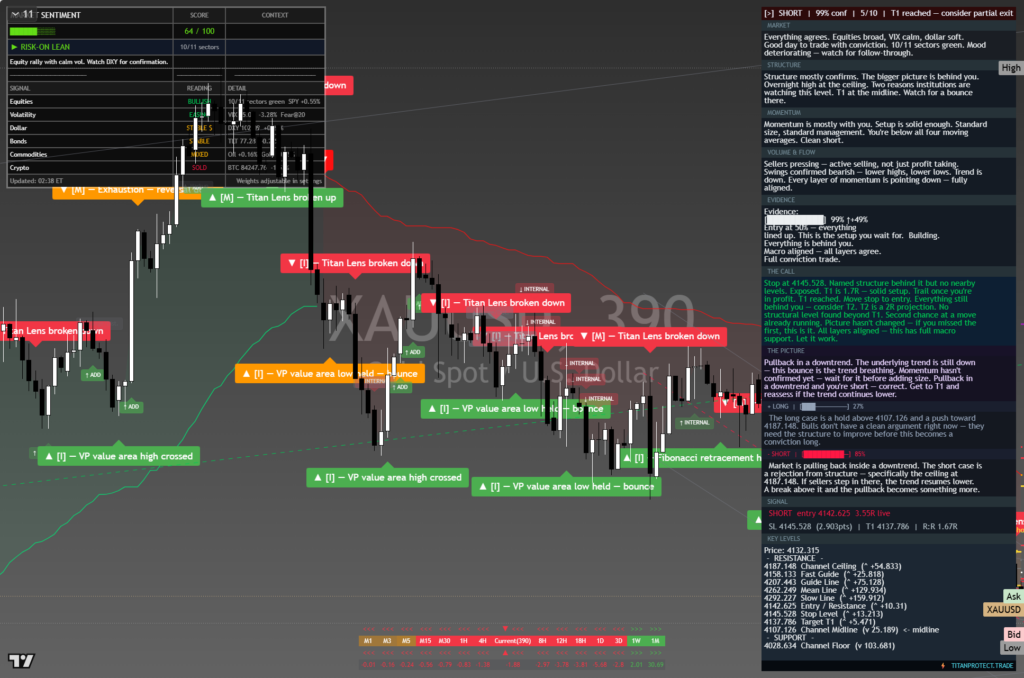
The chart above is the full daily read: structure, momentum, the levels that matter, and where the current price sits against them. Read it top to bottom for the complete picture, and pair it with our session briefs for the wider market context.
This is analysis, not financial advice. It reflects our multi-factor framework and is not a recommendation to buy or sell. Always do your own research and manage your risk.