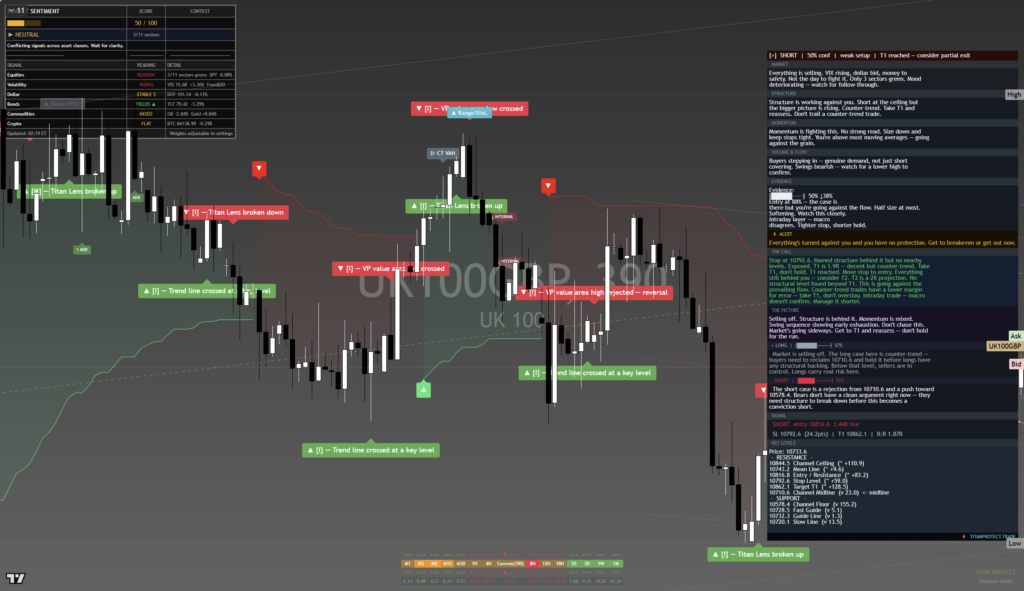
FTSE 100 (UKX) – Daily Read
25 September 2026 | Index | Titan Macro Desk
10,680.0
The FTSE 100 is caught between resilient large-cap cash flows and a less forgiving valuation backdrop, leaving the index vulnerable to further consolidation before any durable advance. Last price 10,680, 0.0 percent higher on the day, shows balance rather than conviction. It is trading in the lower half of its one-month range, while momentum roughly 0.2 percent down over the last two weeks confirms that buyers are absorbing pressure but have not regained control. The clear view is cautiously bearish below the recent peak, with defined support limiting the immediate downside.
The macro tension is between volatile energy markets, pressure from global bond yields, and a domestic policy outlook still constrained by inflation uncertainty. That combination raises financing costs and weakens the case for paying richer equity valuations. The FTSE 100 has some insulation because its multinational constituents draw heavily on overseas revenues, while energy, mining, banking, and defensive businesses can behave differently from the domestic economy. Sterling and commodity moves therefore matter alongside UK growth expectations. The Bank of England’s latest communication also keeps energy volatility and global uncertainty central to the outlook, reinforcing the importance of rates and currency conditions for UK equities ([Bank of England](https://www.bankofengland.co.uk/monetary-policy-summary-and-minutes/2026/september-2026)).
The one month average 10,717 is the first test because price is below it, and the structure reads as a downtrend, price under both its one-month and longer averages. The nearer round number handle at 10,750 sits just above that average, so reclaiming both would show that supply is being absorbed rather than merely paused. The month swing high 10,868, about 1.8 percent above the current price, is the more important ceiling because sellers previously asserted control there. Above it, the upper boundary of the three month range 10,397 to 10,990 becomes relevant.
On the downside, a shelf of support at 10,586, about 0.9 percent below, is the immediate defensive line. Buyers need to protect it to preserve the case that this is consolidation inside a broad range rather than renewed deterioration. The nearer round number handle at 10,500 provides a psychological reference beneath that shelf, but it should not be mistaken for confirmed support if selling accelerates.
The bull path is straightforward: if price recaptures 10,717, establishes acceptance above 10,750, and then clears the prior peak, a decisive move above 10,868 opens the path toward 10,990. That sequence would shift the market from repair to expansion and force cautious positioning to adjust. The bear path is equally clear: if rebounds fail beneath the average and selling reaches the shelf, losing 10,586 exposes 10,397. A failure at 10,500 along that route would reinforce the message that buyers are stepping back.
The main risk to the bearish lean is a sharp easing in bond or energy pressure, especially if accompanied by supportive sterling effects on overseas earnings. Its invalidation is sustained trade above 10,868. Conversely, support holding without recovery above 10,717 would only postpone resolution. Net, the index remains defensible but not yet strong: respect 10,586, distrust rallies below 10,750, and turn constructive only when price proves it can break the recent ceiling.
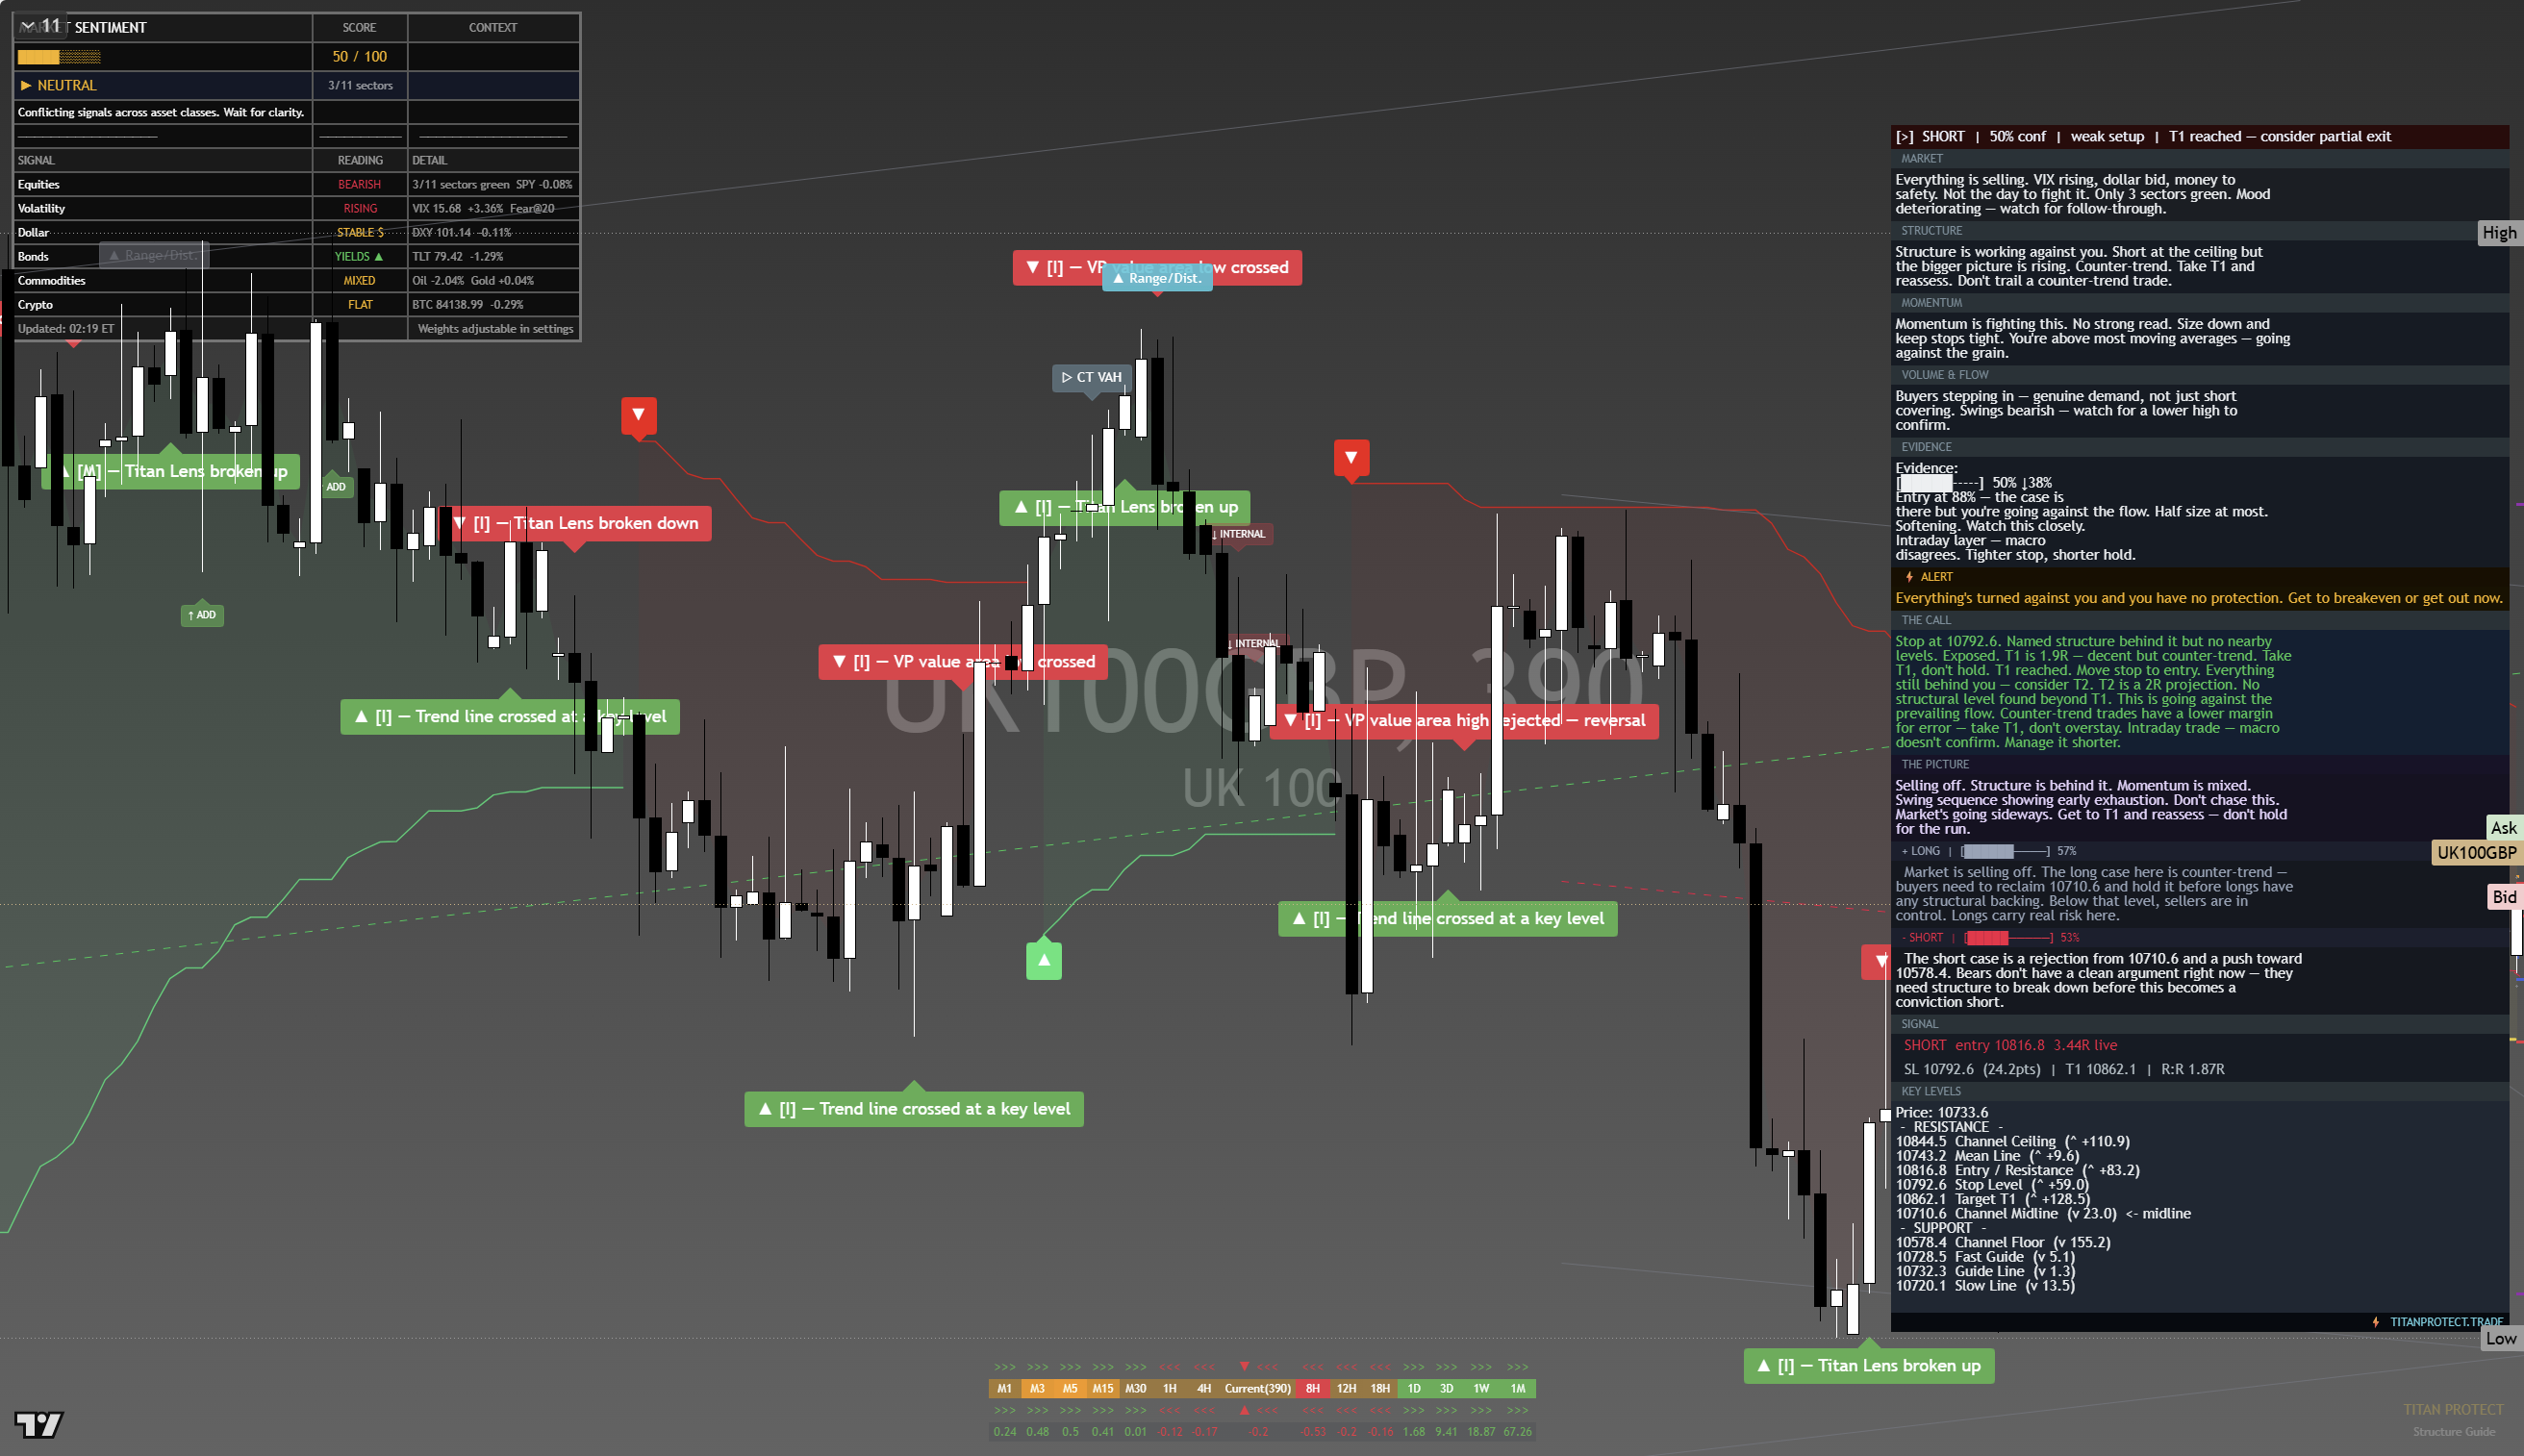
The chart above is the full daily read: structure, momentum, the levels that matter, and where the current price sits against them. Read it top to bottom for the complete picture, and pair it with our session briefs for the wider market context.
This is analysis, not financial advice. It reflects our multi-factor framework and is not a recommendation to buy or sell. Always do your own research and manage your risk.