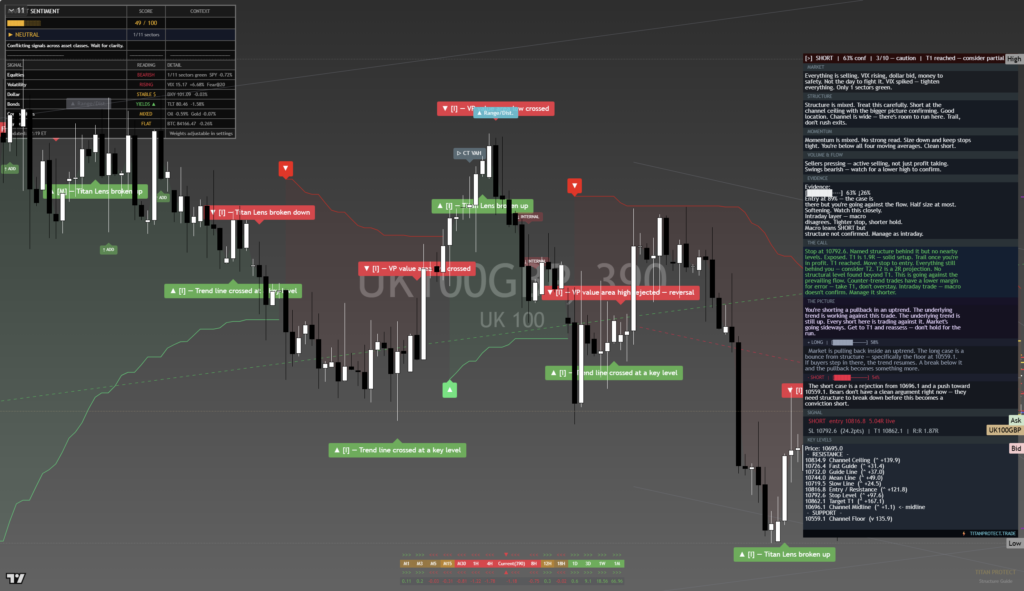
FTSE 100 (UKX) – Daily Read
24 September 2026 | Index | Titan Macro Desk
10,705.3
The FTSE 100 is consolidating rather than turning higher, and the distinction matters. Last price 10,705, 0.0 percent higher on the day, leaves the index caught between modest short-term recovery and a broader structure that still favors sellers. Momentum roughly 0.5 percent up over the last two weeks shows that demand has returned at the margin, but it has not yet repaired the underlying trend. The working view is therefore cautiously bearish while price remains beneath the main overhead barrier, with tactical upside possible but no durable reversal confirmed.
The macro backdrop is one of competing forces for UK large caps. Shifts in global growth expectations, currency sensitivity, commodity exposure and the outlook for policy all matter to an index with substantial international revenues. That mix can cushion domestic weakness, but it can also leave the market vulnerable when global risk appetite fades. The instrument-specific message is similarly mixed. It is sitting mid-range over the past month, which suggests neither side has full control. The one month average 10,726 is close enough to attract repeated tests, yet price is below it, and the structure reads as a downtrend, price under both its one-month and longer averages. Buyers have stabilized the tape, but they have not taken command.
The nearer round number handles at 10,750 and 10,500 frame the immediate contest. Reclaiming 10,750 would place price back above the one month average 10,726 and improve the tone, because sellers defending that area would have been absorbed. Failure there would reinforce the view that rebounds remain corrective. Below, 10,500 is a psychological fallback, but the more important shelf of support at 10,586, about 1.1 percent below, is where buyers must demonstrate that the recent stabilization has substance. Losing it would remove the nearest structural defense. On the upside, the month swing high 10,868, about 1.5 percent above the current price, is the decisive ceiling. The broader three month range 10,397 to 10,990 shows why these boundaries carry weight: they sit inside a well-defined balance area whose edges represent the next meaningful objectives.
The bull path is straightforward. If price reclaims 10,750, holds above the one month average 10,726 and then clears the month swing high, the market would show that supply has been absorbed rather than merely tested. A decisive move above 10,868 opens the path toward 10,990, where the upper edge of the three month range becomes the natural test. The bear path begins with rejection around the nearby overhead zone. If that rejection is followed by sustained trade beneath the support shelf, losing 10,586 exposes 10,397. That would confirm that the recent improvement lacked enough sponsorship to reverse the prevailing structure.
The principal risk to the bearish bias is a clean breakout that holds above 10,868, because that would invalidate the idea that rallies remain contained. The principal risk to the bullish path is repeated failure above 10,750 followed by support giving way. Net, the FTSE 100 is stable but not strong: buyers have earned breathing room, while sellers retain structural control until the upper barrier is decisively cleared.
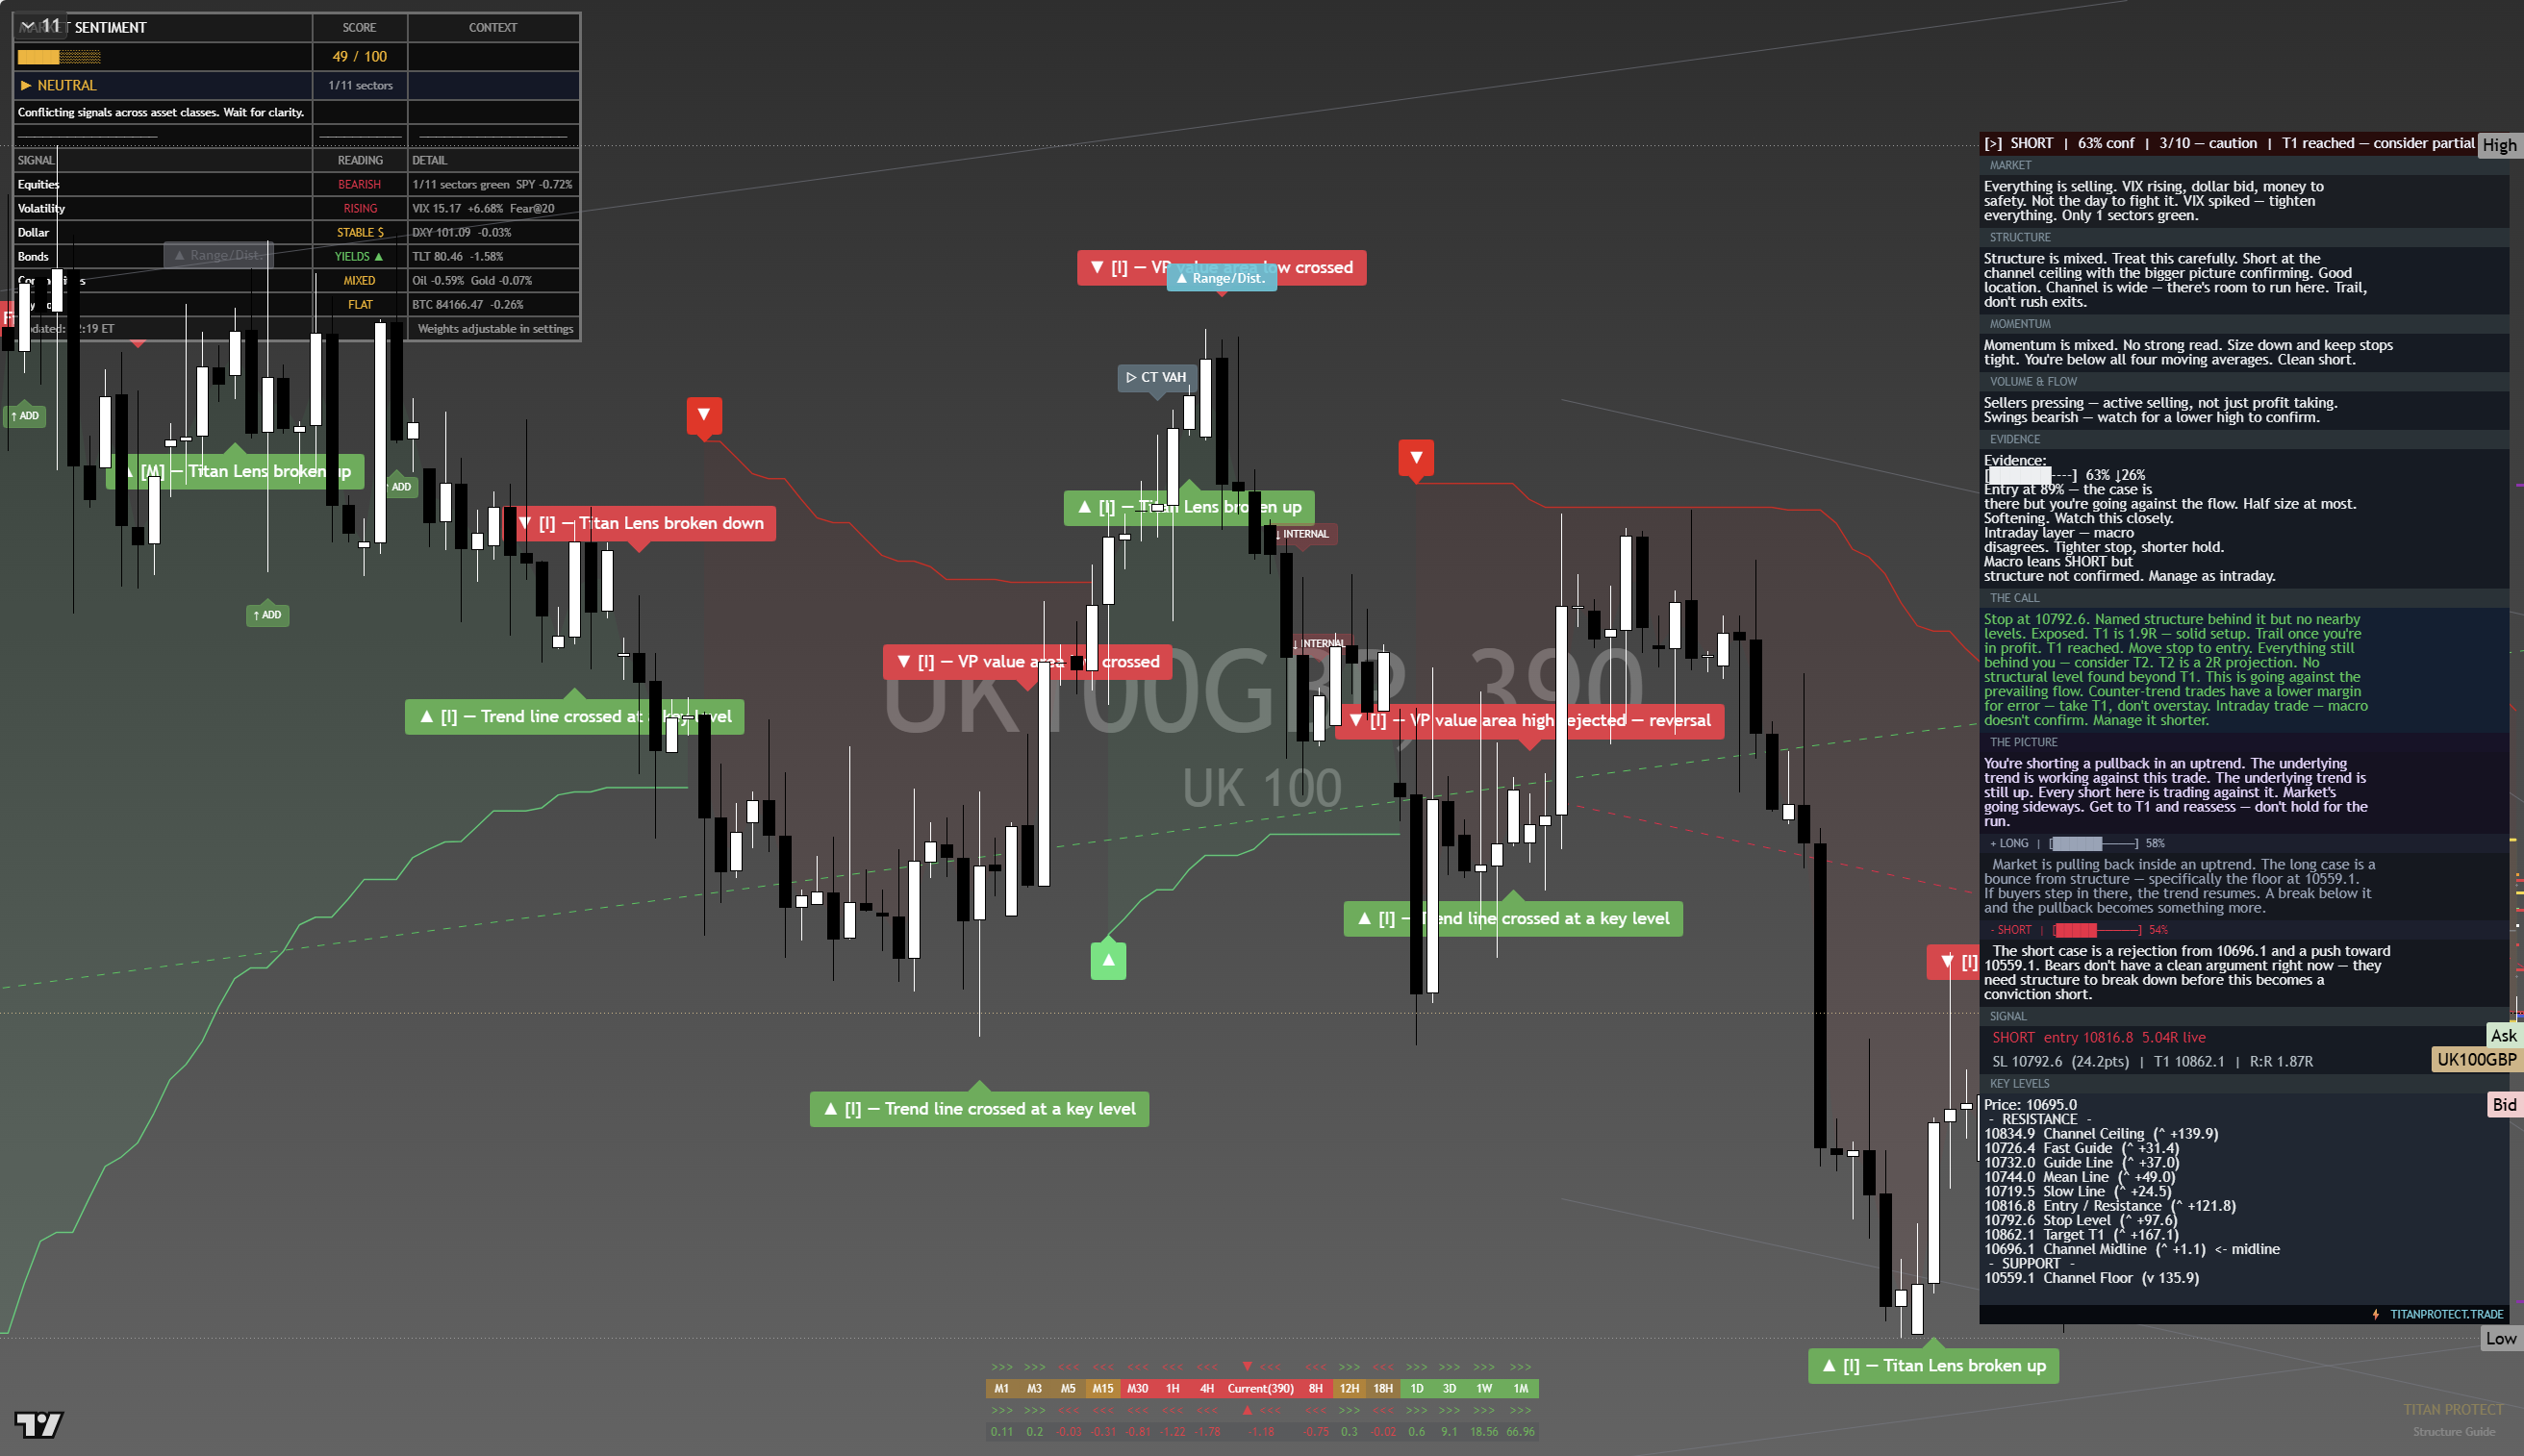
The chart above is the full daily read: structure, momentum, the levels that matter, and where the current price sits against them. Read it top to bottom for the complete picture, and pair it with our session briefs for the wider market context.
This is analysis, not financial advice. It reflects our multi-factor framework and is not a recommendation to buy or sell. Always do your own research and manage your risk.