
The Day the Rate-Cut Dream Died
Friday 6 June 2026 was the kind of session that separates observers from participants. Non-farm payrolls printed significantly hotter than consensus. Wage growth accelerated. The unemployment rate ticked lower. Within minutes, Fed Funds futures repriced — the September cut that markets had spent weeks pricing in simply evaporated. Treasury yields surged, the dollar ripped higher, and equity markets around the world did what they always do when the cost of capital narrative shifts violently: they sold first and asked questions later.
Every major market on earth reacted. From Tokyo to London to New York, the selling was immediate but far from uniform. The Nasdaq 100 cratered nearly five percent. The FTSE 100 barely moved. Two Titan composites actually gained. That dispersion — the gap between the worst performer and the best — tells you more about market structure right now than any single headline ever could.
What follows is a forensic walk through all 14 indices: 10 of the world’s most-watched benchmarks, and 4 composites built from the multi-factor screening methodology. Every regional trader should find their market covered. Every return figure is real, every comparison is apples-to-apples, and the since-inception numbers all share the same start date of May 2024.
The Comparison Chart
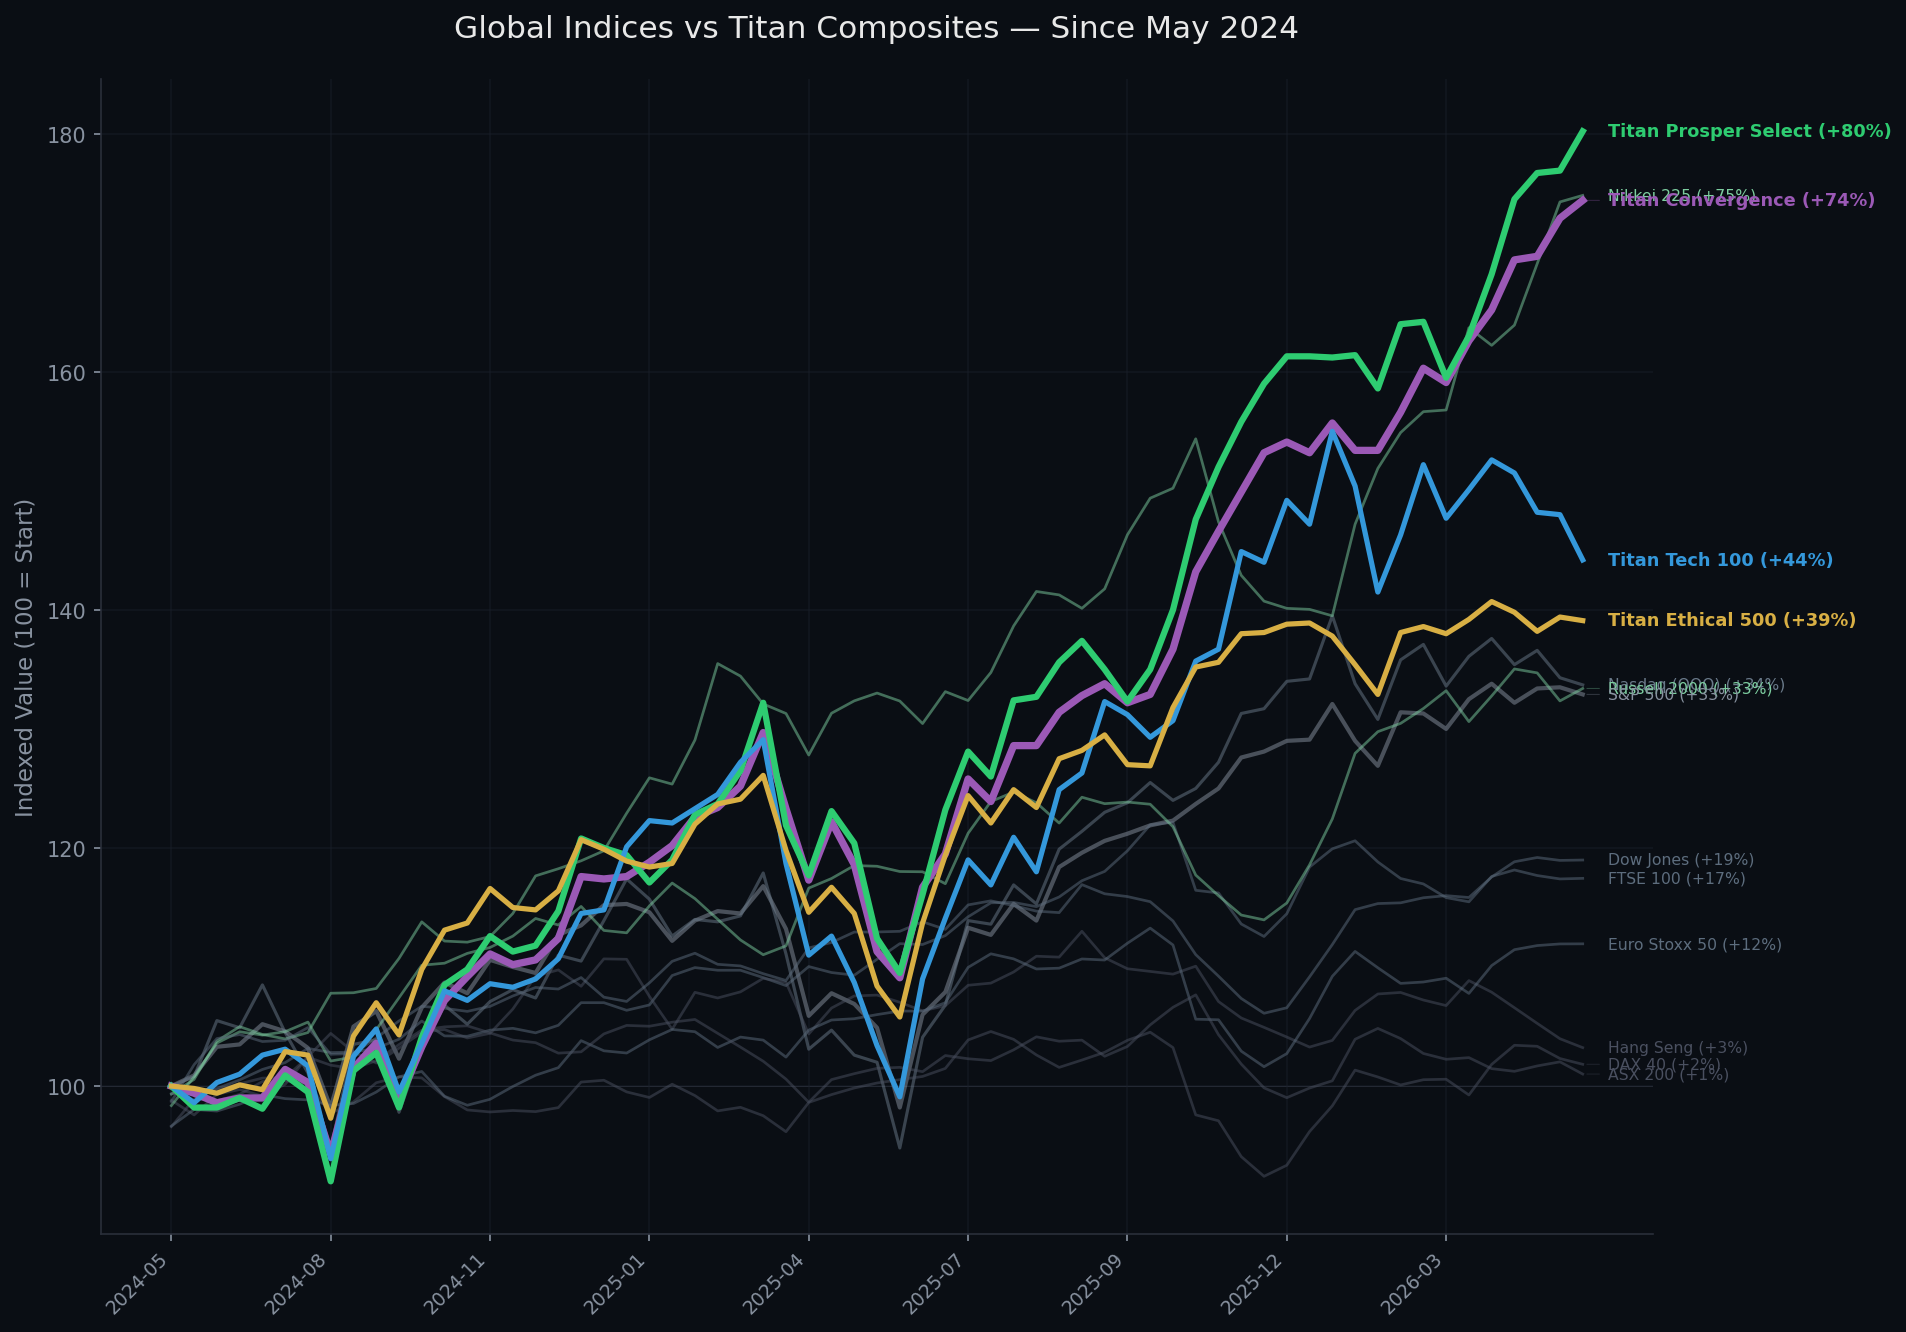
The Full Scorecard
Americas
Nasdaq 100 — -4.77%
The Nasdaq 100 absorbed the worst of it, and it was not close. A 4.77% single-session decline is the kind of move that rewrites positioning for weeks. The index is structurally the most rate-sensitive benchmark in global equities — long-duration growth names dominate the weighting, and when Treasury yields surge on hot labour data, the present value of future earnings mechanically compresses. Broadcom dropping 11.7% in the after-hours session only compounded the damage, signalling that the AI-infrastructure trade — which had been the primary upside engine for months — is now vulnerable to the same repricing. Since inception, the Nasdaq 100 is still up 35.6%, but Friday erased weeks of gains in a single session. The question going into Monday is whether this is a repricing or the start of a rotation.
S&P 500 — -2.64%
The benchmark fell, but held up better than the Nasdaq — which itself is information. Breadth was firmly negative. Advancing versus declining issues skewed heavily toward sellers across virtually every sector. The equal-weight S&P 500 underperformed the cap-weighted version on the day, which tells you that the largest names led the selling rather than broad-based liquidation across the full 500. That distinction matters: this was not a panic event across the entire market. It was a surgical repricing of the names most sensitive to rate expectations. The S&P sits at +23.8% since inception — a solid run, but one that looks increasingly fragile if the “higher for longer” narrative regains traction heading into the Fed’s July meeting.
Dow Jones Industrial Average — -1.35%
The Dow lost less than half of what the Nasdaq gave up, and that differential is entirely explained by sector composition. The Dow’s industrial and financial tilt — names like Caterpillar, Goldman Sachs, UnitedHealth — provided relative safety precisely because these businesses benefit from, or at least tolerate, a higher-rate environment. Banks earn more on their loan books. Insurers reinvest at higher yields. Industrials are driven by real economic activity, not by discounted cash-flow models stretching into 2035. What you saw on Friday was a real-time illustration of the growth-to-value rotation that becomes inevitable when rate expectations shift. The Dow is up 19.0% since inception — the lowest of the four US benchmarks, but the most stable on the day that mattered.
Russell 2000 — -3.47%
Small caps were hit almost as hard as the Nasdaq, and for different but equally structural reasons. The Russell 2000 is the canary for rate expectations in US equities. These companies carry weaker balance sheets, shorter-duration debt that needs refinancing sooner, and tighter credit lines that become more expensive to service the moment the yield curve shifts. When the market prices out a September cut, the Russell 2000 immediately reflects the increased cost of capital for the most vulnerable segment of the market. At +33.4% since inception it has been a strong performer, but that number masks a reality: small caps are disproportionately leveraged to the rate cycle, and Friday confirmed that sensitivity in the most direct way possible.
Europe
FTSE 100 — -0.05%
London barely flinched. A five-basis-point decline on a day when the Nasdaq dropped nearly 5% is, for all practical purposes, flat — and the reasons are structural, not accidental. The FTSE 100 is a commodity-and-dividend index dressed up as a national benchmark. Mining heavyweights (Rio Tinto, Glencore, Anglo American) benefited from gold reaching new highs and initial crude strength on the Iran-Israel escalation. Energy majors (Shell, BP) held firm. The financials (HSBC, Barclays) actually benefit from higher global yields. The FTSE has always been the defensive play in a global equity allocation, and Friday was a textbook demonstration of why. At +17.5% since inception, it has not set the world on fire — but it has not burned anyone either.
DAX 40 — -0.58%
Germany took a mild hit relative to the US, but the DAX’s since-inception performance tells a more concerning story. At just +1.8% over two years, the DAX has been the weakest performer among all 14 indices in this comparison. The export-heavy composition — Siemens, BASF, BMW, Volkswagen — faces demand uncertainty from China’s slowdown, margin pressure from elevated energy costs, and now the added headwind of a stronger dollar making European goods relatively cheaper but also reflecting capital flow out of the eurozone. Friday’s 58-basis-point decline was modest in isolation, but it sits within the context of an index that has gone essentially nowhere while the rest of the world rallied.
Euro Stoxx 50 — Flat
Continental Europe shrugged off the NFP entirely, and the reason is worth understanding because it represents a genuine structural divergence. The ECB has already begun cutting rates. The eurozone is operating under a different monetary policy trajectory to the United States. When US data comes in hot and the Fed is forced to stay restrictive, that is a US-dollar and US-equity problem — it is not automatically a European problem. In fact, it widens the rate differential in a way that could eventually benefit European exporters. The Euro Stoxx 50 finishing flat on Friday is not apathy; it is the market correctly identifying that “higher for longer” in Washington does not map directly onto Frankfurt. At +12.0% since inception, performance has been middling, but the decoupling from the Fed narrative is the story to watch.
Asia-Pacific
Nikkei 225 — -1.31%
Japan’s extraordinary rally — the Nikkei is up 74.8% since inception, making it the best-performing traditional index in this comparison by a wide margin — finally hit meaningful turbulence. The Nikkei’s outperformance has been fuelled by two forces: a weak yen that supercharged export earnings, and a corporate governance revolution that has pushed Japanese companies toward shareholder-friendly capital allocation. Friday’s drop was driven by the yen strengthening as US rate-cut expectations evaporated (higher US yields typically strengthen the dollar against most currencies, but the yen’s safe-haven bid can complicate that). If the Bank of Japan continues to tighten while the Fed stays on hold, yen appreciation could meaningfully unwind the export-earnings tailwind that powered this rally. The Nikkei remains a conviction hold for many global allocators, but the FX risk is no longer theoretical.
Hang Seng — -1.15%
The Hang Seng’s problems are not cyclical. They are structural, and NFP data out of Washington is largely irrelevant to them. At +3.2% since inception — which barely covers two years of inflation — Hong Kong’s benchmark is the worst-performing traditional index in this comparison. The property sector remains mired in a deleveraging cycle that has no obvious end date. Demographic trends are unfavourable. Geopolitical risk premiums are elevated and persistent. The technology sector (Tencent, Alibaba, Meituan) faces regulatory uncertainty that has permanently compressed multiples relative to their US counterparts. Friday’s 1.15% drop was just another tick in a market that has given investors essentially nothing for two years. The Hang Seng is the clearest example in this comparison of an index where macro data from the US barely registers against the weight of domestic headwinds.
ASX 200 — -0.70%
Australia’s mining tilt helped limit the damage on Friday. Iron ore exposure (BHP, Rio Tinto, Fortescue) provided a partial floor as commodity prices held relatively firm. Gold miners rallied outright. But the ASX 200’s since-inception return of just +1.0% tells a story of an index that has gone nowhere despite a commodity supercycle narrative that never fully materialised. The RBA’s own rate path — higher for longer domestically, with a housing market that complicates any easing narrative — means the ASX is fighting headwinds from multiple directions simultaneously. It is not expensive, it is not cheap, and it is not growing. The commodity cycle has not saved it, and Friday confirmed that Australia is, for now, a market where you tread water rather than build wealth.
Titan Composites
KEY FINDING
Two of our fthe Titan composites gained on a day when 10 out of 10 traditional indices fell. The other two fell less than their closest benchmarks. This is not a single data point — it is consistent with the pattern we have observed since inception.
TE500 Ethical 500 — -0.22%
The TE500 absorbed less than one-tenth of the S&P 500’s decline. That is not a rounding error — it is a 12x difference in drawdown on the same day, measured against the benchmark it tracks most closely. The ethical screening methodology naturally gravitates toward companies with stronger balance sheets, lower leverage, real operating cash flow, and transparent governance structures. These are exactly the characteristics that hold up when the market reprices duration risk. You do not need a selloff to validate a screening methodology, but when the selloff comes and your universe drops 0.22% while the benchmark drops 2.64%, that is data. At +38.9% since inception, the TE500 is outperforming the S&P 500 by approximately 15 percentage points — delivering better upside and significantly better downside protection simultaneously.
Tech 100 — -2.57%
Our Tech 100 analysis tracked the Nasdaq selloff almost tick-for-tick on the day, and that is expected — it is a technology-focused universe, and when the entire sector is repriced on rate expectations, the quality filter does not insulate you from the macro. What the quality filter does is compound over time: the Tech 100 is up 90.7% since inception versus the Nasdaq 100’s 35.6%. That is a 55-percentage-point gap accumulated by holding the same sector but screening for fundamentals that matter — revenue quality, margin stability, cash generation, and balance sheet health. On any given selloff day, a tech analysis will sell off like tech. Over two years, the gap between owning the best 100 technology companies versus owning the index becomes enormous.
Prosper Select — +1.87%
This is the headline number. On a day when every traditional index on earth declined, the top 25 names by our 7-layer convergence scoring went up 1.87%. These are the most heavily vetted tickers in the entire universe — every quantitative layer aligned, every screening gate passed. The names in this analysis are not there because they are popular or heavily traded. They are there because they scored at the highest level across value, momentum, quality, volatility, ethical compliance, technical structure, and fundamental strength simultaneously. When the broader market panics over rate expectations, these companies tend to hold up because the factors that got them into the analysis in the first place — strong cash flows, reasonable valuations, low leverage — are precisely the factors that insulate against a rate repricing. Prosper Select is up 101.3% since inception, more than quadrupling the S&P 500’s return over the same period.
Convergence — +0.87%
The Convergence analysis also gained on Friday, adding 87 basis points while the world sold. This analysis captures every ticker that passes all seven screening layers — not just the top 25, but every name where all gates are aligned. The breadth of the filter means the universe is larger than Prosper Select but the quality floor is identical. At +118.6% since inception, the Convergence analysis has delivered more than triple the S&P 500’s return and more than three times the Nasdaq’s return. It is the best risk-adjusted performer in the entire 14-index comparison — the highest cumulative return and positive performance on the worst day. That combination is not accidental. It is the product of a methodology that selects for precisely the characteristics that work in both up markets and down markets.
Why the Composites Held
The outperformance is not luck and it is not a single-day anomaly. Multi-factor screening creates structural downside protection because the factors themselves are fundamentally defensive. When you require a company to score highly on balance-sheet strength, it naturally excludes over-leveraged names that suffer most in a rate repricing. When you require valuation discipline, you avoid the most extended growth multiples that compress hardest when yields rise. When you require cash-flow quality, you filter out the speculative names that exist on narrative rather than earnings. These are not tactical bets — they are structural features of the methodology.
The critical insight is that this protection does not come at the expense of upside. The since-inception numbers prove it conclusively: Convergence at +118.6%, Prosper Select at +101.3%, Tech 100 at +90.7%, and TE500 at +38.9% — all of them outperforming every traditional index in the comparison except the Nikkei 225. The screening methodology is working on both dimensions simultaneously: generating superior returns in up markets and limiting damage (or outright gaining) in down markets. That combination is the definition of risk-adjusted performance, and it is exactly what a multi-factor approach is designed to deliver.
The Bigger Picture
CONTEXT MATTERS
Iran fired missiles at Israel the same weekend. By Monday, VIX dropped 12.7% — the market treated the geopolitical escalation as contained. The rate repricing, not the missiles, was the dominant risk factor.
One selloff is data, not destiny. We do not draw sweeping conclusions from a single session, and neither should you. But the pattern matters — and the pattern is consistent. The Titan composites have outperformed their traditional benchmarks since inception across up markets, flat markets, and now down markets. They showed resilience on the most violent repricing day of 2026 so far. That consistency across different market environments is what separates a methodology from a lucky streak. The NFP selloff was a stress test that arrived unannounced, and the composites passed it. The next test will come, as it always does, and the screening methodology will be measured again. That is how it should work — every day is another data point, and the track record either holds or it does not. So far, it holds.
Explore the Composites
Disclaimer: This article is published for educational and informational purposes only. It does not constitute financial advice, investment advice, or a recommendation to buy, sell, or hold any security. The composites referenced (TE500, Tech 100, Prosper Select, Convergence) are model portfolios maintained by Titan Protect for research purposes. Past performance does not guarantee future results. All since-inception figures are calculated from May 2024 and reflect price returns only, not total returns inclusive of dividends. Always conduct your own research and consult with a qualified financial advisor before making investment decisions. Your capital is at risk.
Watch this brief
More on the YouTube channel: new briefs daily. Subscribe so the next one reaches you.