
The DXY Framework Journal for May 2026, newest read at the top. Each dated entry is our read on the close, kept as a living record so the framework can be judged over time. This is analysis, not financial advice.
Saturday 30 May 2026
Dollar Index (DXY) — Daily Read | Saturday 30 May 2026
Dollar Index (DXY) | Post Close Setup Daily Read | Data basis: 2026-05-30 close
Where It Sits
Structure
Structurally Dollar Index (DXY) has pulled back into the session close. The broader trend remains intact on the daily timeframe but the shorter timeframe has softened. The structure is contested near the 98.8730 level.
Momentum
Momentum is neutral with internal readings near the centre of the range. That is the signature of a market digesting the prior move. The tape needs a fresh catalyst to commit to direction.
Volume & Flow
Volume data is limited for this session. The positioning read is neutral — no obvious skew in either direction. Watch for flow confirmation on the next session.
Key Levels
| Level | Type | Significance | Action Zone |
|---|---|---|---|
| 99.53 | Resistance | Upper range target, prior supply zone | Take profits / fade if rejected |
| 99.09 | Pivot | Mid-range continuation marker | Hold = constructive; lose = consolidation |
| 98.87 | Session close | Reference anchor for next session | Above = continuation; below = mean revert |
| 98.53 | Support | Recent range floor, demand zone | Buy zone with defined stop |
| 98.09 | Major support | Prior breakout retest level | Stop-out below for longs |
Three Scenarios
Continuation
Dollar Index (DXY) holds the session close at 98.8730 and pushes lower on continued positioning flow. The broader trend remains intact. Watch the dollar tape for confirmation.
Range
Dollar Index (DXY) opens flat and ranges around 98.8730. Neither side has conviction without a fresh data catalyst. Range trade dominates.
Mean Reversion
Dollar Index (DXY) breaks below support on a shift in dollar positioning. Mean reversion within the broader trend. Watch for a clean test of support before committing.
Risk Score
Risk sits at Around 50%
Risk sits around 50 per cent. Vix at 15.4 supports a measured risk posture. sentiment at 61 is in greed territory. Currency pairs carry intervention and data-release headline risk. Standard sizing with defined stops — discipline beats conviction.
How to Walk It
Entry / Stop / Target structure:
- Long 98.53 pullback | Stop 98.09 | Target 99.09 | R:R 2:1
- Long 99.09 breakout | Stop 98.87 | Target 99.53 | R:R 1.5:1
- Fade 99.53 rejection | Stop above resistance | Target 98.87 | R:R 2:1
Experience-level guidance:
Beginner: Reduce size to half your standard. Trade only the cleanest setup from the entries above. If the tape opens against your bias, do nothing — wait for the second hour, when the institutional flow has tipped its hand.
Intermediate: Use the levels table to define the trading range. Fade the extremes with defined stops, take profits before the round-number resistance levels.
Advanced: The vol regime supports defined-risk structures around the key pivot levels. Keep notional small relative to your book — asymmetric speculation, not core positioning.
Continue Reading
The macro frame driving this read is unpacked in the session briefs:
Check the latest session briefs on the site.
This analysis is for educational and informational purposes only. It does not constitute financial advice. Always manage your risk independently and in accordance with your own financial circumstances.
Thursday 28 May 2026
USD/JPY — Daily Framework Read | Thursday 28 May 2026
USD/JPY | Post Close Setup Daily Read | Data basis: 2026-05-28 close
Where It Sits
Structure
Structurally USD/JPY sits above its short-term moving averages with the daily trend firmly higher. The recent advance has been orderly with no signs of distribution or topping behaviour. The reference anchor at 159.24 acts as the bias line.
Momentum
Momentum is neutral with internal readings near the centre of the range. That is the signature of a market digesting the prior move. The tape needs a fresh catalyst to commit to direction.
Volume & Flow
Volume data is limited for this session. The positioning read is neutral — no obvious skew in either direction. Watch for flow confirmation on the next session.
Key Levels
| Level | Type | Significance | Action Zone |
|---|---|---|---|
| 160.06 | Resistance | Upper range target, prior supply zone | Take profits / fade if rejected |
| 159.51 | Pivot | Mid-range continuation marker | Hold = constructive; lose = consolidation |
| 159.24 | Session close | Reference anchor for next session | Above = continuation; below = mean revert |
| 158.80 | Support | Recent range floor, demand zone | Buy zone with defined stop |
| 158.25 | Major support | Prior breakout retest level | Stop-out below for longs |
Three Scenarios
Continuation
USD/JPY holds the session close at 159.24 and pushes higher on continued positioning flow. The broader trend remains intact. Watch the dollar tape for confirmation.
Range
USD/JPY opens flat and ranges around 159.24. Neither side has conviction without a fresh data catalyst. Range trade dominates.
Mean Reversion
USD/JPY breaks below support on a shift in dollar positioning. Mean reversion within the broader trend. Watch for a clean test of support before committing.
Risk Score
Risk sits at Around 50%
Risk sits around 50 per cent. Vix at 15.7 supports a measured risk posture. sentiment at 60 is in greed territory. Currency pairs carry intervention and data-release headline risk. Standard sizing with defined stops — discipline beats conviction.
How to Walk It
Entry / Stop / Target structure:
- Long 158.80 pullback | Stop 158.25 | Target 159.51 | R:R 2:1
- Long 159.51 breakout | Stop 159.24 | Target 160.06 | R:R 1.5:1
- Fade 160.06 rejection | Stop above resistance | Target 159.24 | R:R 2:1
Experience-level guidance:
Beginner: Reduce size to half your standard. Trade only the cleanest setup from the entries above. If the tape opens against your bias, do nothing — wait for the second hour, when the institutional flow has tipped its hand.
Intermediate: Use the levels table to define the trading range. Fade the extremes with defined stops, take profits before the round-number resistance levels.
Advanced: The vol regime supports defined-risk structures around the key pivot levels. Keep notional small relative to your book — asymmetric speculation, not core positioning.
Continue Reading
The macro frame driving this read is unpacked in the session briefs:
Check the latest session briefs on the site.
This analysis is for educational and informational purposes only. It does not constitute financial advice. Always manage your risk independently and in accordance with your own financial circumstances.
Thursday 28 May 2026
USD/JPY — Daily Framework Read | Thursday 28 May 2026
USD/JPY | Pre Asia Setup Daily Read | Data basis: 2026-05-28 close
Where It Sits
Structure
Structurally USD/JPY sits above its short-term moving averages with the daily trend firmly higher. The recent advance has been orderly with no signs of distribution or topping behaviour. The reference anchor at 159.50 acts as the bias line.
Momentum
Momentum is neutral with internal readings near the centre of the range. That is the signature of a market digesting the prior move. The tape needs a fresh catalyst to commit to direction.
Volume & Flow
Volume data is limited for this session. The positioning read is neutral — no obvious skew in either direction. Watch for flow confirmation on the next session.
Key Levels
| Level | Type | Significance | Action Zone |
|---|---|---|---|
| 159.68 | Resistance | Upper range target, prior supply zone | Take profits / fade if rejected |
| 159.56 | Pivot | Mid-range continuation marker | Hold = constructive; lose = consolidation |
| 159.50 | Session close | Reference anchor for next session | Above = continuation; below = mean revert |
| 159.40 | Support | Recent range floor, demand zone | Buy zone with defined stop |
| 159.28 | Major support | Prior breakout retest level | Stop-out below for longs |
Three Scenarios
Continuation
USD/JPY holds the session close at 159.50 and pushes higher on continued positioning flow. The broader trend remains intact. Watch the dollar tape for confirmation.
Range
USD/JPY opens flat and ranges around 159.50. Neither side has conviction without a fresh data catalyst. Range trade dominates.
Mean Reversion
USD/JPY breaks below support on a shift in dollar positioning. Mean reversion within the broader trend. Watch for a clean test of support before committing.
Risk Score
Risk sits at Around 50%
Risk sits around 50 per cent. Vix at 16.3 supports a measured risk posture. sentiment at 61 is in greed territory. Currency pairs carry intervention and data-release headline risk. Standard sizing with defined stops — discipline beats conviction.
How to Walk It
Entry / Stop / Target structure:
- Long 159.40 pullback | Stop 159.28 | Target 159.56 | R:R 2:1
- Long 159.56 breakout | Stop 159.50 | Target 159.68 | R:R 1.5:1
- Fade 159.68 rejection | Stop above resistance | Target 159.50 | R:R 2:1
Experience-level guidance:
Beginner: Reduce size to half your standard. Trade only the cleanest setup from the entries above. If the tape opens against your bias, do nothing — wait for the second hour, when the institutional flow has tipped its hand.
Intermediate: Use the levels table to define the trading range. Fade the extremes with defined stops, take profits before the round-number resistance levels.
Advanced: The vol regime supports defined-risk structures around the key pivot levels. Keep notional small relative to your book — asymmetric speculation, not core positioning.
Continue Reading
The macro frame driving this read is unpacked in the session briefs:
Check the latest session briefs on the site.
This analysis is for educational and informational purposes only. It does not constitute financial advice. Always manage your risk independently and in accordance with your own financial circumstances.
Tuesday 26 May 2026
The Dollar Index is the story that explains everything else on this FX read sheet. DXY has been in a controlled, sustained decline, and this week it made another leg lower. The framework has been reading Dollar weakness for several weeks now, and the price action continues to validate that assessment. The Dollar is not collapsing; it is grinding. And a grinding, orderly decline is often harder to trade against than a sharp crash because it keeps giving the impression of being “oversold” while continuing to move in one direction.
The structure this week showed a clear rejection at a key resistance zone, the same area that had previously acted as support during the Dollar’s stronger phase. The failure to reclaim that area on multiple tests is significant. It tells you that what was once a floor has now become a ceiling. The rotation away from Dollar assets has been steady, and FX markets have been the clearest expression of that. EUR, GBP, AUD, and NZD have all benefited in lockstep with the Dollar’s decline, which confirms this is a macro theme rather than idiosyncratic pair-by-pair movement.
The critical zone to watch on DXY is the 98.50 to 99.00 area. A weekly close below 99.00 would be a meaningful signal that the next leg lower is in progress. The 97.00 handle is the downside target if that scenario plays out. A bounce back above 100.50 to 101.00 on the other hand would be an early warning sign that the Dollar decline is pausing and FX pairs built on Dollar weakness need to be reassessed.
| Level | Price | Notes |
|---|---|---|
| Resistance | 100.50 – 101.20 | Flipped resistance, prior support zone |
| Current Close | 99.32 | Below key zone, structurally weak |
| Support 1 | 98.50 – 99.00 | Weekly demand test level |
| Downside Target | 97.00 | Measured move, multi-year demand zone |
| Bullish Reversal | Above 101.20 | Would invalidate near-term bearish thesis |
The weak Dollar theme is well-established and the structural picture supports continuation. The risk score sits at a moderate level because the Dollar is approaching a zone where a counter-trend bounce becomes increasingly plausible. Markets rarely move in one direction without periodic retracements, and at these levels, any positive US data surprise or hawkish Fed commentary can trigger a sharp short-covering rally. The bank holiday weekend amplifies this, as thin liquidity can exaggerate any Dollar bounce before buyers in EUR and GBP have a chance to respond.
The DXY read is the lens through which all other FX trades should be filtered this weekend. If you hold positions in EUR/USD, GBP/USD, AUD/USD, or NZD/USD, your risk is partly a DXY risk. A sharp bounce in the Dollar on thin Monday liquidity would hit all of those positions simultaneously. The prudent approach is to ensure your aggregate FX exposure is sized for a scenario where the Dollar bounces 1 to 1.5% from current levels. That is not a prediction; it is position management. Know your total dollar-short exposure before the weekend closes.
Saturday 23 May 2026
US Dollar Index (DXY) — Weekend Daily Read
Framework Bias
SHORT BIAS (USD)
The DXY at 99.32 is sitting in a critical area. The 100 level is the line that separates dollar strength from dollar weakness in the minds of global macro traders. The index has been trading below 100 for several weeks now, which is a significant shift from the 104-plus levels seen earlier in 2026. That shift has driven broad strength in gold, commodities priced in dollars, and emerging market currencies.
Friday’s 0.13% uptick to 99.32 is a minor rebound within the broader downtrend. It does not change the bias. The dollar has been weakening because the market is pricing in Fed cuts and because the Moody’s downgrade raised questions about the structural attractiveness of dollar assets. Neither of those factors disappears over a bank holiday weekend.
The framework bias is short dollar. That does not mean buy USD shorts here; it means when analysing any USD-quoted instrument (gold, oil, commodities, EM currencies), tilt your interpretation toward the scenario where dollar weakness is the tailwind rather than the headwind.
Key Levels
| Level Type | Price | Note |
|---|---|---|
| Key Resistance | 100.00 | Round number and psychological dividing line |
| Near Resistance | 99.41 | Friday session high |
| Current Price | 99.32 | Friday close |
| Near Support | 99.17 | Friday session low |
| Key Support | 98.50 | Prior weekly low and bear target |
| Major Support | 97.00 | Multi-year structural demand and bear extension |
Trade Framework
| Scenario | Entry Zone | Stop | Target | R:R |
|---|---|---|---|---|
| Short DXY at resistance (long EUR/GBP vs USD) | 99.80 to 100.00 | 100.40 | 98.50 | approx 2.5:1 |
| Short on 99.17 support break | 99.10 | 99.50 | 98.00 | approx 2.75:1 |
| Long DXY (risk-off reversal) | 97.00 to 97.50 | 96.50 | 99.50 | approx 4.0:1 |
Confidence level: around 63% on short dollar. The structural and flow picture favours continued dollar softness. The 63% reflects the risk of a short-covering bounce into the long weekend and the possibility that the US fiscal picture produces a demand-for-safety dollar bid. The 100 level is the key: hold below it, and the short thesis remains valid.
Weekend Context
The DXY is the single most important variable for understanding global asset prices right now. A weak dollar is why gold is at $4,521. It is why EM currencies have recovered. It is why commodities are holding up despite demand uncertainty. If the dollar recovers and DXY pushes back above 100 on a sustained basis, you will see reversal signals across all of those asset classes simultaneously.
The key fundamental driver to watch is US fiscal policy. The market’s patience with dollar weakness is partly premised on the assumption that the Fed will eventually cut rates. If the Fed signals it is not in a hurry, the rate differential narrative that currently favours EUR and GBP over USD would be challenged.
For practical purposes over the weekend, the DXY is your macro compass. Track its Monday Asian-session movements as a leading indicator for how risk assets will behave when the full market reopens on Tuesday. A sustained DXY push above 99.50 on Monday would be a warning sign for gold and commodities traders.
Friday 22 May 2026
FX | Friday 22 May 2026
DXY: The Dollar Index Is Pinned Below 100 and the Whole Market Knows It
Thursday close: 99.23 | Daily change: +0.04% | Bias: Neutral, Ceiling Dominant
Current Read
The dollar index has been trading below 100 for most of May and Thursday was another day of it sitting just below that level. Four basis points up. That is not dollar strength, that is a market that cannot quite commit to selling the dollar either. The 100 level has become the centre of gravity for the index, attracting price without producing a decisive break in either direction.
The fundamental story driving the dollar lower from its 2025 peaks remains intact. The US fiscal position has deteriorated, the Fed is no longer the most aggressive central bank in the room relative to expectations, and dollar-denominated assets have seen positioning reduce as global investors seek diversification. None of that changes on a single Friday.
What the DXY is showing at 99.23 is a market in indecision. Below 100, sellers maintain the narrative advantage. But the pace of the decline has slowed dramatically from the sharp moves seen in March and April. That deceleration suggests either that a bottom is forming or that the next leg lower requires a fresh catalyst that has not yet arrived.
Key Levels
What Changed Thursday
US PMI data came in marginally above expectations, which provided the four-basis-point bid. The market’s reaction was muted relative to what a data beat of this kind would have produced earlier in the year. That in itself is informative: the market is not particularly keen to buy the dollar even when given a reason to.
Weekly jobless claims were in line. No Federal Reserve speakers added anything meaningful. The brief dollar bid was absorbed by afternoon, and the index closed with a marginal gain that leaves the technical picture completely unchanged. DXY remains below its 100 ceiling, and that is what matters going into Friday.
Friday Scenarios
Dollar Bear Case
DXY fails another test at 99.50 and dips toward 98.70. Risk assets would benefit from this outcome. Gold, EUR/USD, and GBP/USD would all be supported. Requires either weak US data, dovish Fed commentary, or a general risk-on bid that reduces dollar demand as a safe haven.
Base Case
Index drifts between 98.90 and 99.50 through a quiet Friday session. The 100 ceiling remains intact, the index stays below it, and nothing changes for the weekly picture. Most likely outcome given the absence of major catalysts.
Dollar Bull Case
A clean break above 100 would be the week’s most significant dollar development. This would require a meaningful catalyst, whether that is a risk-off shock, strong US data, or a significant Fed speaker. A close above 100 changes the narrative from “dollar ceiling” to “dollar recovering” and would put immediate pressure on all major pairs.
What the Dollar Does to Everything Else
The DXY is not just a standalone instrument; it is the thermometer for the entire FX market and, to a significant extent, for commodities priced in dollars. Gold at $4,530 is partly where it is because the dollar is below 100. Crude near $97 is partly explained by the same dynamic. If the dollar finds conviction above 100, those commodity prices face headwinds even if the underlying supply and demand picture has not changed.
For traders across all markets on Friday, the DXY print at the New York open is the first thing to watch. It sets the tone for everything else.
Cross-References
- Gold: Inverse relationship. DXY above 100 puts $4,500 support under pressure.
- EUR/USD: Euro is 57% of the DXY weighting. If EUR/USD moves, the index follows almost directly.
- Crude Oil: Dollar-denominated commodity. Dollar strength caps the oil rally approaching $100.
- USD/JPY: The pair climbing toward 160 adds upward pressure to the index. An intervention event would be a significant DXY negative.
Sunday 17 May 2026
—
title: “DXY Weekly Review : 16 May 2026”
date: “2026-05-16”
instrument: “DXY”
type: ticker-review
—
Weekend Ticker Review | 16 May 2026
DXY : The Conductor. Every Instrument This Week Played to Its Score.
DXY | US Dollar Index | 12-16 May 2026
1. Week at a Glance
| Friday Close | 99.27 |
| Friday Move | +0.39% |
| Trigger | Hot US retail sales removed rate-cut expectations |
| DXY Futures | Premium to theoretical carry : speculative demand pre-built |
| Support | 98.80 : master switch for all non-USD trades |
| Resistance | 100.20 |
| Regime | US exceptionalism : capital repatriation flow structural |
| Signal | BULLISH : structural, multi-factor, institutionally pre-built |
2. What Happened
DXY gained 0.39% to close at 99.27. That number was the upstream cause of virtually every significant move in global markets on Friday. GBP fell 1.50% because of DXY. EUR fell 0.73% because of DXY. AUD fell 0.85% because of DXY. Silver fell 9.13% because of DXY. Gold fell 2.61% because of DXY. This is not hyperbole : it is the documented causal sequence.
The trigger was hot retail sales. The reaction was rapid and predictable for anyone watching the rate differential. Strong consumer data removes rate-cut expectations. The 10-year broke above 4.50%. US rates became even more attractive relative to every other developed market central bank. Capital flows toward yield. Dollar gets bid. Everything else reprices.
The DXY futures structure confirms this is not reactive positioning. The September DXY futures sit at a slight premium above what theoretical carry would justify. Investors are paying extra for forward dollar exposure beyond what the rate differential alone explains. That speculative demand layer means the dollar bid is institutional and pre-built : not just news-driven short-termism.
The only asset that defied the DXY script on Friday was crude oil. Supply disruption overrides currency mechanics when physical buyers need the commodity regardless of the dollar price. Everything else : metals, FX, non-US equities : followed DXY lower.
3. What the Alpha Insights Said
Global Grid : Post 06
DXY described as the conductor : every major cross-asset move traces back to this single input. US exceptionalism trade identified: strong growth plus rising rates plus dollar bid equals capital repatriation to US. DXY target 100.20 in Scenario A. The 98.80 floor is described as the thesis invalidation point for all non-USD trades. This is the master switch for the entire framework.
Macro Pulse : Post 01
Causal chain documented: hot retail sales, rate-cut expectations removed, 10-year above 4.50%, dollar bid, all non-USD assets repriced lower. Consumer strength validates growth but removes the rate-cut safety net. DXY at 99.27 +0.39% is the market’s verdict on that tradeoff : strong growth wins for dollar even as it creates headwinds for equities.
Basis Edge : Post 10
DXY September futures at 99.84 versus spot 99.27. The 0.57 basis exceeds the theoretical 3-month carry of 0.45 by 0.12. Excess of 0.12 points above theoretical confirms speculative demand for forward dollar beyond pure rate differential. COT confirmation: GBP -11,200 and EUR -7,800 WoW were pre-built. This is institutional conviction in the dollar thesis, not reactive positioning.
Hot Zones : Post 05
Dollar DXY rated HOT : structural bid. The rotation map documents capital flowing from silver, gold, GBP/EUR FX and non-US equities into dollar assets and energy. DXY is explicitly in the HOT category alongside energy as the session’s two strongest asset classes. The session was a dollar-strength event with one exception (crude supply disruption).
Overwatch : Post 18
DXY 98.80 identified as the master switch. Below this level : metals thesis requires full reassessment, gold and silver recover, GBP and EUR shorts close, AUD/NZD recover. This single level controls approximately 18% of the portfolio allocation at REDUCED+STANDARD+REDUCED sizing across GBP, EUR, and gold shorts. One number to watch.
4. Key Levels
| Level | Price | Significance |
|---|---|---|
| Master Switch / Support | 98.80 | Below here : close all non-USD shorts. Entire framework pivots. |
| Current Level | 99.27 | 47 pips above the invalidation point : buffer is narrow |
| Resistance / Target A | 100.20 | Scenario A target : US exceptionalism extends |
| Futures Premium | +0.12 excess | Speculative demand beyond rate differential : institutional pre-positioning |
| 10Y Relationship | 4.50%+ | 10Y above 4.50% = DXY bid. 10Y below 4.40% = DXY loses bid. |
| FOMC Outcome Watch | Wednesday | Hawkish = DXY toward 100.20. Dovish = DXY tests 98.80. |
5. Signal + Bias
Direction: BULLISH. US exceptionalism trade is intact. Multiple rate differentials favour dollar. Speculative demand confirmed at futures level. Pre-built institutional positioning confirmed by COT.
Expression: Long USD through GBPUSD short (STANDARD), EURUSD short (REDUCED), and AUDUSD short (REDUCED). The DXY itself is the framework context : these pairs are the trades.
Watch: 98.80 is the only number that changes the entire picture. If DXY closes below 98.80 with conviction, the whole non-USD short cluster closes simultaneously. That’s not a stop : it’s a thesis invalidation.
Catalyst: FOMC minutes Wednesday. Hawkish-hold sends DXY toward 100.20. Dovish surprise tests 98.80 and potentially breaks the framework. No new USD long exposure before the minutes land.
6. Next Week Setup
FOMC minutes Wednesday 14:00 ET is the primary DXY event. The written record of the last meeting gives the market its most detailed read on rate path thinking. Hawkish language : concern about inflation persistence, pushback on cuts : sends DXY toward 100.20 and confirms the entire non-USD short framework. Dovish surprise : any hint of cuts coming sooner : tests 98.80 immediately.
Fed speakers Monday through Friday are the secondary inputs. Multiple speakers this week. The collective tone matters more than any individual statement. If they reinforce strong-economy-higher-for-longer, DXY holds the bid. If any signals unexpected dovishness, watch 98.80 closely.
Monday morning is the first test. Sunday futures open at 18:00 ET is where DXY direction gets first established for the week. ES flat or positive with DXY above 99.00 means Scenario B : consolidation, range trades, wait for Wednesday. ES down and DXY reversing below 99.00 is early warning.
The narrow 47-pip buffer between current DXY and the 98.80 invalidation point means you need to be watching. In an elevated vol regime, 47 pips can happen in a session on a bad news day. Know your exits before that happens, not after.
7. Risk Score
Around 45%
Lower risk for the dollar bull thesis than for most other instruments. The multi-factor support is genuine: rate differentials, speculative futures premium, COT pre-positioning, and US exceptionalism capital flows all aligned. The main risk is FOMC minutes delivering a dovish surprise and DXY reversing through 98.80. That would unwind the entire cluster of trades expressed through dollar strength simultaneously. But the base case (45% probability) is consolidation with DXY holding 98.80-99.50 through Wednesday.
Saturday 16 May 2026
—
title: “DXY Weekly Review : 16 May 2026”
date: “2026-05-16”
instrument: “DXY”
type: ticker-review
—
Weekend Ticker Review | 16 May 2026
DXY : The Conductor. Every Instrument This Week Played to Its Score.
DXY | US Dollar Index | 12-16 May 2026
1. Week at a Glance
| Friday Close | 99.27 |
| Friday Move | +0.39% |
| Trigger | Hot US retail sales removed rate-cut expectations |
| DXY Futures | Premium to theoretical carry : speculative demand pre-built |
| Support | 98.80 : master switch for all non-USD trades |
| Resistance | 100.20 |
| Regime | US exceptionalism : capital repatriation flow structural |
| Signal | BULLISH : structural, multi-factor, institutionally pre-built |
2. What Happened
DXY gained 0.39% to close at 99.27. That number was the upstream cause of virtually every significant move in global markets on Friday. GBP fell 1.50% because of DXY. EUR fell 0.73% because of DXY. AUD fell 0.85% because of DXY. Silver fell 9.13% because of DXY. Gold fell 2.61% because of DXY. This is not hyperbole : it is the documented causal sequence.
The trigger was hot retail sales. The reaction was rapid and predictable for anyone watching the rate differential. Strong consumer data removes rate-cut expectations. The 10-year broke above 4.50%. US rates became even more attractive relative to every other developed market central bank. Capital flows toward yield. Dollar gets bid. Everything else reprices.
The DXY futures structure confirms this is not reactive positioning. The September DXY futures sit at a slight premium above what theoretical carry would justify. Investors are paying extra for forward dollar exposure beyond what the rate differential alone explains. That speculative demand layer means the dollar bid is institutional and pre-built : not just news-driven short-termism.
The only asset that defied the DXY script on Friday was crude oil. Supply disruption overrides currency mechanics when physical buyers need the commodity regardless of the dollar price. Everything else : metals, FX, non-US equities : followed DXY lower.
3. What the Alpha Insights Said
Global Grid : Post 06
DXY described as the conductor : every major cross-asset move traces back to this single input. US exceptionalism trade identified: strong growth plus rising rates plus dollar bid equals capital repatriation to US. DXY target 100.20 in Scenario A. The 98.80 floor is described as the thesis invalidation point for all non-USD trades. This is the master switch for the entire framework.
Macro Pulse : Post 01
Causal chain documented: hot retail sales, rate-cut expectations removed, 10-year above 4.50%, dollar bid, all non-USD assets repriced lower. Consumer strength validates growth but removes the rate-cut safety net. DXY at 99.27 +0.39% is the market’s verdict on that tradeoff : strong growth wins for dollar even as it creates headwinds for equities.
Basis Edge : Post 10
DXY September futures at 99.84 versus spot 99.27. The 0.57 basis exceeds the theoretical 3-month carry of 0.45 by 0.12. Excess of 0.12 points above theoretical confirms speculative demand for forward dollar beyond pure rate differential. COT confirmation: GBP -11,200 and EUR -7,800 WoW were pre-built. This is institutional conviction in the dollar thesis, not reactive positioning.
Hot Zones : Post 05
Dollar DXY rated HOT : structural bid. The rotation map documents capital flowing from silver, gold, GBP/EUR FX and non-US equities into dollar assets and energy. DXY is explicitly in the HOT category alongside energy as the session’s two strongest asset classes. The session was a dollar-strength event with one exception (crude supply disruption).
Overwatch : Post 18
DXY 98.80 identified as the master switch. Below this level : metals thesis requires full reassessment, gold and silver recover, GBP and EUR shorts close, AUD/NZD recover. This single level controls approximately 18% of the portfolio allocation at REDUCED+STANDARD+REDUCED sizing across GBP, EUR, and gold shorts. One number to watch.
4. Key Levels
| Level | Price | Significance |
|---|---|---|
| Master Switch / Support | 98.80 | Below here : close all non-USD shorts. Entire framework pivots. |
| Current Level | 99.27 | 47 pips above the invalidation point : buffer is narrow |
| Resistance / Target A | 100.20 | Scenario A target : US exceptionalism extends |
| Futures Premium | +0.12 excess | Speculative demand beyond rate differential : institutional pre-positioning |
| 10Y Relationship | 4.50%+ | 10Y above 4.50% = DXY bid. 10Y below 4.40% = DXY loses bid. |
| FOMC Outcome Watch | Wednesday | Hawkish = DXY toward 100.20. Dovish = DXY tests 98.80. |
5. Signal + Bias
Direction: BULLISH. US exceptionalism trade is intact. Multiple rate differentials favour dollar. Speculative demand confirmed at futures level. Pre-built institutional positioning confirmed by COT.
Expression: Long USD through GBPUSD short (STANDARD), EURUSD short (REDUCED), and AUDUSD short (REDUCED). The DXY itself is the framework context : these pairs are the trades.
Watch: 98.80 is the only number that changes the entire picture. If DXY closes below 98.80 with conviction, the whole non-USD short cluster closes simultaneously. That’s not a stop : it’s a thesis invalidation.
Catalyst: FOMC minutes Wednesday. Hawkish-hold sends DXY toward 100.20. Dovish surprise tests 98.80 and potentially breaks the framework. No new USD long exposure before the minutes land.
6. Next Week Setup
FOMC minutes Wednesday 14:00 ET is the primary DXY event. The written record of the last meeting gives the market its most detailed read on rate path thinking. Hawkish language : concern about inflation persistence, pushback on cuts : sends DXY toward 100.20 and confirms the entire non-USD short framework. Dovish surprise : any hint of cuts coming sooner : tests 98.80 immediately.
Fed speakers Monday through Friday are the secondary inputs. Multiple speakers this week. The collective tone matters more than any individual statement. If they reinforce strong-economy-higher-for-longer, DXY holds the bid. If any signals unexpected dovishness, watch 98.80 closely.
Monday morning is the first test. Sunday futures open at 18:00 ET is where DXY direction gets first established for the week. ES flat or positive with DXY above 99.00 means Scenario B : consolidation, range trades, wait for Wednesday. ES down and DXY reversing below 99.00 is early warning.
The narrow 47-pip buffer between current DXY and the 98.80 invalidation point means you need to be watching. In an elevated vol regime, 47 pips can happen in a session on a bad news day. Know your exits before that happens, not after.
7. Risk Score
Around 45%
Lower risk for the dollar bull thesis than for most other instruments. The multi-factor support is genuine: rate differentials, speculative futures premium, COT pre-positioning, and US exceptionalism capital flows all aligned. The main risk is FOMC minutes delivering a dovish surprise and DXY reversing through 98.80. That would unwind the entire cluster of trades expressed through dollar strength simultaneously. But the base case (45% probability) is consolidation with DXY holding 98.80-99.50 through Wednesday.
Friday 15 May 2026
US Dollar Index (DXY) — Daily Read | Friday 15 May 2026
Post-CPI close | 98.89 — short-covering paradox, medium-term direction unresolved | Not financial advice
WHAT CHANGED FROM YESTERDAY
Earlier in the week, DXY was at 98.45 — flat, waiting on the CPI data. Thursday’s CPI came in soft, and the dollar went up. DXY closed at 98.89 (+0.42%). This is the paradox that the Overwatch identified explicitly: lower inflation — which is the textbook condition for a weaker dollar — produced a stronger dollar in Thursday’s session. The explanation is short-covering, not new dollar longs. Institutions that had been short the dollar ahead of CPI (betting that soft inflation would be confirmed and would weaken the dollar) were forced to cover those positions when the “soft landing” interpretation of the CPI print pushed equities and the dollar up simultaneously. That cover is largely mechanical. It finishes when the shorts are clear. After it finishes, the medium-term thesis reasserts.
HEADLINE STATE: SHORT-COVERING MECHANICS — Medium-Term Direction Is Lower Under Rate-Cut Path
DXY 98.89 is not a bullish dollar story. It is a short-covering story that the Overwatch described as the dollar squaring paradox. The confirmed rate-cut path is dollar-negative in the medium term: when the Fed cuts rates, the yield advantage that attracts capital flows to the dollar narrows. That process runs over months, not days. Friday’s Retail Sales print adds one more input: strong data extends the short-covering (dollar bids further) while weak data probably accelerates the transition to the medium-term direction (dollar falls). Either way, the directional resolution — where does DXY go after the squaring completes — is next week’s FX story.
Key Levels
| Level | Price | Significance |
|---|---|---|
| Thursday close | 98.89 | Post-CPI short-covering — not new structural dollar strength |
| Prior pre-CPI level | 98.45 | Monday flat — short-covering added 44 points |
| Strong RS extension | 99.20–99.60 | Short-covering continues — headwind for EUR, GBP, AUD |
| Squaring completion zone | 98.00–98.50 | Short-covering exhausted — medium-term thesis takes over |
| Medium-term target | 96.50–97.50 | Rate-cut path expressed — dollar yield advantage narrows |
| Fed speaker risk | Next week | Overwatch: hawkish Fed speaker could push DXY back above 100 |
Structure · Momentum · Flow
Structure
Short-term elevated from the short-covering move. But the structural medium-term path under a confirmed rate-cut regime points lower. DXY is caught between the two timeframes right now.
Momentum
Positive short-term from Thursday’s squeeze. But short-covering momentum is self-limiting — it stops when the shorts are cleared. After that, momentum reverts to the medium-term direction.
Flow
Mixed. Short-covering is active. But institutional positioning under a rate-cut path favours reducing dollar exposure over time. The two flows are in conflict until the squaring completes.
| Bias | NEUTRAL SHORT-TERM — BEARISH MEDIUM-TERM |
| Risk estimate | Around 35% — short-covering mechanics versus rate-cut path |
| Today’s read | Strong RS = DXY extends to 99.20+. Weak RS = squaring completes faster. |
| Fed risk next week | Hawkish speaker could push above 100 — 30% probability per Overwatch |
| Week carry | Unresolved — medium-term direction is the key FX question into next week |
This content is for educational and informational purposes only and does not constitute financial advice. Past analysis does not guarantee future results. Always conduct your own research before making any trading decisions.
Thursday 14 May 2026
US Dollar Index (DXY) — Daily Read | Thursday 14 May 2026
Post-CPI mid-session | Dollar bid on lower CPI | Not financial advice
WHAT CHANGED FROM YESTERDAY
Yesterday DXY was MOSTLY SHORT — range 97.5 to 98.5, bearish swing bias. The analysis said the dollar’s ceiling appears to be 98.5 and the bearish swing bias expected a resolution lower. Instead CPI came in lower and the dollar was bid. DXY is now at 98.79 — sitting above the prior range ceiling of 98.5. This is a meaningful development. Price has broken the prior range ceiling. This does not reverse the macro short read, but it does change the near-term picture significantly.
HEADLINE STATE: RANGE BREAK — Testing Above 98.5, CPI Catalyst
DXY has broken above the prior 97.5 to 98.5 range on the CPI print. The question is whether this is a genuine breakout or a CPI spike that fades back into the range. The analysis’ macro short bias was correct about the broader context — the dollar is not in a strong uptrend — but the “good CPI” narrative gave it a near-term bid. Dollar up, equities up, gold down slightly: this is the “soft landing confirmed” trade. The dollar is not being bought because the economy is strong — it is being bought because inflation is behaving.
Key Levels
| Level | Price | Significance |
|---|---|---|
| Current price | 98.79 | +0.31% — above prior range ceiling |
| Prior range ceiling | 98.5 | Broken above — watching for hold or fade back |
| Prior range floor | 97.5 | Now distant support — range expanded upward |
| Macro bias | Bearish swing | Still the bigger picture — CPI bounce is tactical, not structural |
| Key test level | 99.0 | Round number resistance — watch if dollar approaches this |
Structure · Momentum · Flow
Structure
Range broken above on CPI catalyst. This is either a genuine structural break (dollar regaining strength) or a CPI spike that fades. The macro bearish swing bias does not reverse on one day’s data. Watch whether 98.5 holds as new support or price falls back through it.
Momentum
Short-term momentum is with the dollar. CPI events create sharp, one-day moves that often reverse. The question is whether the momentum extends past today or fades as the initial reaction passes.
Flow
Dollar bid + equities bid = “good CPI” interpretation. Capital is flowing into US assets broadly — stocks and dollars simultaneously. This is a confidence trade in the US economy. Not a fear trade.
TODAY’S BIAS: WATCH THE 98.5 RETEST — Does It Hold as Support?
The prior macro short read noted the range ceiling at 98.5. DXY has pushed through it. The critical question for the next 24-48 hours: does 98.5 become new support (bullish structural shift) or does DXY fade back below it (CPI spike rejected, macro bearish resumes)? The answer to that question determines the trade for the rest of the week across every dollar pair.
Risk: Around 50%
The range break creates genuine uncertainty. The macro short thesis is not proven wrong by one CPI print, but a hold above 98.5 would challenge it. Risk is elevated in both directions here — do not chase the dollar bid or fight it without confirmation of the next directional move.
By Experience Level
New to this
DXY is the master switch for FX markets. When it goes up, most currency pairs fall against the dollar. When it falls, they rise. Understanding where DXY is in its structure tells you the direction of pressure across 20+ pairs simultaneously. This is why we track it every day.
Developing
The 98.5 level is the level to monitor. If DXY closes above it today, it puts the macro short thesis on hold and sets up a potential trade in dollar longs against EUR, GBP, AUD. If it fades back below 98.5 by close, the range has rejected the break and the short thesis resumes.
Experienced
DXY up and equities up on the same day is the “goldilocks” scenario — low inflation, strong economy. That combination has historically been short-lived in 2024-2025. The setup to watch is if equities fade in the afternoon while DXY holds. That changes the read from “goldilocks” to “dollar concerns” which is bearish for risk assets. Monitor the relationship through the NY afternoon close.
This is a daily analysis read for educational and informational purposes only. Nothing here is financial advice. Past performance is not a guide to future results. Trading carries significant risk of loss. Always apply your own risk management.
Tuesday 5 May 2026
DXY (Dollar Index) — Daily Framework Read | Tuesday 5 May 2026
US Dollar Index | Daily Framework Read | Tuesday 5 May 2026
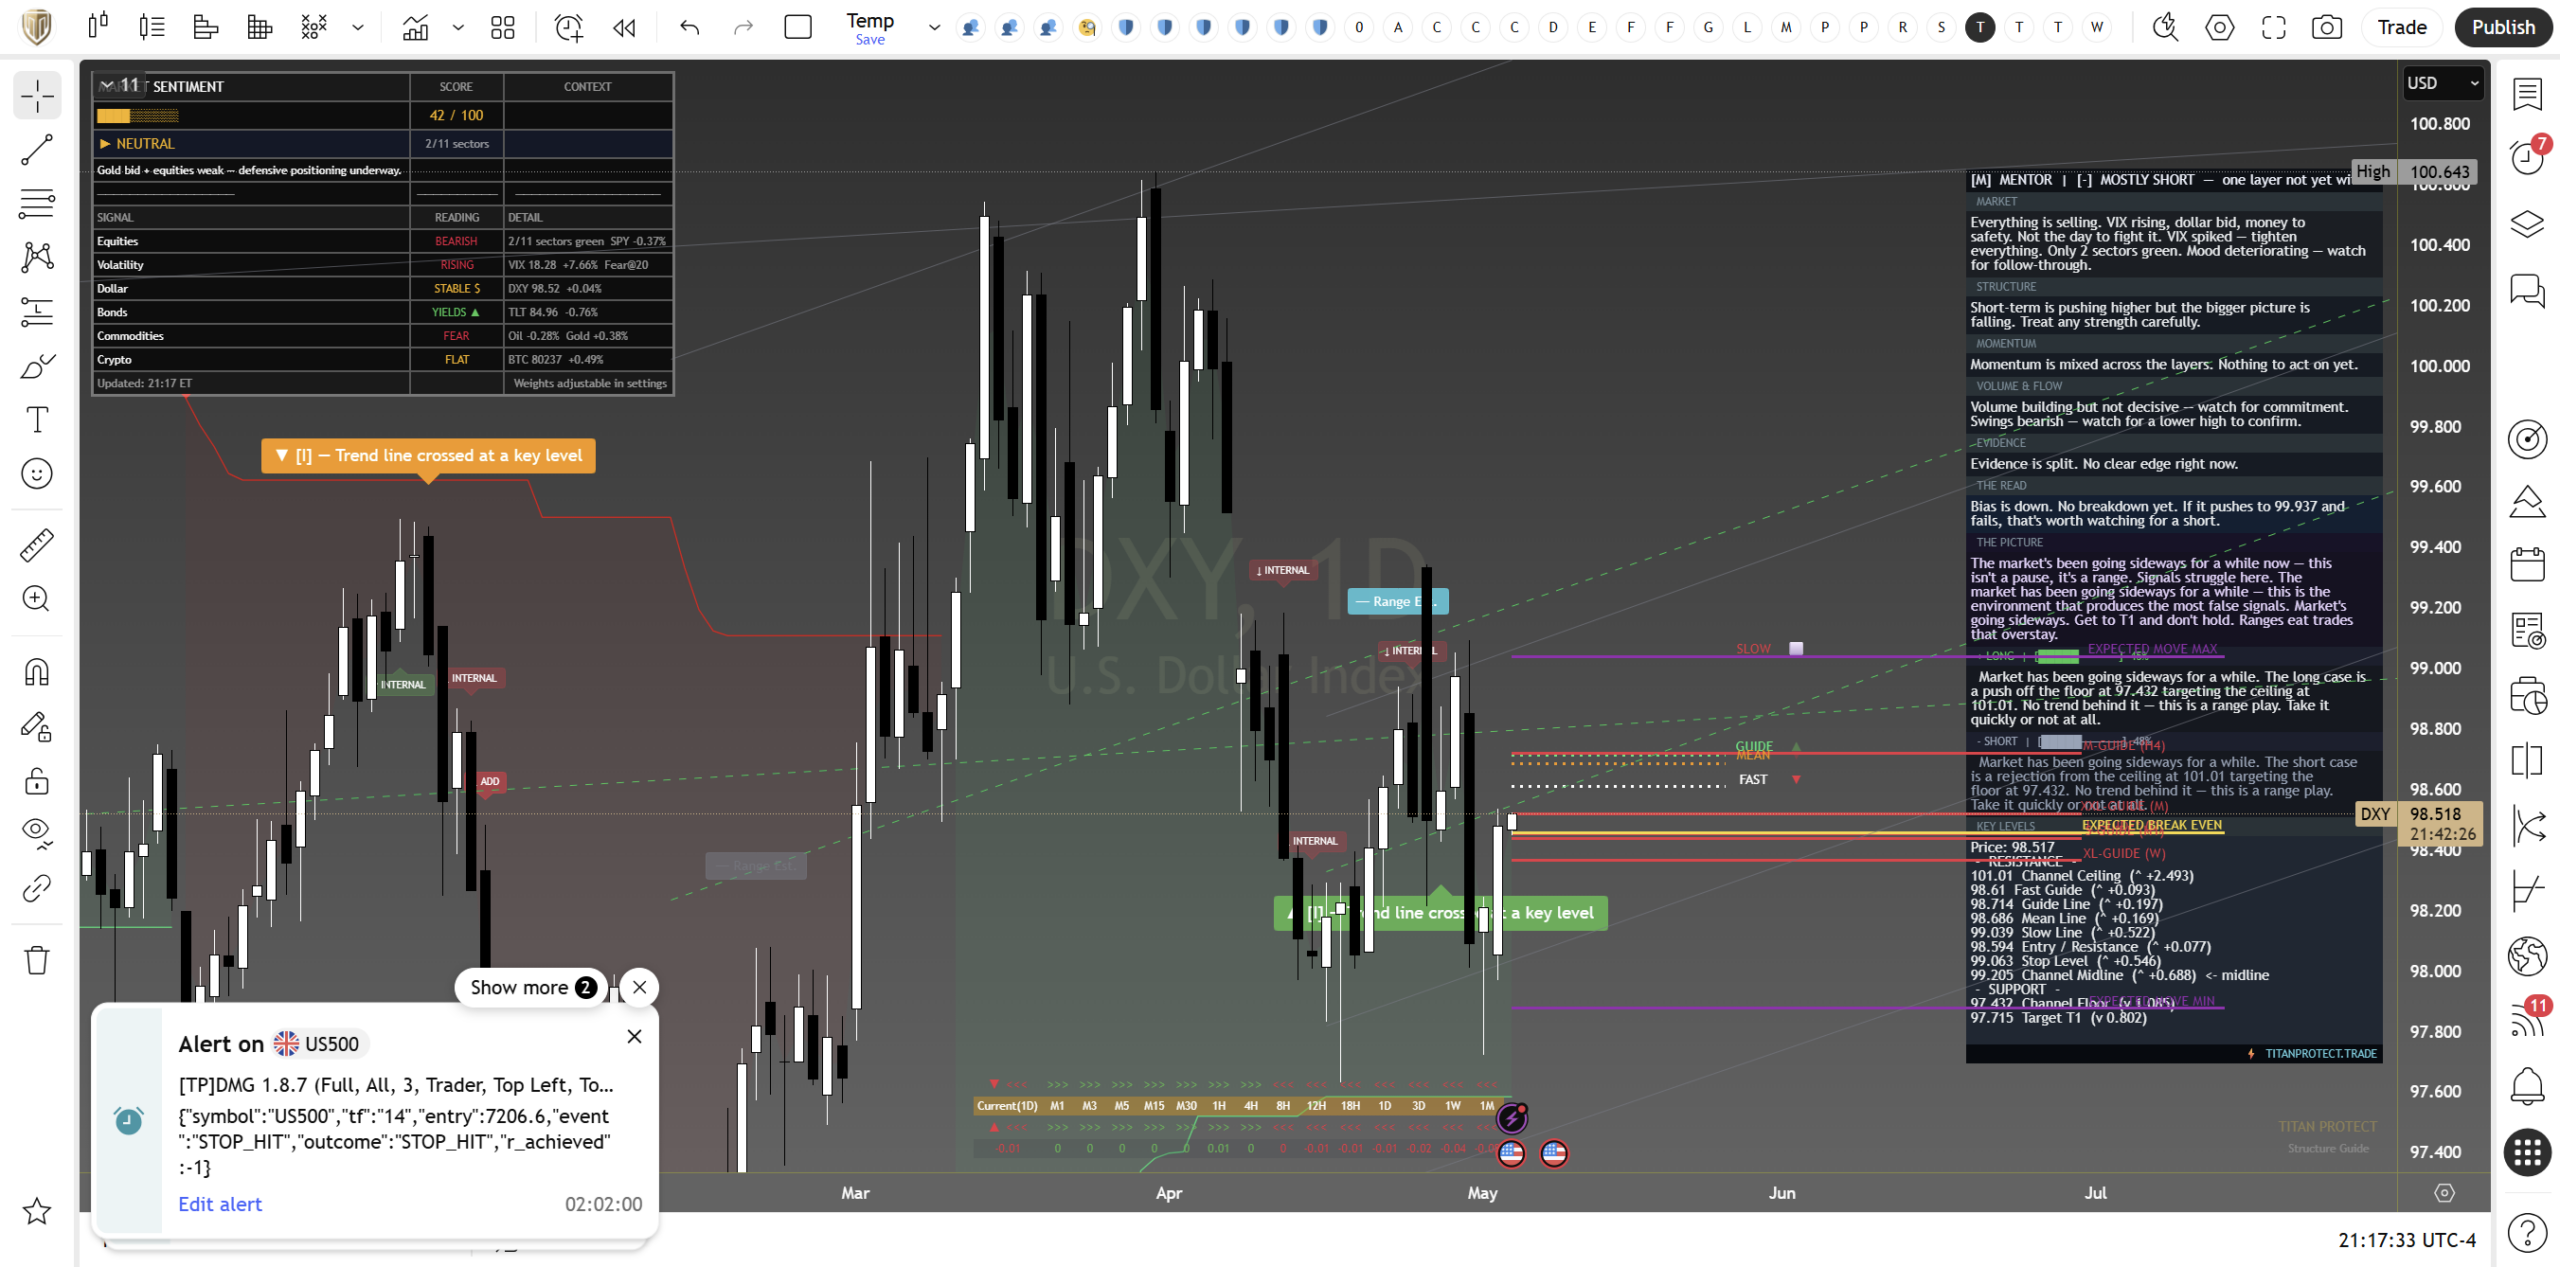
DXY closes Tuesday at 98.479 with a flat tape and a zero-print on the daily change. The headline reads boring. The cross-currency read does not. Underneath the index, the components are pulling in opposite directions: euro and sterling both shipped ground against the dollar, the yen gave back, and the only reason the basket sits flat is that the bid in USD/JPY offset the bid that was missing in EUR/USD and GBP/USD. The analysis reads the index as compressed against a structural shelf, with the directional risk skewing higher into the Fed minutes on Wednesday. Until 99.16 is reclaimed on a closing basis, the dollar is not breaking out; until 98.21 is lost, the dollar is not breaking down. Today’s flat print is the calm before the catalyst.
Tuesday thesis on the Dollar Index. The analysis reads DXY as coiled inside the 98.21 to 99.16 compression band that has held for fourteen sessions running. The flat session masks divergent component flow. Euro and sterling sold against the dollar while the yen carried the dollar bid through Asia. That asymmetry is the tell. The dollar is being supported by yen weakness more than driven by broad strength. Wednesday’s Fed minutes are the binary catalyst. A hawkish-symmetric tone reclaims 99.16 and opens 99.80; a softer dovish-tilt read loses 98.21 and opens 98.00 then 97.40 below.
Where It Sits Today
Close
98.479
flat / 0.00%
Compression Band
98.21 – 99.16
14-session range
Components
Mixed
EUR/GBP soft, JPY firm
Framework
COMPRESSED
range-bound, upside-tilt
Catalyst
Wed 19:00 BST
Fed minutes
A flat close on a basket index is rarely flat underneath. Today is a textbook example. EUR/USD lost 27 pips to 1.1695, GBP/USD lost 38 pips to 1.3530, and USD/JPY added 22 pips to 157.20. Two of the dollar’s three biggest components ran lower against the greenback while the yen carried the offsetting bid. The basket nets to zero, but the read is not neutral. The framework treats this as a structural compression with directional energy building behind it.
The 14-session range between 98.21 and 99.16 is the tightest compression DXY has printed since the second half of January. Every prior compression of similar duration has resolved with a multi-figure move within ten sessions of the break. The framework does not read the direction yet. It reads the energy. The break direction depends on Wednesday’s Fed minutes, and the asymmetry sitting underneath the index favours the upside if the minutes confirm hawkish-symmetric language.
What the Framework Reads
The analysis reads the dollar as COMPRESSED with an upside tilt. The trend tooling holds neutral on the daily, the value area sits dead-centre at 98.50, and the retracement polarity remains in long mode from the late-March low. Three components matter for the read.
Component asymmetry is the live signal. EUR/USD trend tooling rolled lower today and value-area rejection at 1.1750 is now confirmed. GBP/USD lost the 1.36 handle into the close and is offered into the 1.3500 round number. USD/JPY firmed through 157 with the Bank of Japan still passive. That mix means the dollar is being supported asymmetrically — soft euro and soft sterling, firm yen — and the basket weighting tilts marginally bullish on net. The framework flags this as the highest-conviction read sitting underneath a flat headline print.
The 99.16 ceiling is the live trigger. Every push above 98.90 has been sold for fourteen sessions, but the lows have ratcheted higher. The pattern is a textbook ascending compression: lower-high ceiling holds while the floor steps up. The analysis reads this structure as a buy-side accumulation more often than not, but the confirmation signal sits at 99.16. A daily close above flips the index from compressed to expanding-higher and opens 99.80 as the first measured target, with 100.20 behind it.
The 98.21 floor is the invalidation. The lower boundary of the compression has held three tests in two weeks. A daily close beneath flips the read from compressed to expanding-lower, removes the upside tilt entirely, and opens 98.00 then 97.40 as targets. The analysis reads the floor as more important than the ceiling for one reason: a downside break would coincide with EUR/USD reclaiming 1.1750 and GBP/USD reclaiming 1.36, which are themselves rejected ceilings on the cross side. The cross-confirmation matters.
What the cross-currency read tells us. Today’s component flow is the cleanest read available. The dollar gained against the European complex and lost relative ground against the yen, but EUR/JPY softened and GBP/JPY held flat. That confirms the European softness rather than dollar strength as the dominant driver. The framework calls this a euro-sterling story, not a dollar story, and the implication is that any dollar break higher will need fresh dollar-side conviction rather than continued European weakness alone.
FX Focus cross-reference
Tuesday’s FX Focus brief flagged EUR/USD as the softest leg of the dollar complex with cable carrying the cleaner directional signal. The DXY read on this page reconciles to that brief: the index sits flat because the European softness was offset by yen weakness, not because the dollar is genuinely range-bound on its own merits. If sterling loses 1.3500 and the euro loses 1.1680 in the same session, the index breaks higher on European weight alone. Watch the cross floors as the index trigger.
Key Levels
| Level | Price | Type | Meaning |
|---|---|---|---|
| Q1 high zone | 100.20 | Major upside target | January cycle high. The full measured-move target if 99.16 breaks with conviction. |
| First measured target | 99.80 | Bull objective | First major resistance shelf above 99. Where the framework places the initial profit-take on a clean ceiling break. |
| Compression ceiling | 99.16 | The live trigger | 14-session ceiling. Daily close above flips the index from compressed to expanding-higher. |
| Current price | 98.479 | Range middle | Almost dead-centre between the compression boundaries. Equilibrium price for the basket. |
| Compression floor | 98.21 | Invalidation downside | 14-session floor, three tests held. Daily close beneath flips the read entirely. |
| Bear extension | 98.00 | First downside target | Round-number magnet sitting just under the floor. First stop on a clean break lower. |
| Structural floor | 97.40 | Major downside target | March cycle low. Loss invalidates the entire dollar bull thesis from the late-March turn. |
Yesterday Versus Today
| Component | Monday read | Tuesday read |
|---|---|---|
| Bias | Compressed, neutral | Compressed, upside tilt |
| Component flow | Mixed, no edge | EUR/GBP soft, JPY firm |
| Trend tooling | Neutral | Neutral, holding pivot |
| Range | 98.30 – 98.65 | 98.41 – 98.58 |
| Cross signal | EUR/USD 1.1727, GBP 1.3582 | EUR/USD 1.1695, GBP 1.3530 (both lower) |
Monday’s read sat compressed with no directional edge. Tuesday’s session keeps the index pinned in the same band but tilts the underlying read upside because the European complex sold off cleanly. The basket itself printed flat. The composition shifted. That is the change that matters.
The Call
The analysis reads DXY as a directional setup pending the Wednesday Fed minutes. Inside the compression band, there is no clean trade. The 99.16 ceiling has rejected every push and the 98.21 floor has held every test. Patience is the call. Reaction is the trade. A daily close above 99.16 is the long trigger — first target 99.80, second target 100.20, invalidation a return inside the band. A daily close beneath 98.21 is the short trigger — first target 98.00, second target 97.40, invalidation a return inside the band.
The cross-currency confirmation is the higher-confidence path. If the index breaks 99.16 while EUR/USD loses 1.1680 and GBP/USD loses 1.3500 in the same session, the analysis reads the dollar trade as 80 percent confirmed. If the index breaks alone with the crosses still inside their respective ranges, the analysis reads it as 60 percent confirmed and prefers a tactical entry on the first pullback into 99.16-from-above rather than a chase. The asymmetry favours waiting for the catalyst and trading the reaction, not anticipating the break.
Risk read: around 65 percent
The framework gives this an elevated risk read for three reasons. First, the Fed minutes can reset the dollar narrative in either direction without warning, which makes any anticipatory position binary into the print. Second, the compression has held for fourteen sessions and false breaks become more likely the longer compression persists. Third, the cross-currency map is asymmetric — euro and sterling are already at structural levels, which means the dollar’s break direction depends as much on whether the European floors hold as on whether the dollar’s own ceiling breaks. The mitigating factor is the cleanness of the levels themselves: 99.16 and 98.21 have both been tested multiple times and offer well-defined invalidation, which makes risk easy to size if the trader waits for the catalyst rather than chasing the band.
The Bottom Line
DXY closes Tuesday flat at 98.479 and reads compressed with an upside tilt sitting beneath the surface. The 14-session range between 98.21 and 99.16 is the tightest the index has shown since January and the components are no longer rotating in lockstep. Euro and sterling sold today, the yen carried the offsetting bid, and the basket netted to zero on a tape that was anything but neutral underneath. The framework is not in the business of anticipating Fed minutes. It is in the business of reading what is and reacting to what breaks. The levels are clean, the asymmetry is mapped, and the catalyst is forty-eight hours away. The trade is the reaction, not the anticipation.
Daily framework reads are educational analysis of major instruments based on a proprietary multi-component framework. They are not personalised advice or a recommendation to buy or sell any instrument. Trading FX involves risk of loss including losses greater than the deposit on leveraged positions. Past performance does not predict future results. Always size positions to your own risk tolerance and seek independent advice where appropriate.
Continue with Titan Protect
Twenty-plus instruments. One framework.
We read more than twenty instruments daily across four sessions. The framework’s sunrise call landed across the day — the Pre-NY case study shows what the lines drew, what New York did, and where the read stands.
Core
£59/mo
Indicator suite plus daily framework reads.
Edge Popular
£109/mo
Core plus Shield dashboard and member-only briefs.
Elite
£179/mo
Edge plus weekly 1:1 call and early access to new tools.
Save 15% on annual billing
Want to see the framework in action? Free Explorer tier — no card required.
Join the live community: Discord channel · Shield dashboard
Education, not financial advice. Trade your own analysis.
Sunday 3 May 2026
Dollar Index (DXY) — Daily Framework Read | Sunday 3 May 2026
Dollar Index (DXY) | Monday Open Framework Read | Data basis: Friday 1 May 2026 close
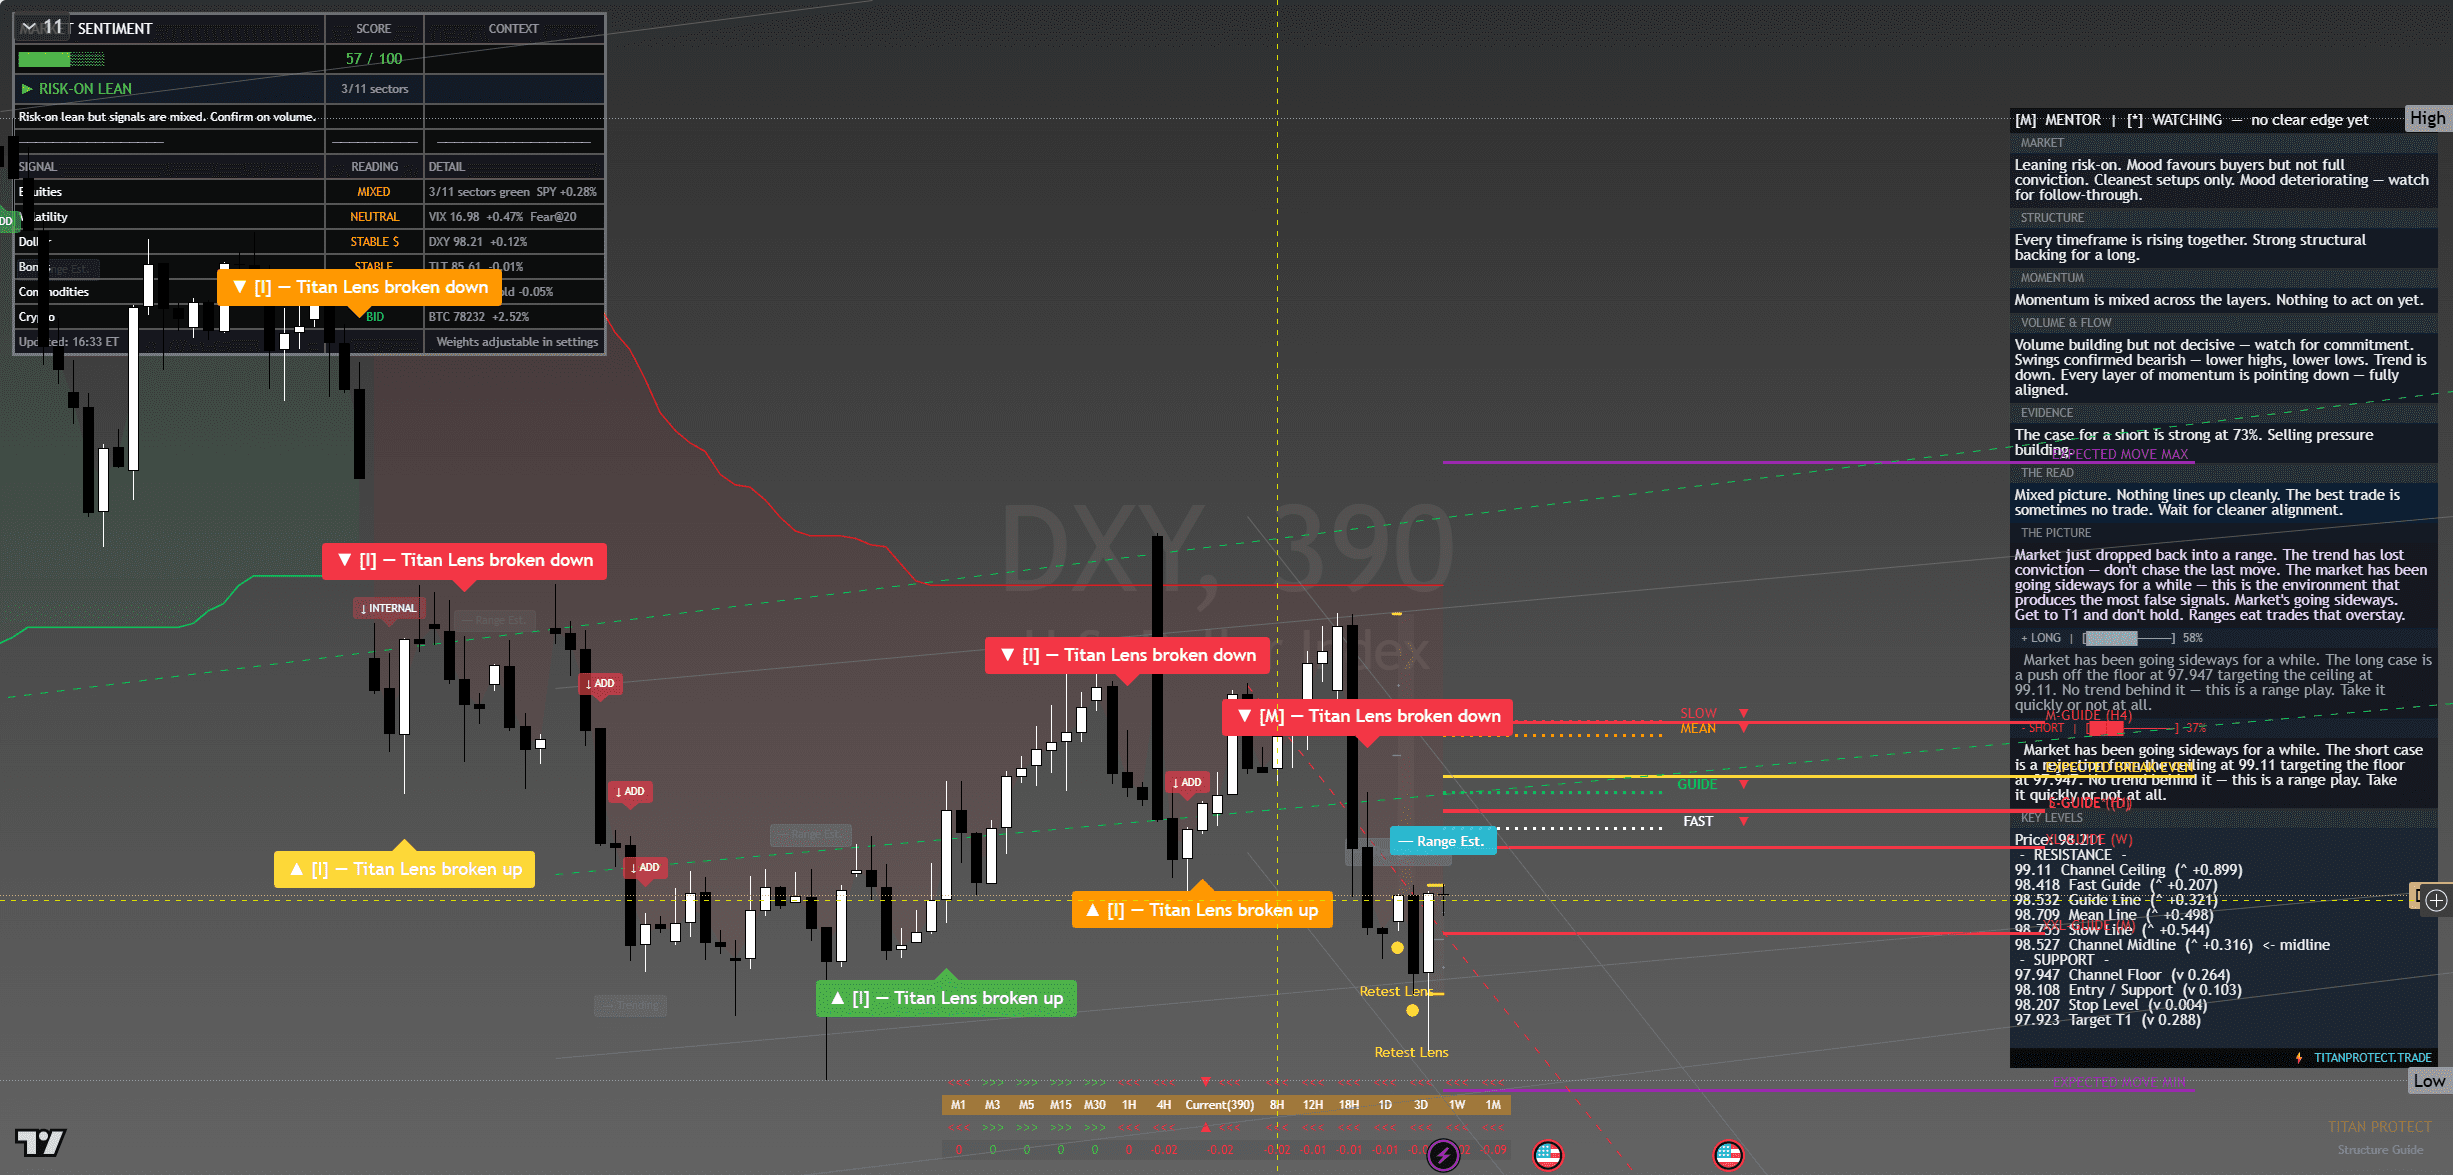
Dollar Index (DXY) — chart with framework overlay. The Lens annotations show structural breaks, reversal triggers and confluence zones at the levels referenced below.
Where It Sits
Structure
Structurally the dollar has been carving out a tight range between 99.10 and 100.50 for two weeks. Friday’s close sits roughly mid-range. The structure is balanced — neither side has conviction. Daily timeframe shows consolidation, 4-hour timeframe shows tight chop.
Momentum
Momentum is neutral. Internal readings sit near the centre of their range with no obvious tilt. That is the read of a market in transition — waiting for the next macro catalyst before committing.
Volume & Flow
USD futures flow has been balanced — no aggressive positioning on either side. The pattern is consistent with a market in wait-and-see mode ahead of the next data prints.
Key Levels
| Level | Type | Significance | Action Zone |
|---|---|---|---|
| 100.50 | Resistance | Round number, recent supply zone | Take profits / fade if rejected |
| 100.10 | Pivot | Mid-range trigger | Hold above = bullish bias |
| 99.85 | Friday close | Reference anchor | Bias line for Monday open |
| 99.50 | Support | Recent breakout retest level | Buy zone for USD bulls |
| 99.10 | Major support | Multi-week range floor | Breakdown level |
Three Scenarios Into Monday Open
Continuation
DXY opens firm, holds 99.85, takes 100.10 cleanly in NY on continued post-PCE positioning. Runs to 100.50 round number by close. USD strength persists.
Range
DXY opens flat, churns 99.65-100.10 through the session. Magnet to Friday close. Range trade in absence of fresh catalyst.
Mean Reversion
DXY opens weak on risk-on USD selling, fades to 99.50 support. Mean-reversion within the broader range.
Risk Score
Risk sits at Around 50% heading into Monday open.
Risk is moderate. The dollar found a marginal bid post-PCE but the broader range remains intact. The constraint is two-way risk — USD has not committed to a new directional leg in either direction. Position-sized USD-driven trades on confirmation, no aggressive bets on the breakout zone until structure resolves.
How to Walk It
Entry / Stop / Target structure:
- Long 99.55-99.70 pullback | Stop 99.40 | Target 100.10 | R:R 2.5:1
- Long 100.15 breakout | Stop 99.85 | Target 100.50 | R:R 1.2:1
- Short 100.55+ rejection | Stop 100.75 | Target 99.85 | R:R 3.5:1
Experience-level guidance:
Beginner: The Monday open after a Friday record close is exactly the situation where over-confidence costs money. Reduce size to half your standard. Trade only the cleanest setup from the entries above. If the tape opens against your bias, do nothing — wait for the second hour, when the institutional flow has tipped its hand.
Intermediate: Use the levels table to define the trading range. Fade the extremes with defined stops, take profits before the round-number resistance levels. Do not carry directional positions through the day if you cannot watch the tape — Monday opens are prone to fast reversals.
Advanced: The vol regime is supportive of trending moves. Defined-risk options structures around the key pivot levels capture the asymmetry cleanly. Keep notional small relative to your book — Monday after a record-close week is asymmetric speculation, not core positioning.
The Sunday Composite — How This Read Sits Inside The Cross-Asset View
This single-instrument framework read is one slice of the larger Sunday weekend synthesis. The composite takes positioning, macro, sentiment, volatility, sector dispersion and trade structure as separate analytical layers and arrives at a unified composite verdict for Monday open. Each layer below is unpacked in full.
Read the full composite for the cross-asset context driving this instrument:
The institutional positioning split — Asset Managers vs Leveraged Funds in size
PCE clearance and the macro case for Monday’s carry
The three-layer sentiment disagreement — surface greed, retail neutral, professionals hedged
The vol curve term structure and what VVIX is signalling
Sector dispersion and the breadth problem behind the record close
The Monday position-management playbook — sizing tiers and trade plans
Sunday Overwatch — the unified composite verdict
Continue Reading
The macro frame driving this read is unpacked in the weekend briefs:
Sunday Setup — Reading The Tape Into Monday Open
PCE Cleared, VIX Crushed, SPY Closed 720 — Friday Post-Close Recap
This analysis is for educational and informational purposes only. It does not constitute financial advice. Always manage your risk independently and in accordance with your own financial circumstances.


