Crude Oil (WTI) – Daily Read
2 October 2026 | Commodity | Titan Macro Desk
$92.30
Crude Oil (WTI) is rebounding, but it has not yet repaired the damage from its recent pullback. The last price is $92.30, 2.2 percent higher on the day, showing that buyers are willing to defend weakness. Even so, the market remains below an important reference point and is sitting mid-range over the past month. The clear view is cautiously constructive: the longer trend still favors higher prices, but bulls need to reclaim nearby resistance before this move can be treated as more than a relief bounce.
The macro backdrop is a tug of war between concerns about demand and the risk that supply becomes less comfortable. Oil is especially sensitive to changes in growth expectations, the dollar, geopolitical risk, and producer discipline, so conviction can shift quickly without the underlying longer-term structure immediately changing. For this instrument, the immediate catalyst is the attempt to stabilize after a sharp retreat. Momentum is roughly 10.5 percent down over the last two weeks, which explains why the daily rise matters but also why it is not yet decisive. The one month average is $95.99; price is below it, and the structure reads as a pullback, slipping under the one-month average while the longer trend still points up.
The nearer round number handles at $94.00 and $92.00 define the immediate contest. Holding $92.00 would show that buyers are absorbing supply around the current market and could support another challenge of $94.00. A sustained move through $94.00 would improve the tone because it would place price closer to recovering the one month average at $95.99. Failure to hold $92.00 would weaken the rebound and increase the risk of a deeper test. The more important shelf of support is at $82.54, about 10.6 percent below. That area matters because it separates an orderly pullback from a broader structural deterioration.
The month swing high is $105.63, about 14.4 percent above the current price, and it is also the upper boundary of the three month range of $68.08 to $105.63. If buyers reclaim $94.00 and then establish price above $95.99, the pullback should begin to look repaired. If that strength attracts follow-through, a retest of $105.63 becomes credible. A decisive move above $105.63 opens the path toward $107.63, confirming that the longer upward trend has regained control.
The bear path starts if $92.00 fails and rebounds cannot recover $94.00. In that case, sellers would retain tactical control and the market could rotate toward $82.54. If that shelf holds, the broader constructive structure survives, though confidence would remain fragile. If it breaks decisively, the meaning changes: losing $82.54 exposes $68.08 and would signal that the pullback has developed into a much larger reset.
The main risk to the constructive view is that the current daily strength proves temporary beneath $95.99. Bullish invalidation comes through a loss of $82.54, while bearish invalidation comes through sustained acceptance above $105.63. Net, the market is stabilizing within an upward longer-term structure, but buyers still have work to do. Above $95.99 the balance improves materially; below $92.00, caution should rise quickly.
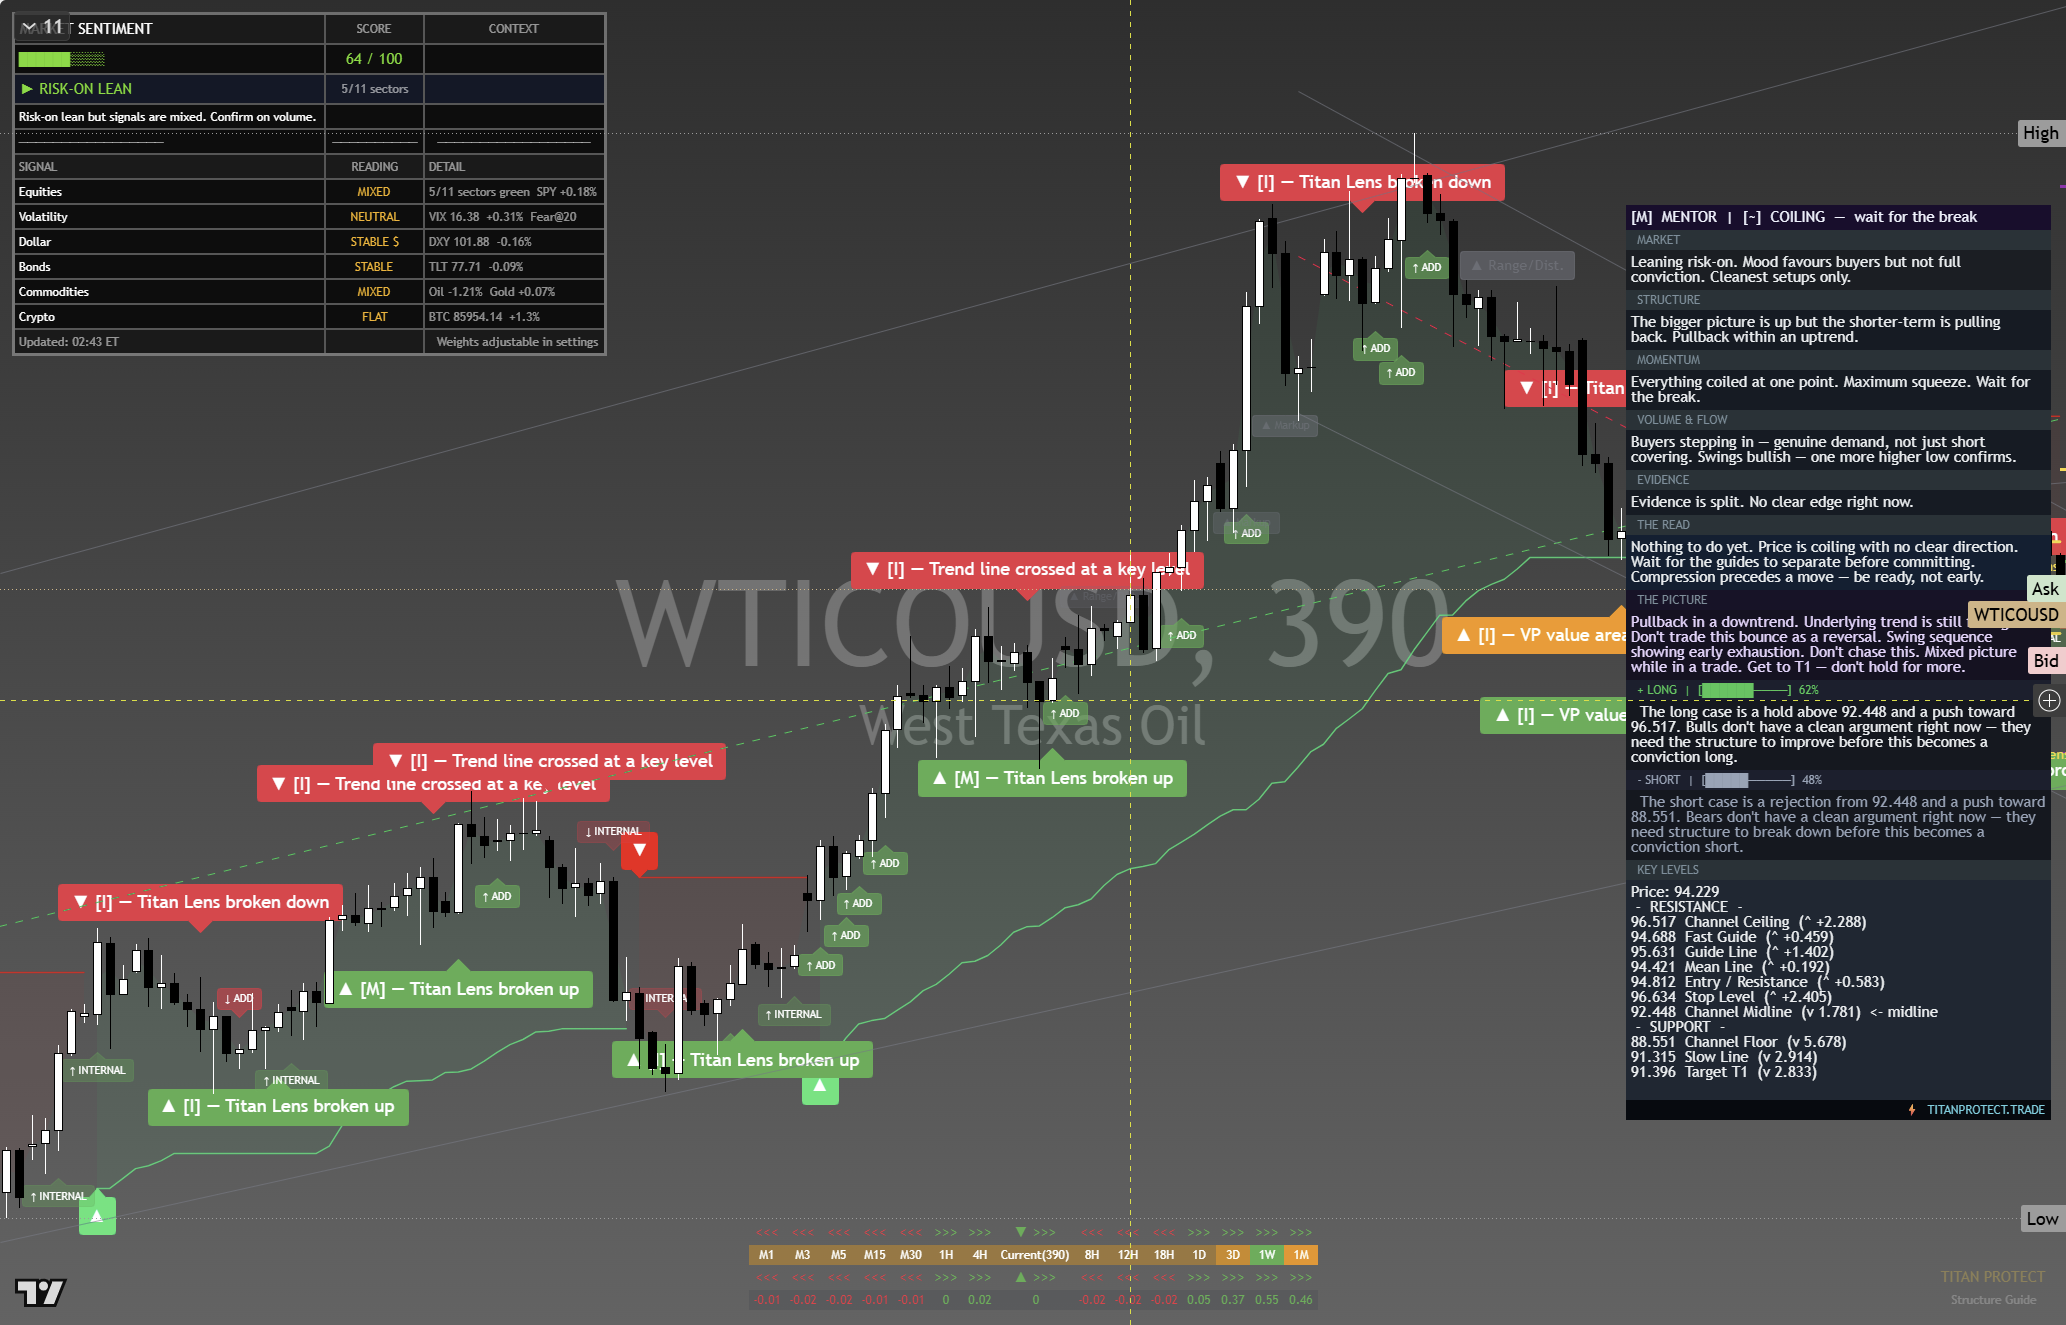
The chart above is the full daily read: structure, momentum, the levels that matter, and where the current price sits against them. Read it top to bottom for the complete picture, and pair it with our session briefs for the wider market context.
This is analysis, not financial advice. It reflects our multi-factor framework and is not a recommendation to buy or sell. Always do your own research and manage your risk.