Crude Oil (WTI) – Daily Read
30 September 2026 | Commodity | Titan Macro Desk
$89.68
WTI is attempting to stabilize, but the burden of proof remains with buyers. Last price is $89.68, 0.9 percent higher on the day, yet it is trading in the lower half of its one-month range. The clear view is that this is a countertrend bounce inside an active pullback, not yet a confirmed return to strength. That distinction matters because crude is sitting close to psychologically important pricing while recent selling has been forceful enough to keep producers, consumers, and speculative capital sensitive to the next break.
The macro backdrop is pulling oil in opposing directions. Expectations for global growth and fuel demand support the longer trend, while uncertainty around consumption, inventory accumulation, currency conditions, and supply discipline encourages traders to sell rallies. Geopolitical or production disruptions can quickly restore a scarcity premium, but crude also remains vulnerable when demand expectations soften. The one month average is $95.64; price is below it, and the structure reads as a pullback, slipping under the one-month average while the longer trend still points up. Momentum is roughly 13.2 percent down over the last two weeks, showing that sellers retain control of the recent move even as the latest session improves.
The immediate decision area is defined by the nearer round number handles at $90.00 and $88.00. Holding above $90.00 would show that buyers can absorb supply near a widely watched reference point and begin rebuilding confidence toward the one month average. Failure to hold $88.00 would instead confirm that the bounce lacks sponsorship and invite another test lower. The month swing high is $105.63, about 17.8 percent above the current price, making it the main barrier between recovery and renewed trend expansion. Below, a shelf of support sits at $80.65, about 10.1 percent below. That shelf matters because it is the clearest area where longer-horizon buyers should defend the broader advance. The three month range is $68.08 to $105.63, which frames the present price as neither washed out nor close to a clean upside escape.
The bull path is straightforward: if WTI establishes itself above $90.00, regains $95.64, and sustains demand through that area, then the pullback can mature into a recovery toward $105.63. A decisive move above $105.63 opens the path toward $107.63, because the existing range ceiling would have been removed and sellers anchored to the prior high would be under pressure. The bear path begins if $88.00 fails and selling continues without a quick recovery. If that weakness reaches $80.65 and buyers cannot defend it, then losing $80.65 exposes $68.08 as the lower boundary of the broader range.
The main risk to the bullish interpretation is that persistent demand anxiety overwhelms supply support and turns the current pullback into a broader reversal. The bearish read would be invalidated by sustained acceptance back above $95.64, especially if supported by firmer physical demand or tighter supply expectations. Net, the longer trend remains constructive, but near-term control stays with sellers until WTI repairs the damage above its recent average.
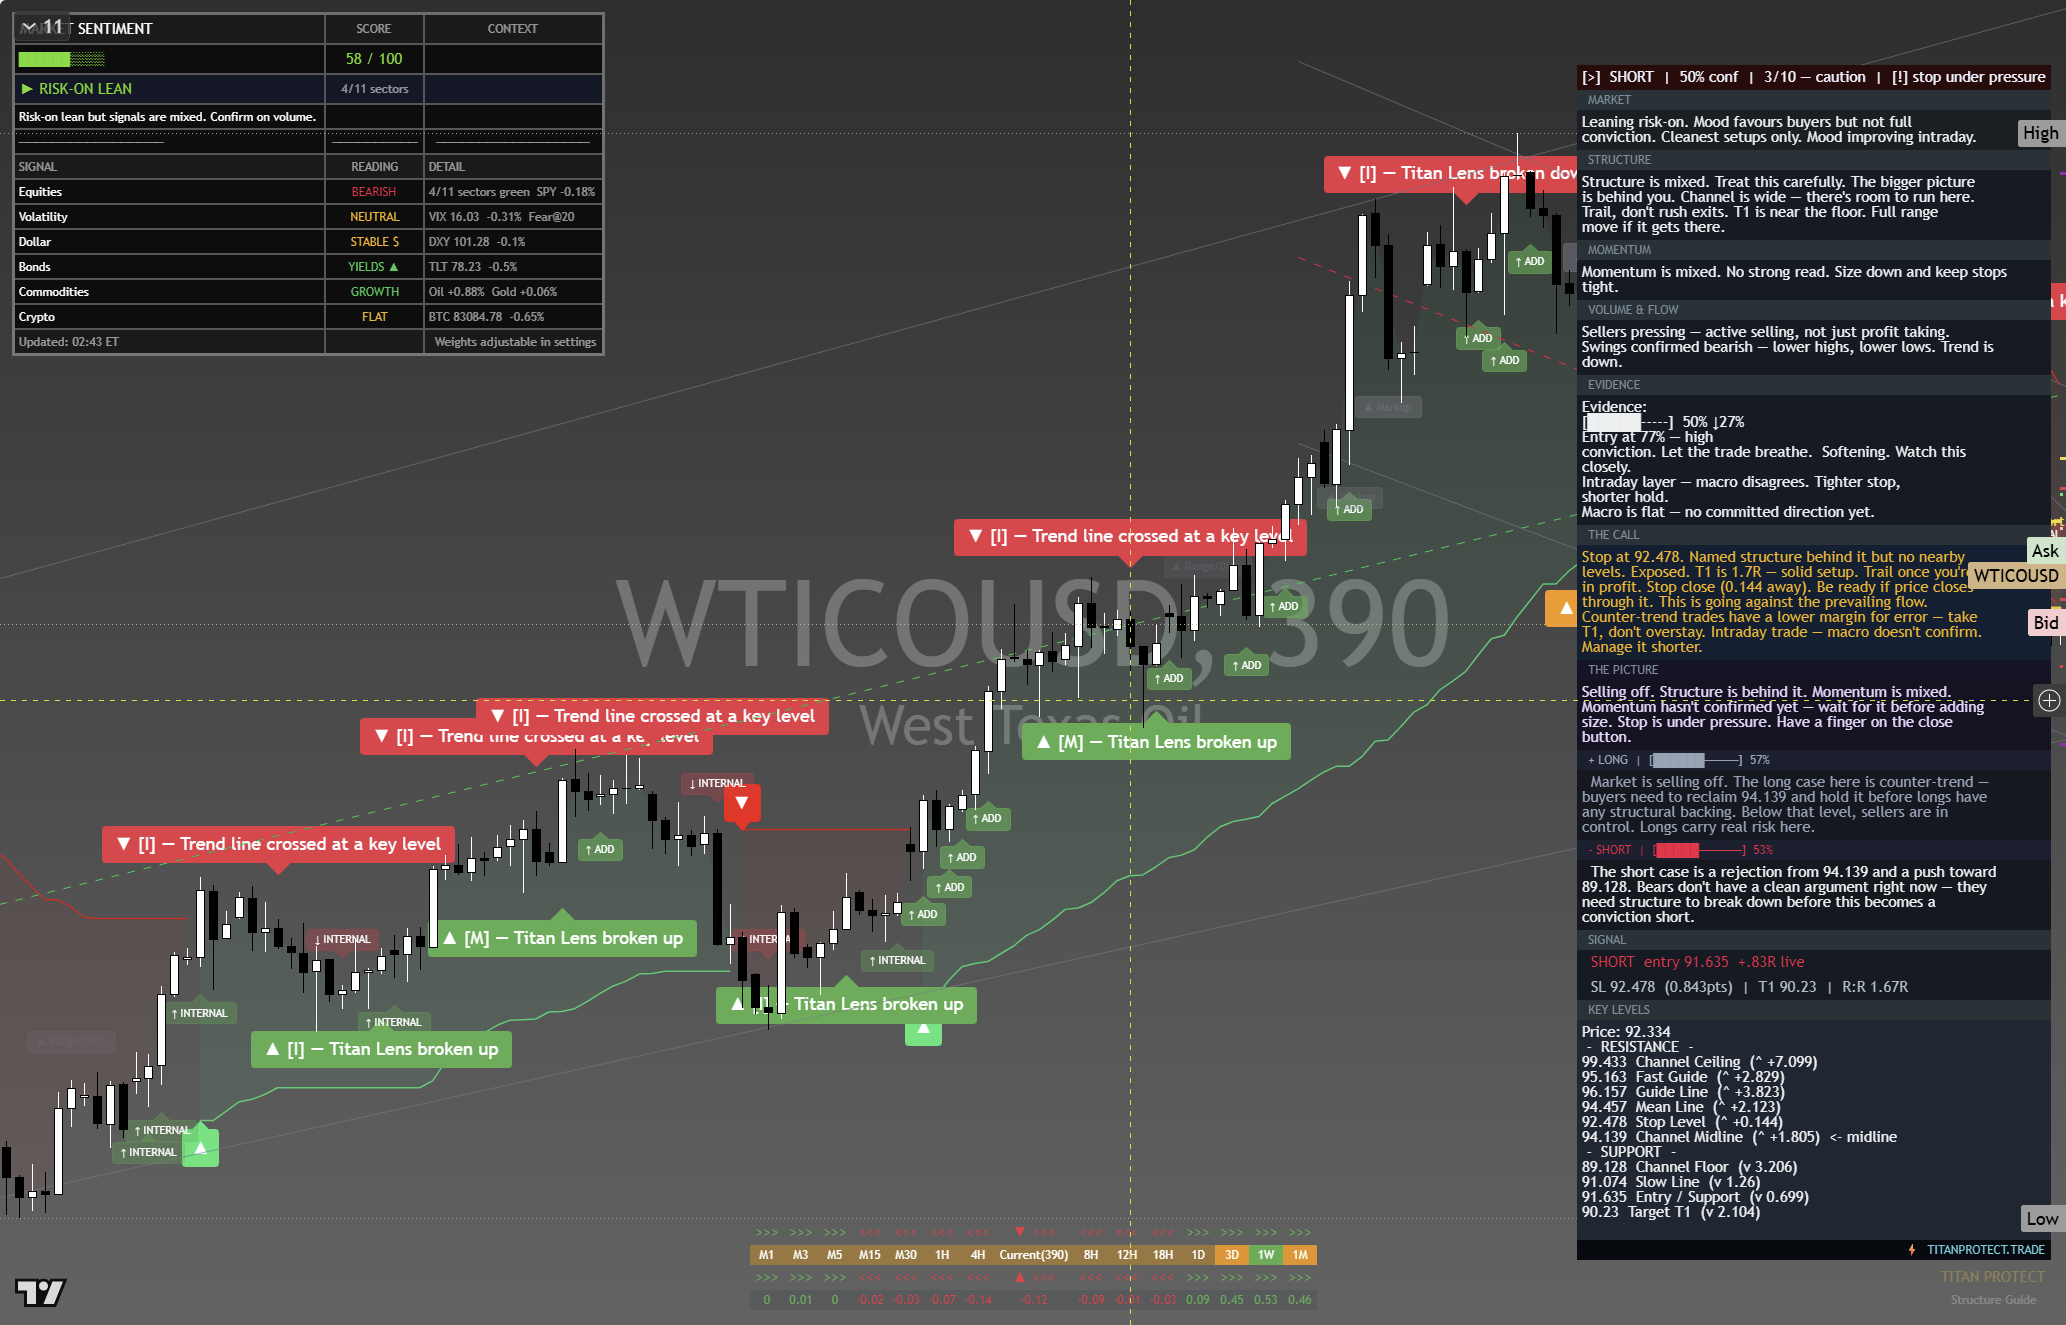
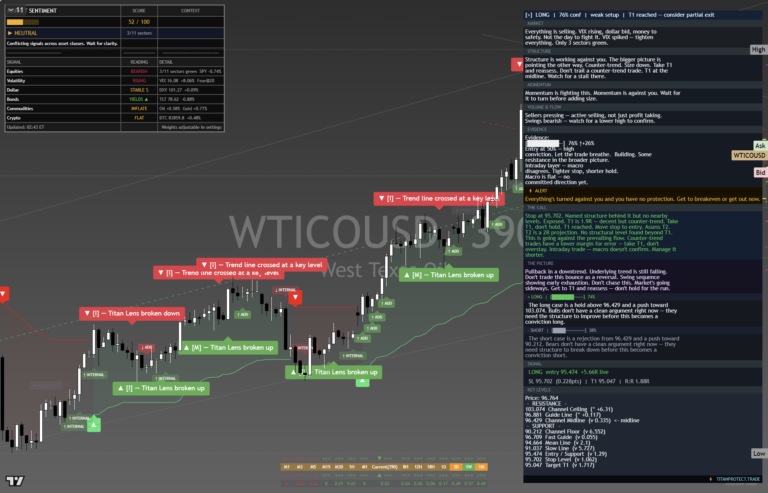
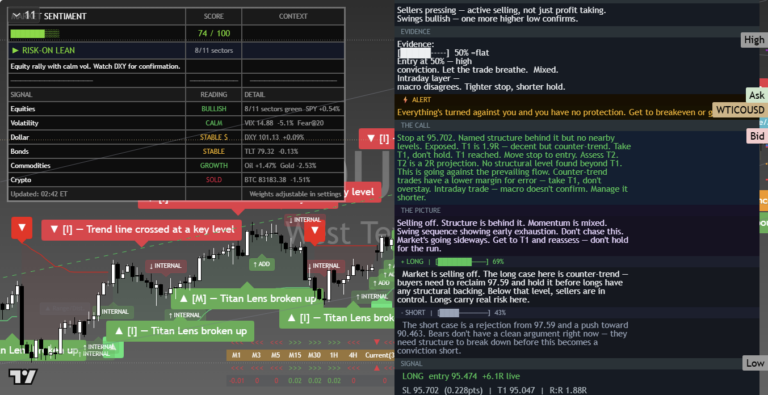
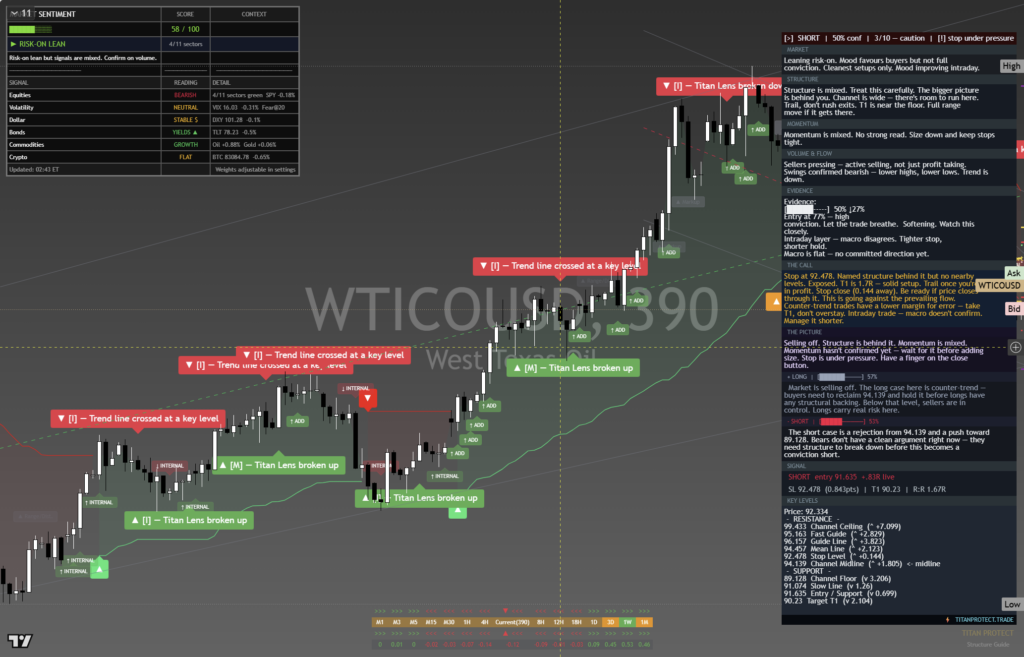
The chart above is the full daily read: structure, momentum, the levels that matter, and where the current price sits against them. Read it top to bottom for the complete picture, and pair it with our session briefs for the wider market context.
This is analysis, not financial advice. It reflects our multi-factor framework and is not a recommendation to buy or sell. Always do your own research and manage your risk.