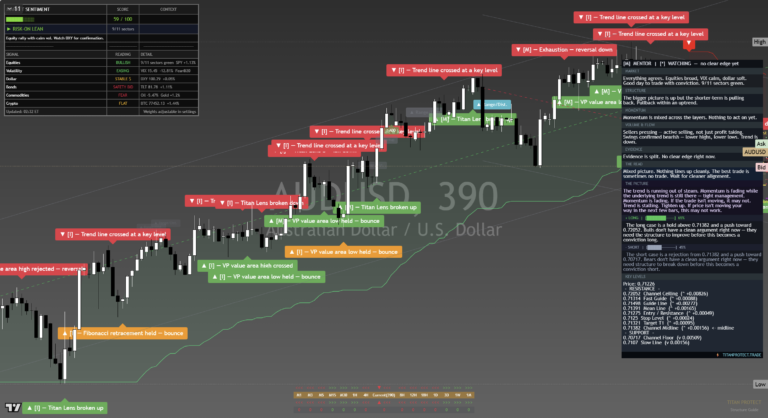
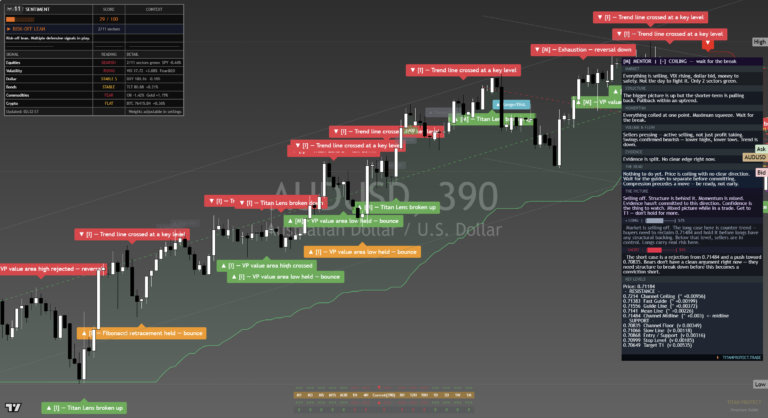
The AUDUSD Framework Journal for July 2026, newest read at the top. Each dated entry is our read on the close, kept as a living record so the framework can be judged over time. This is analysis, not financial advice.
Friday 31 Jul 2026
0.7029
The dollar sits firm as the natural pull in a week that opened with an equity wobble and a haven bid, so the crosses trade the same risk-off-versus-steadying tension the equity tape does.
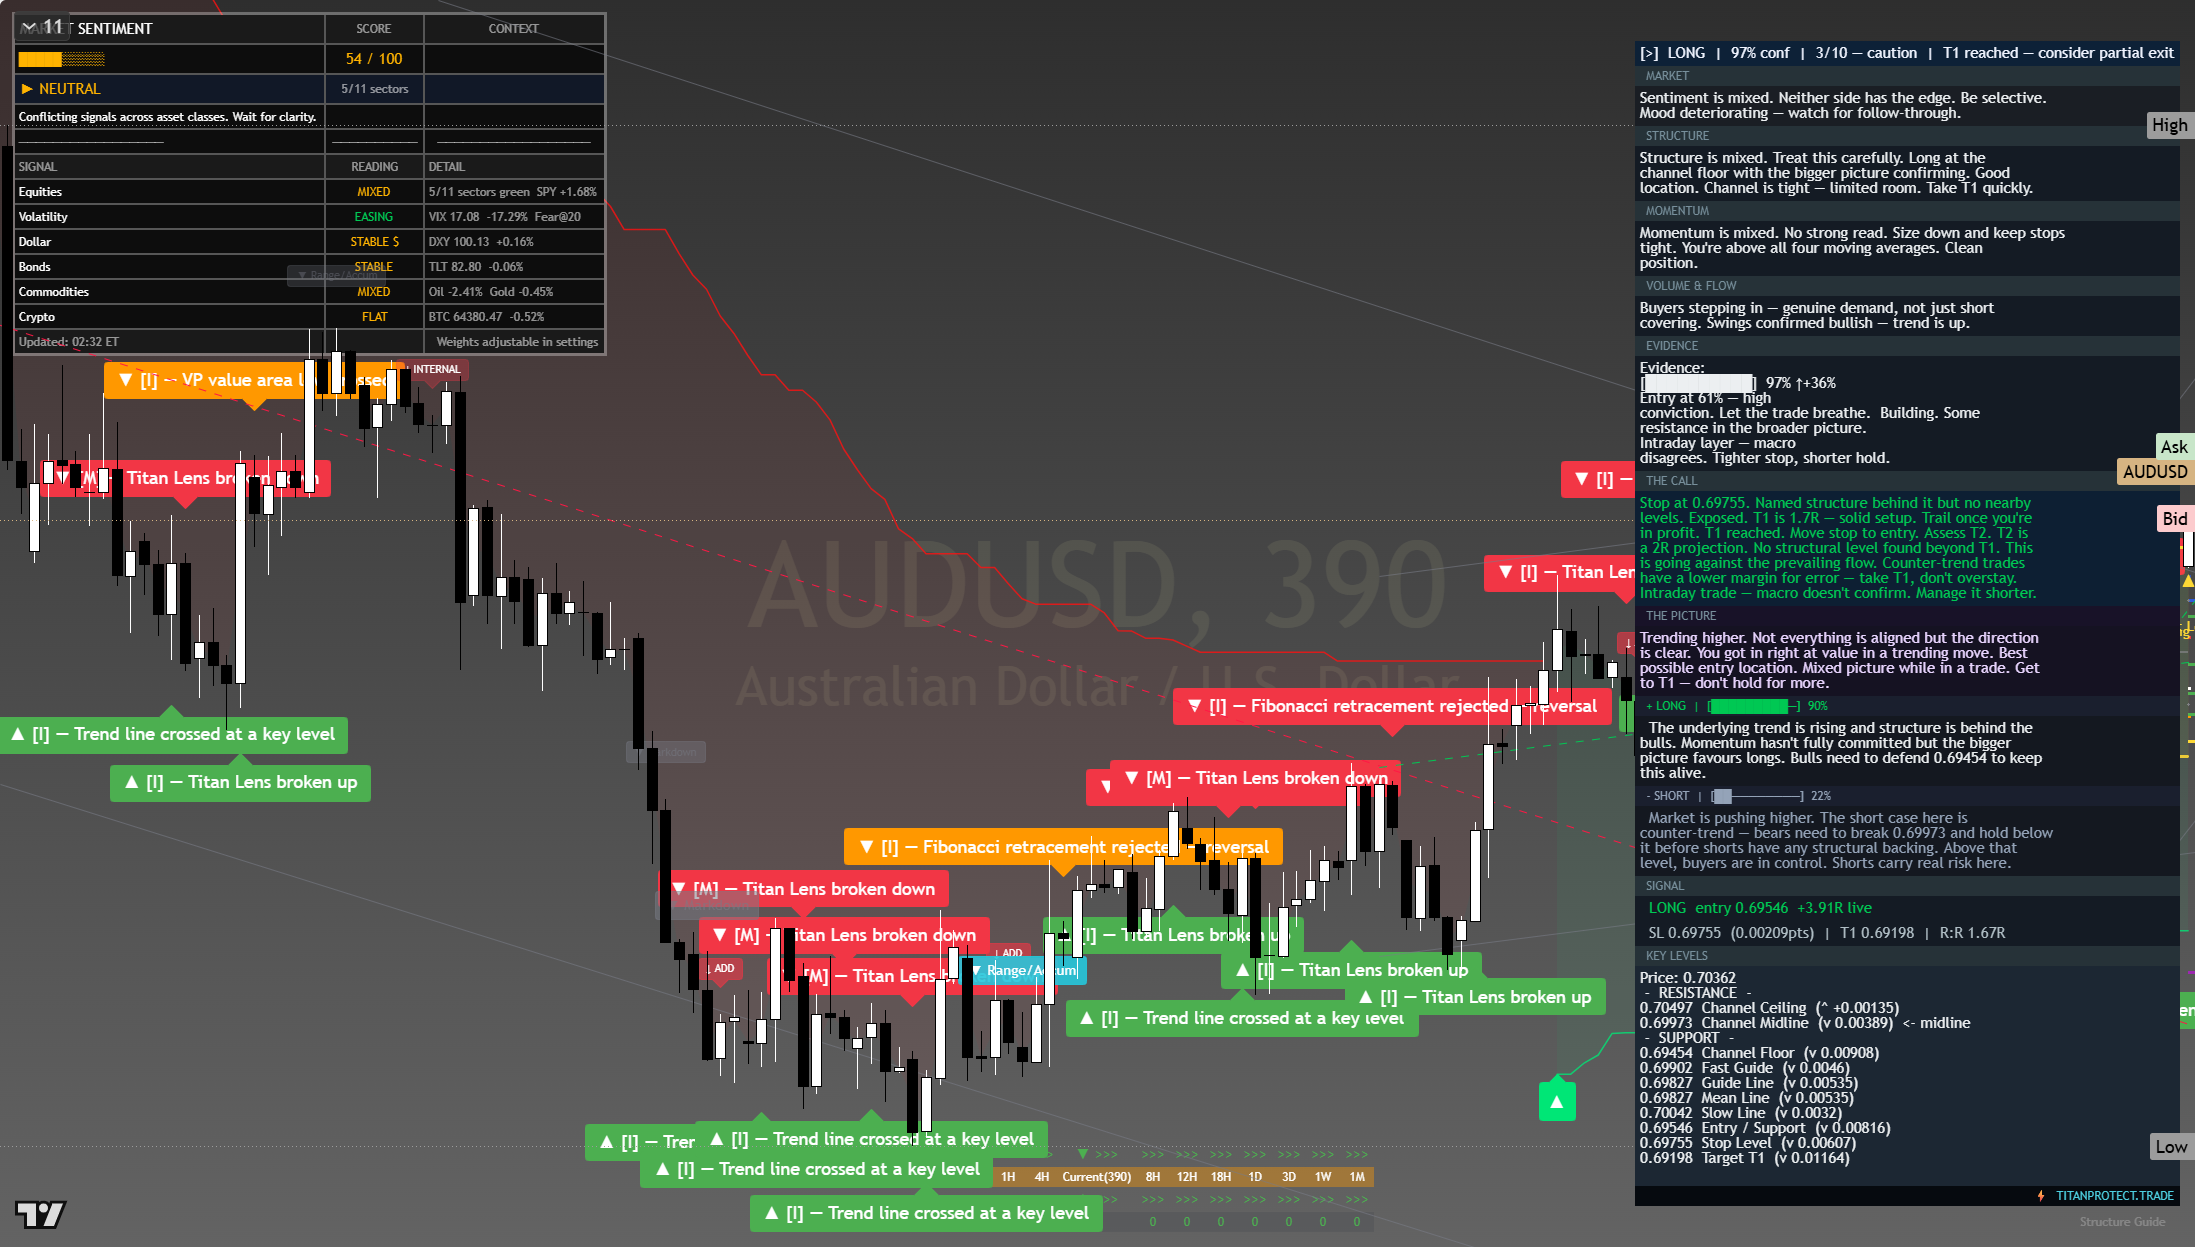
The chart above is the full daily read: structure, momentum, the levels that matter, and where the current price sits against them. Read it top to bottom for the complete picture, and pair it with our session briefs for the wider market context.
This is analysis, not financial advice. It reflects our multi-factor framework and is not a recommendation to buy or sell. Always do your own research and manage your risk.
Thursday 30 Jul 2026
0.6954
The dollar sits firm as the natural pull in a week that opened with an equity wobble and a haven bid, so the crosses trade the same risk-off-versus-steadying tension the equity tape does.
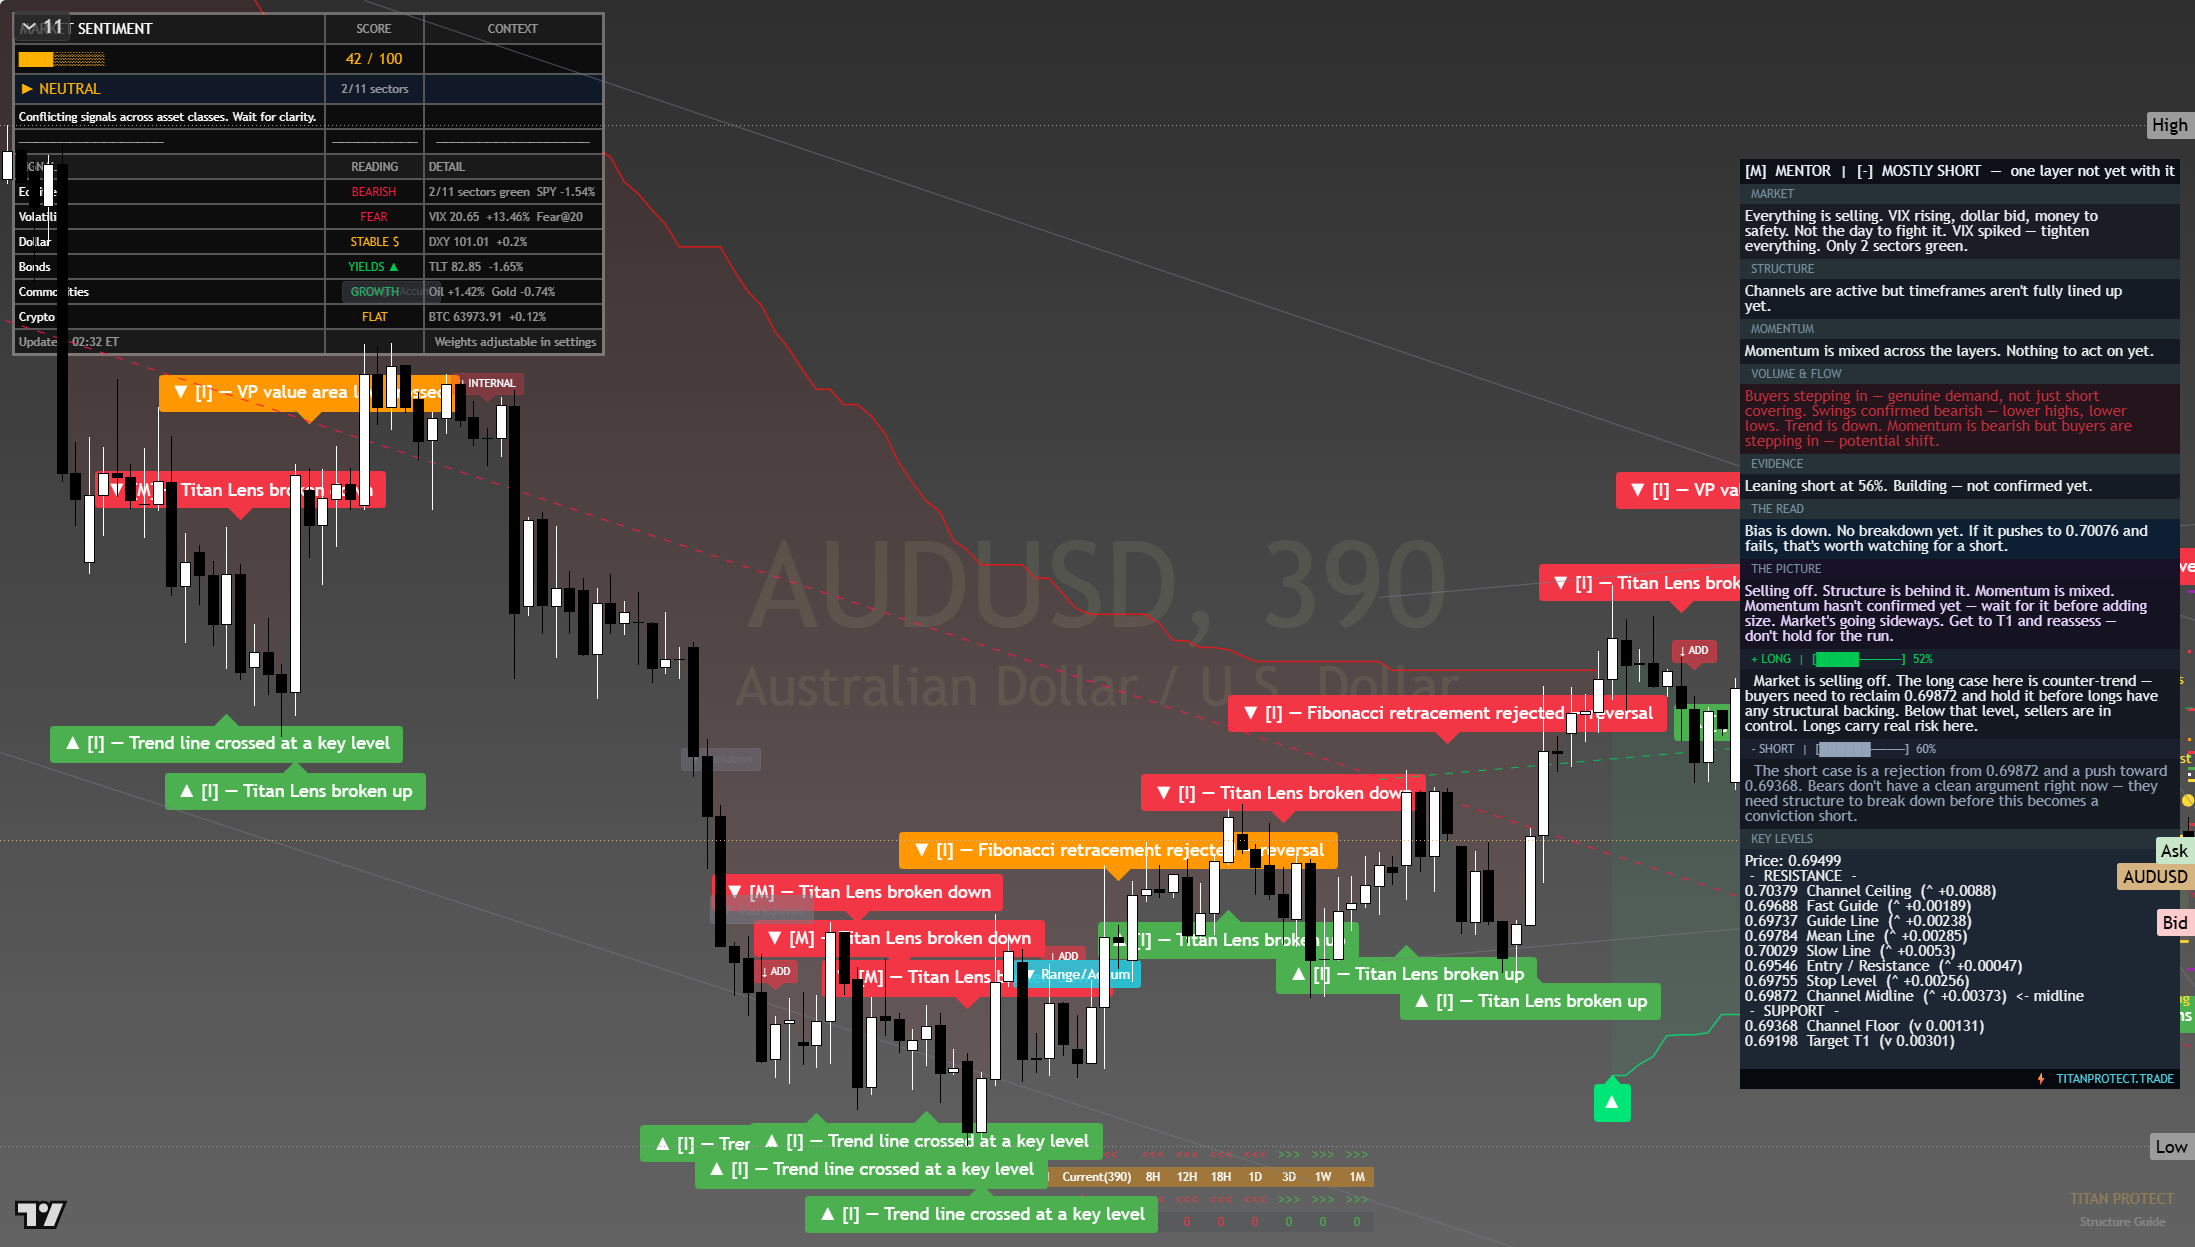
The chart above is the full daily read: structure, momentum, the levels that matter, and where the current price sits against them. Read it top to bottom for the complete picture, and pair it with our session briefs for the wider market context.
This is analysis, not financial advice. It reflects our multi-factor framework and is not a recommendation to buy or sell. Always do your own research and manage your risk.
Wednesday 29 Jul 2026
0.6954
The dollar sits firm as the natural pull in a week that opened with an equity wobble and a haven bid, so the crosses trade the same risk-off-versus-steadying tension the equity tape does.

The chart above is the full daily read: structure, momentum, the levels that matter, and where the current price sits against them. Read it top to bottom for the complete picture, and pair it with our session briefs for the wider market context.
This is analysis, not financial advice. It reflects our multi-factor framework and is not a recommendation to buy or sell. Always do your own research and manage your risk.
Tuesday 28 Jul 2026
0.6965
The dollar sits firm as the natural pull in a week that opened with an equity wobble and a haven bid, so the crosses trade the same risk-off-versus-steadying tension the equity tape does.
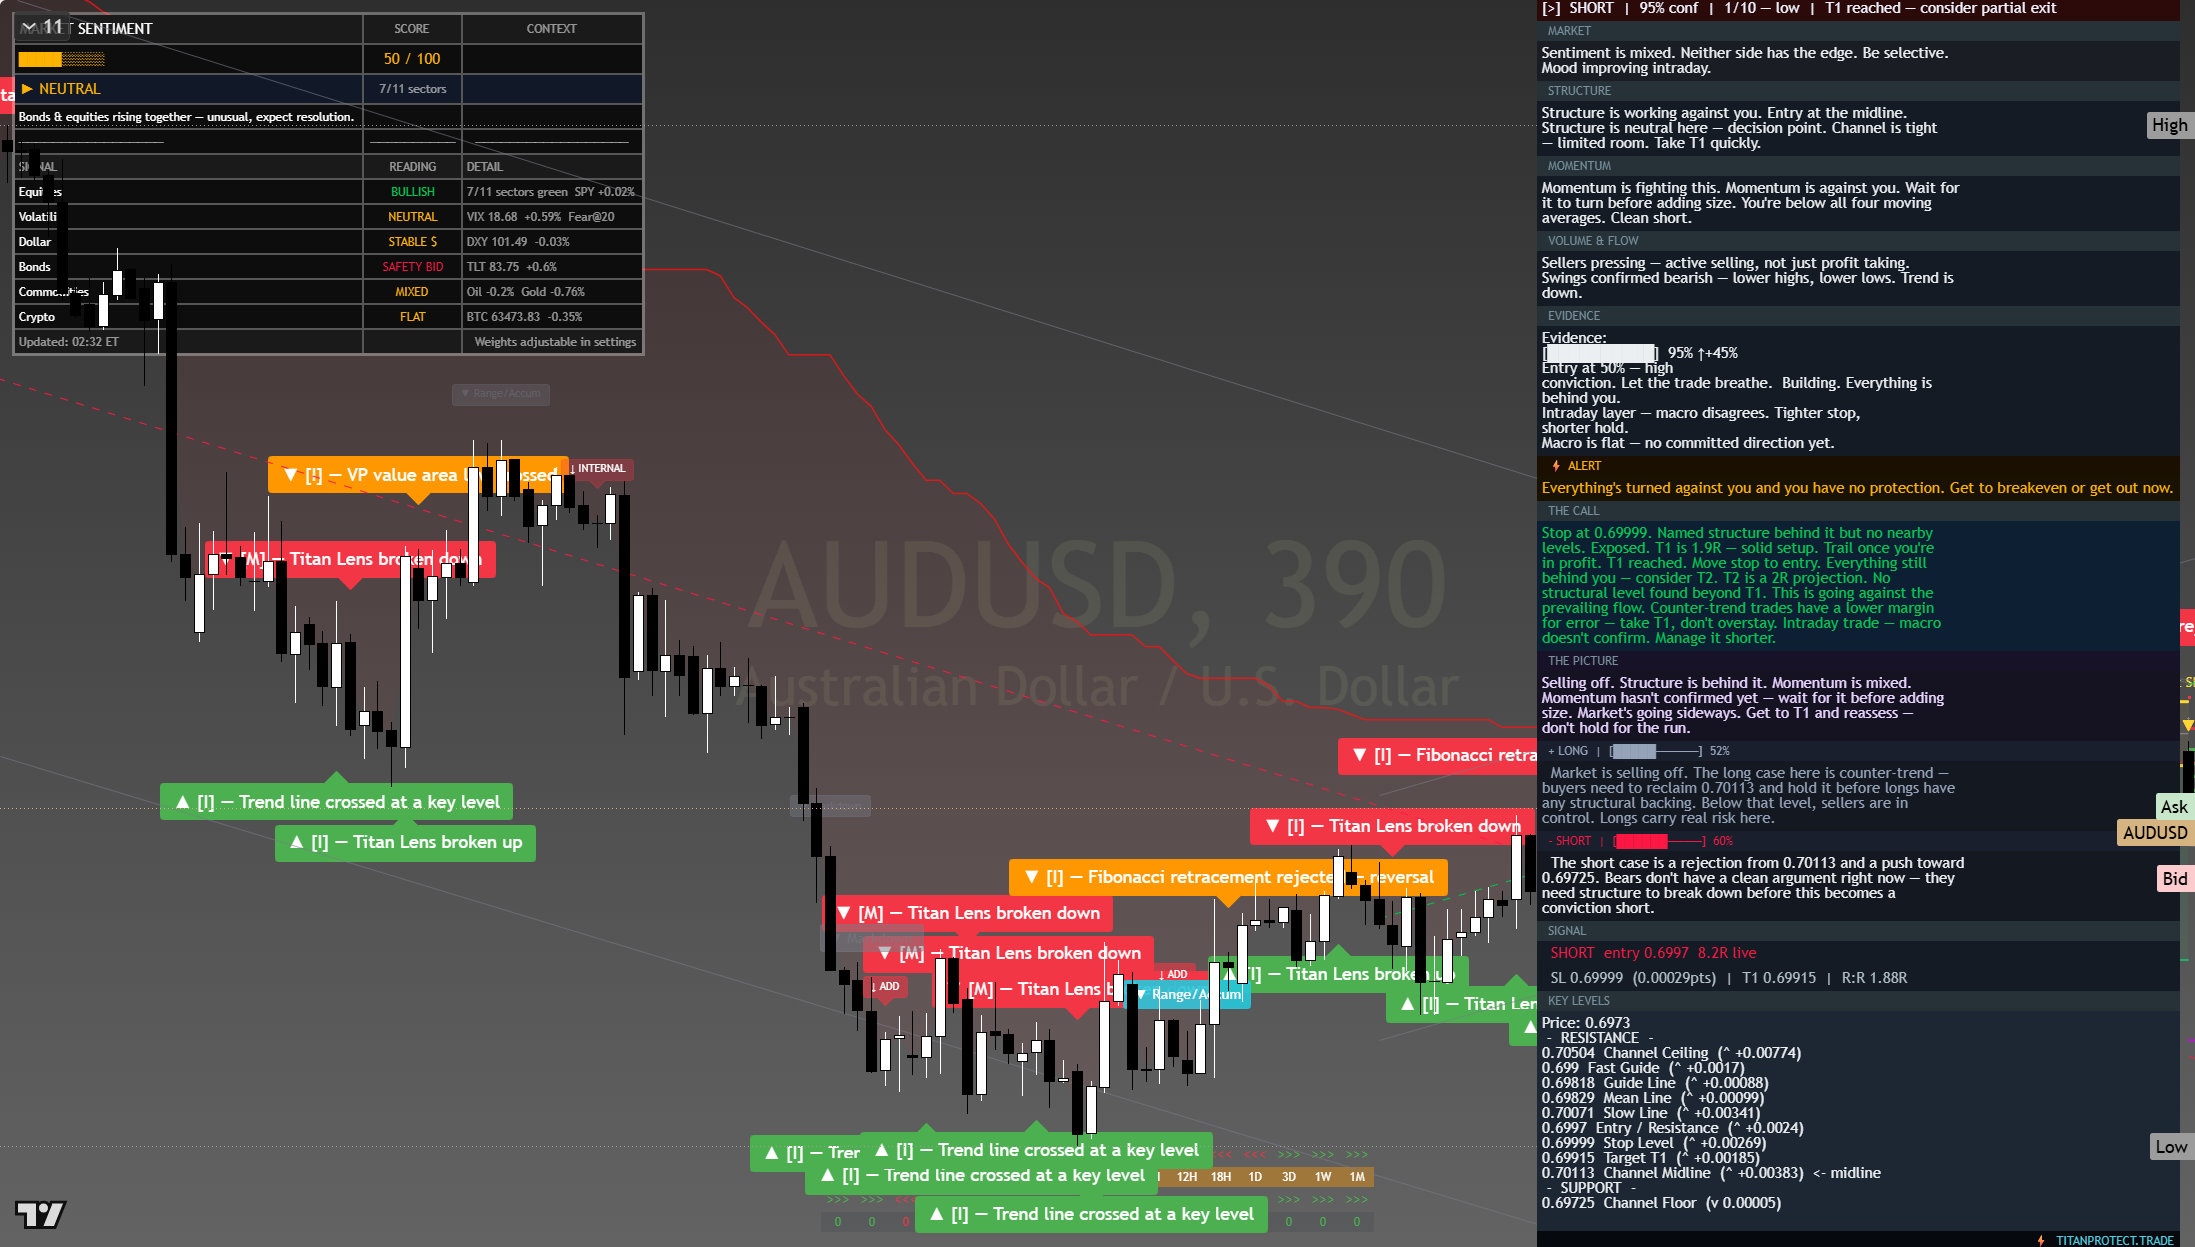
The chart above is the full daily read: structure, momentum, the levels that matter, and where the current price sits against them. Read it top to bottom for the complete picture, and pair it with our session briefs for the wider market context.
This is analysis, not financial advice. It reflects our multi-factor framework and is not a recommendation to buy or sell. Always do your own research and manage your risk.
Monday 27 Jul 2026
0.7003
The dollar sits firm as the natural pull in a week that opened with an equity wobble and a haven bid, so the crosses trade the same risk-off-versus-steadying tension the equity tape does.
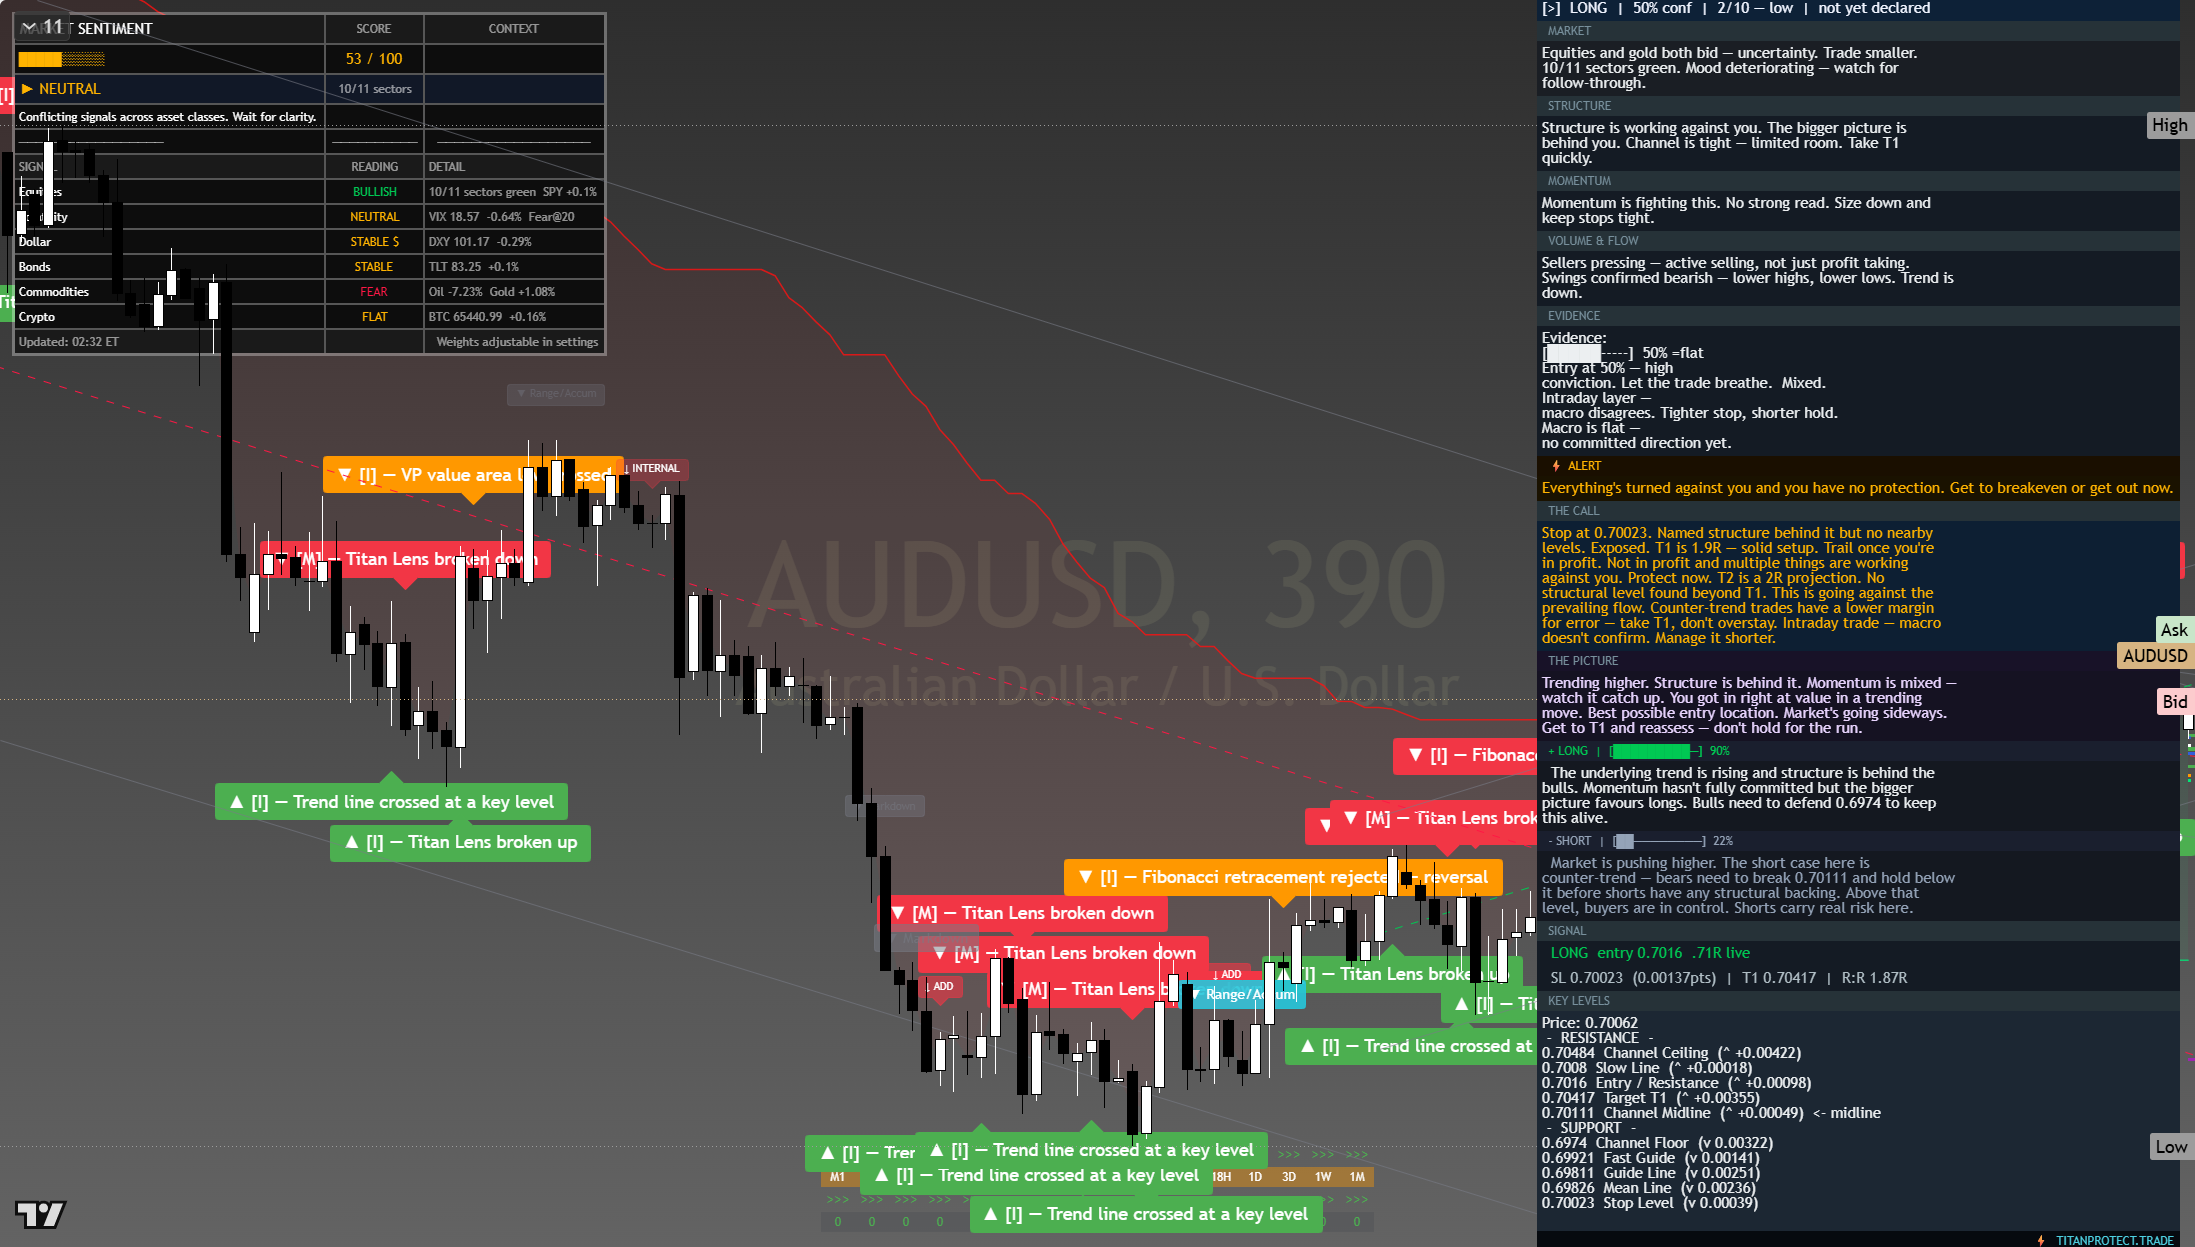
The chart above is the full daily read: structure, momentum, the levels that matter, and where the current price sits against them. Read it top to bottom for the complete picture, and pair it with our session briefs for the wider market context.
This is analysis, not financial advice. It reflects our multi-factor framework and is not a recommendation to buy or sell. Always do your own research and manage your risk.
Sunday 26 Jul 2026
0.6984
The dollar sits firm as the natural pull in a week that opened with an equity wobble and a haven bid, so the crosses trade the same risk-off-versus-steadying tension the equity tape does.
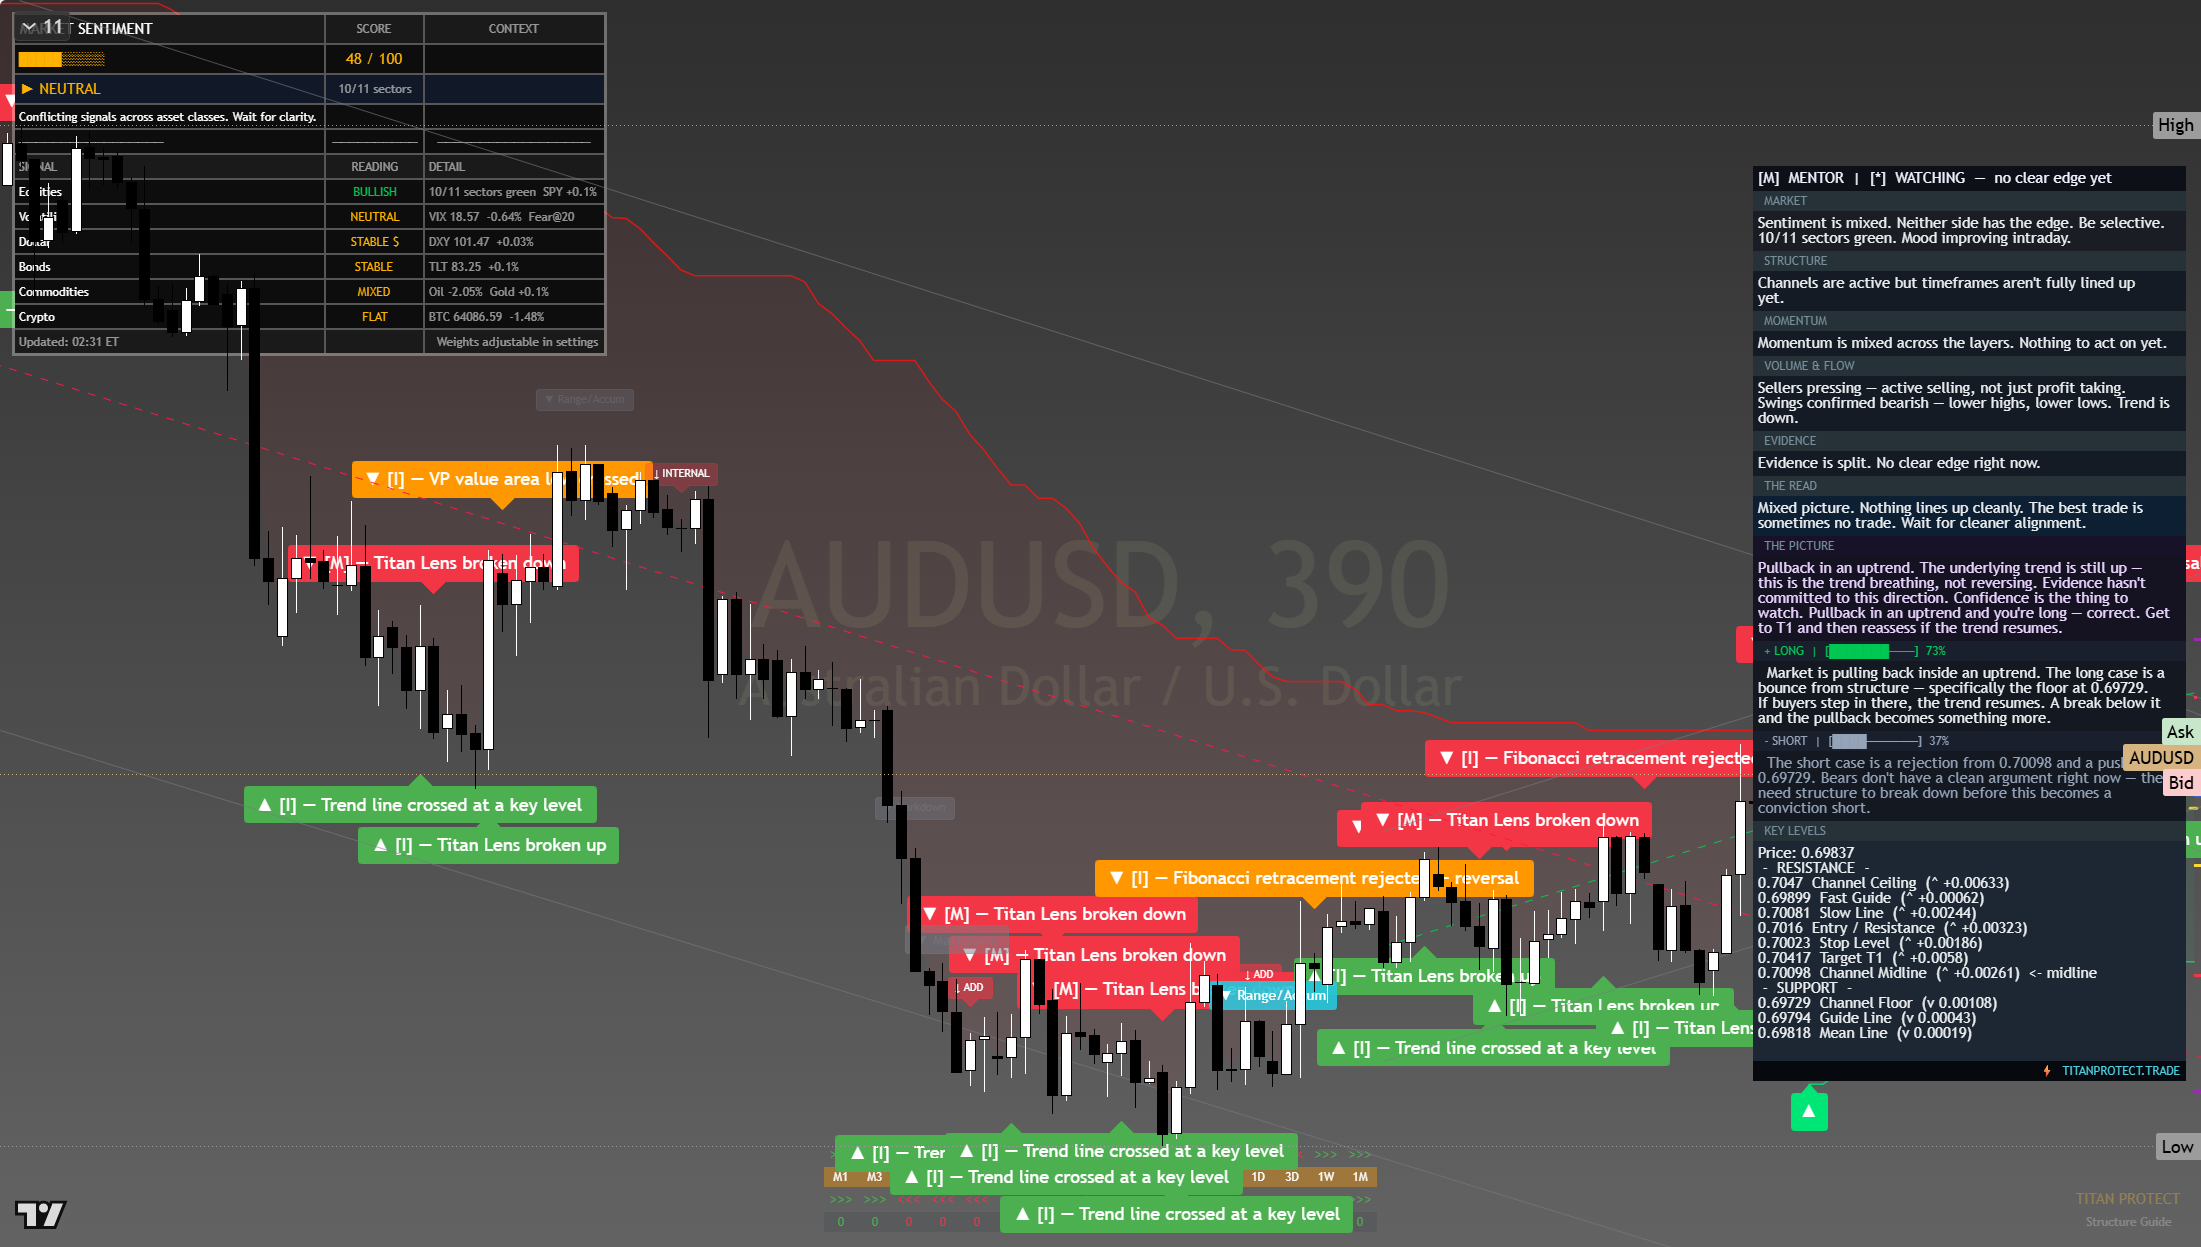
The chart above is the full daily read: structure, momentum, the levels that matter, and where the current price sits against them. Read it top to bottom for the complete picture, and pair it with our session briefs for the wider market context.
This is analysis, not financial advice. It reflects our multi-factor framework and is not a recommendation to buy or sell. Always do your own research and manage your risk.
Saturday 25 Jul 2026
0.6984
The dollar sits firm as the natural pull in a week that opened with an equity wobble and a haven bid, so the crosses trade the same risk-off-versus-steadying tension the equity tape does.
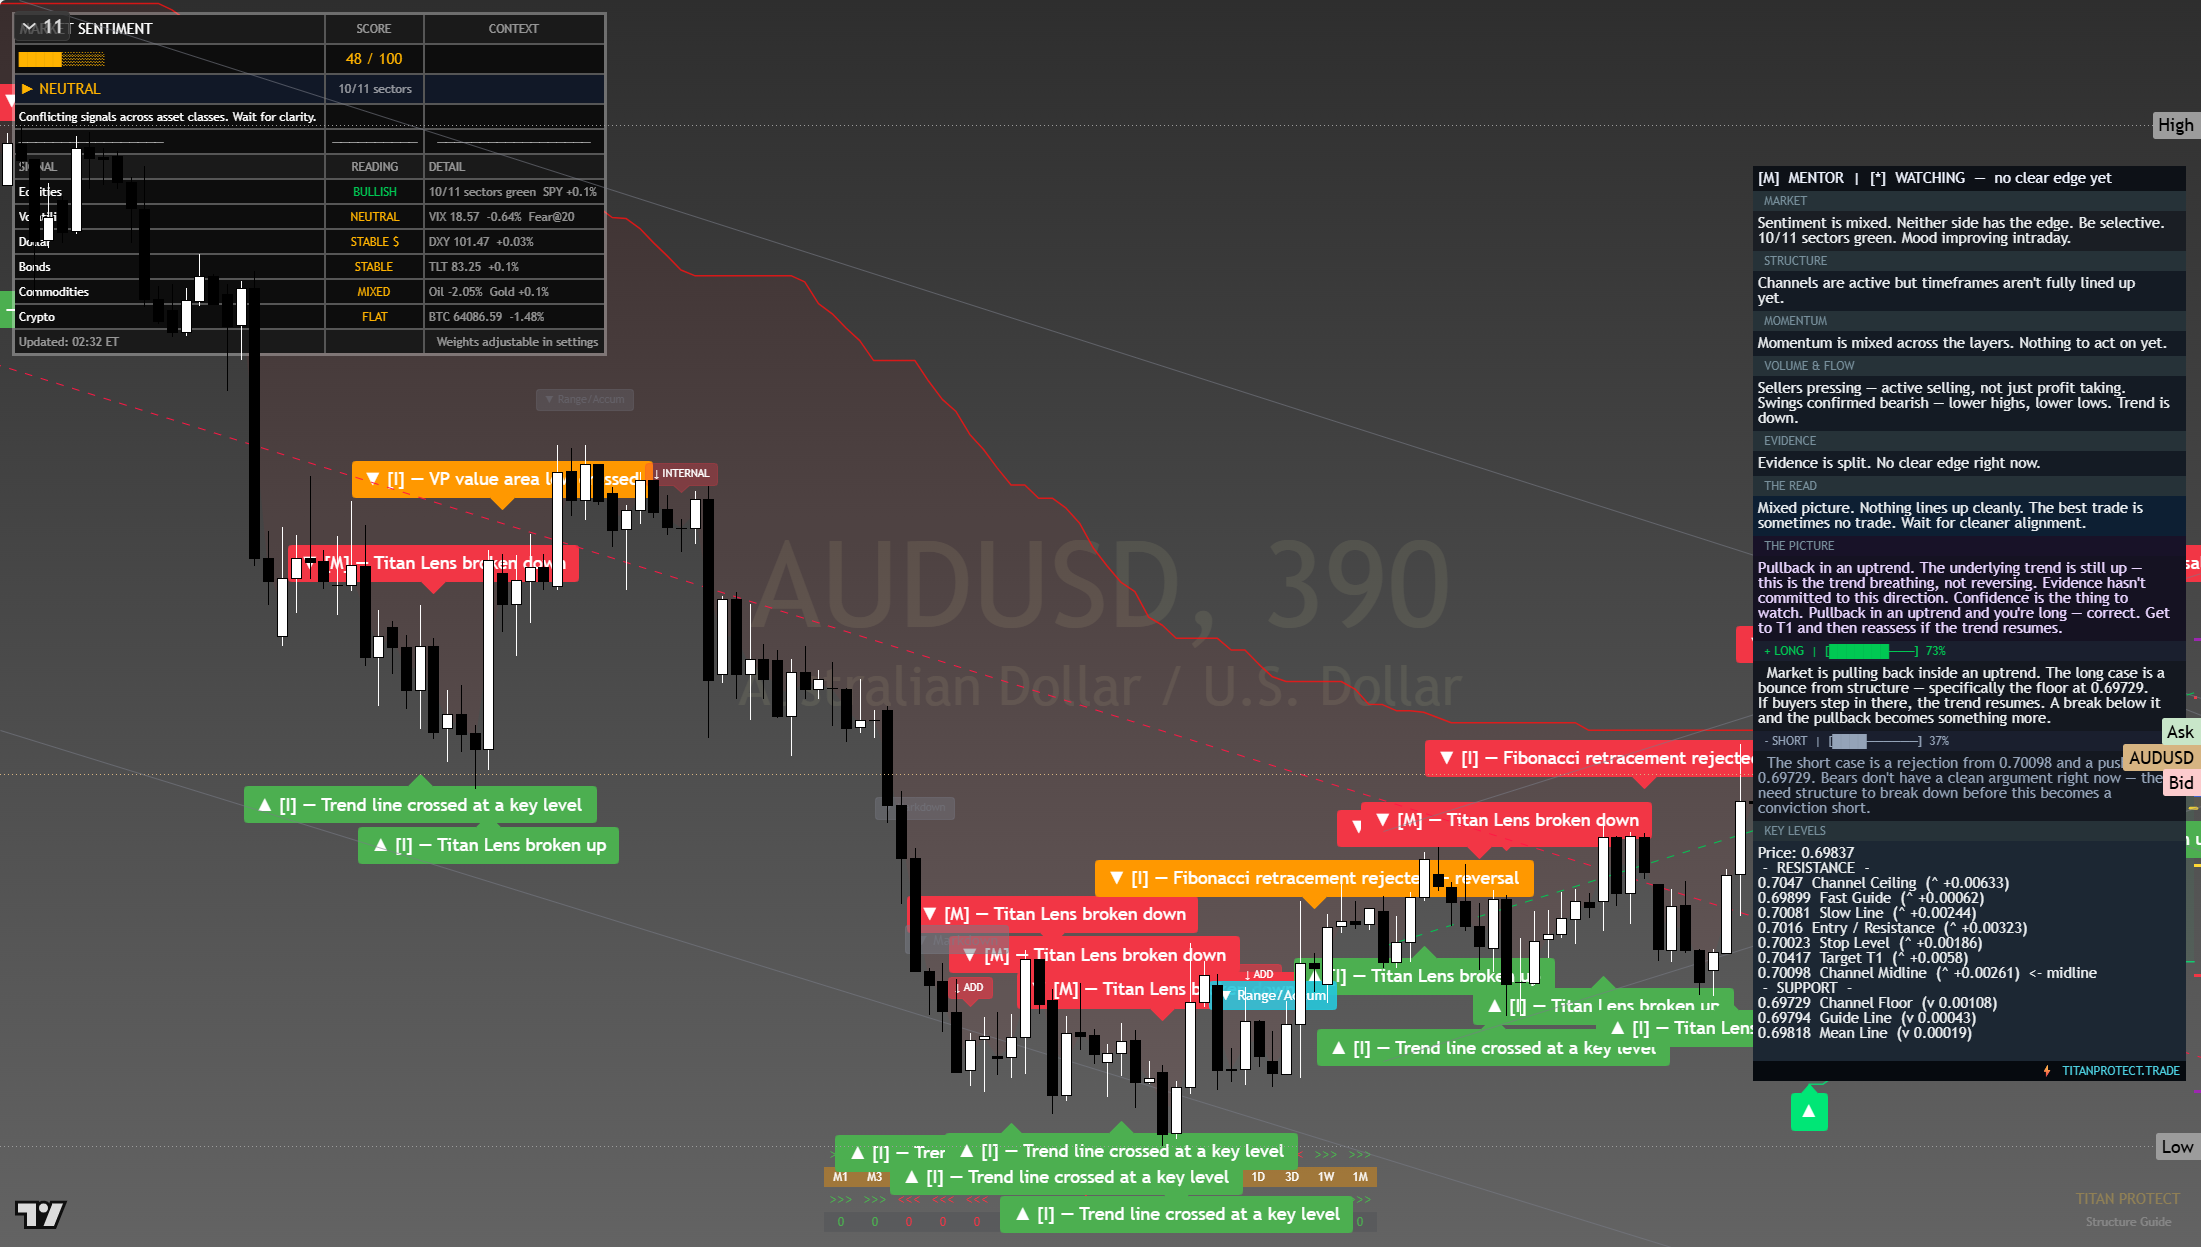
The chart above is the full daily read: structure, momentum, the levels that matter, and where the current price sits against them. Read it top to bottom for the complete picture, and pair it with our session briefs for the wider market context.
This is analysis, not financial advice. It reflects our multi-factor framework and is not a recommendation to buy or sell. Always do your own research and manage your risk.
Friday 24 Jul 2026
0.6978
The dollar sits firm as the natural pull in a week that opened with an equity wobble and a haven bid, so the crosses trade the same risk-off-versus-steadying tension the equity tape does.
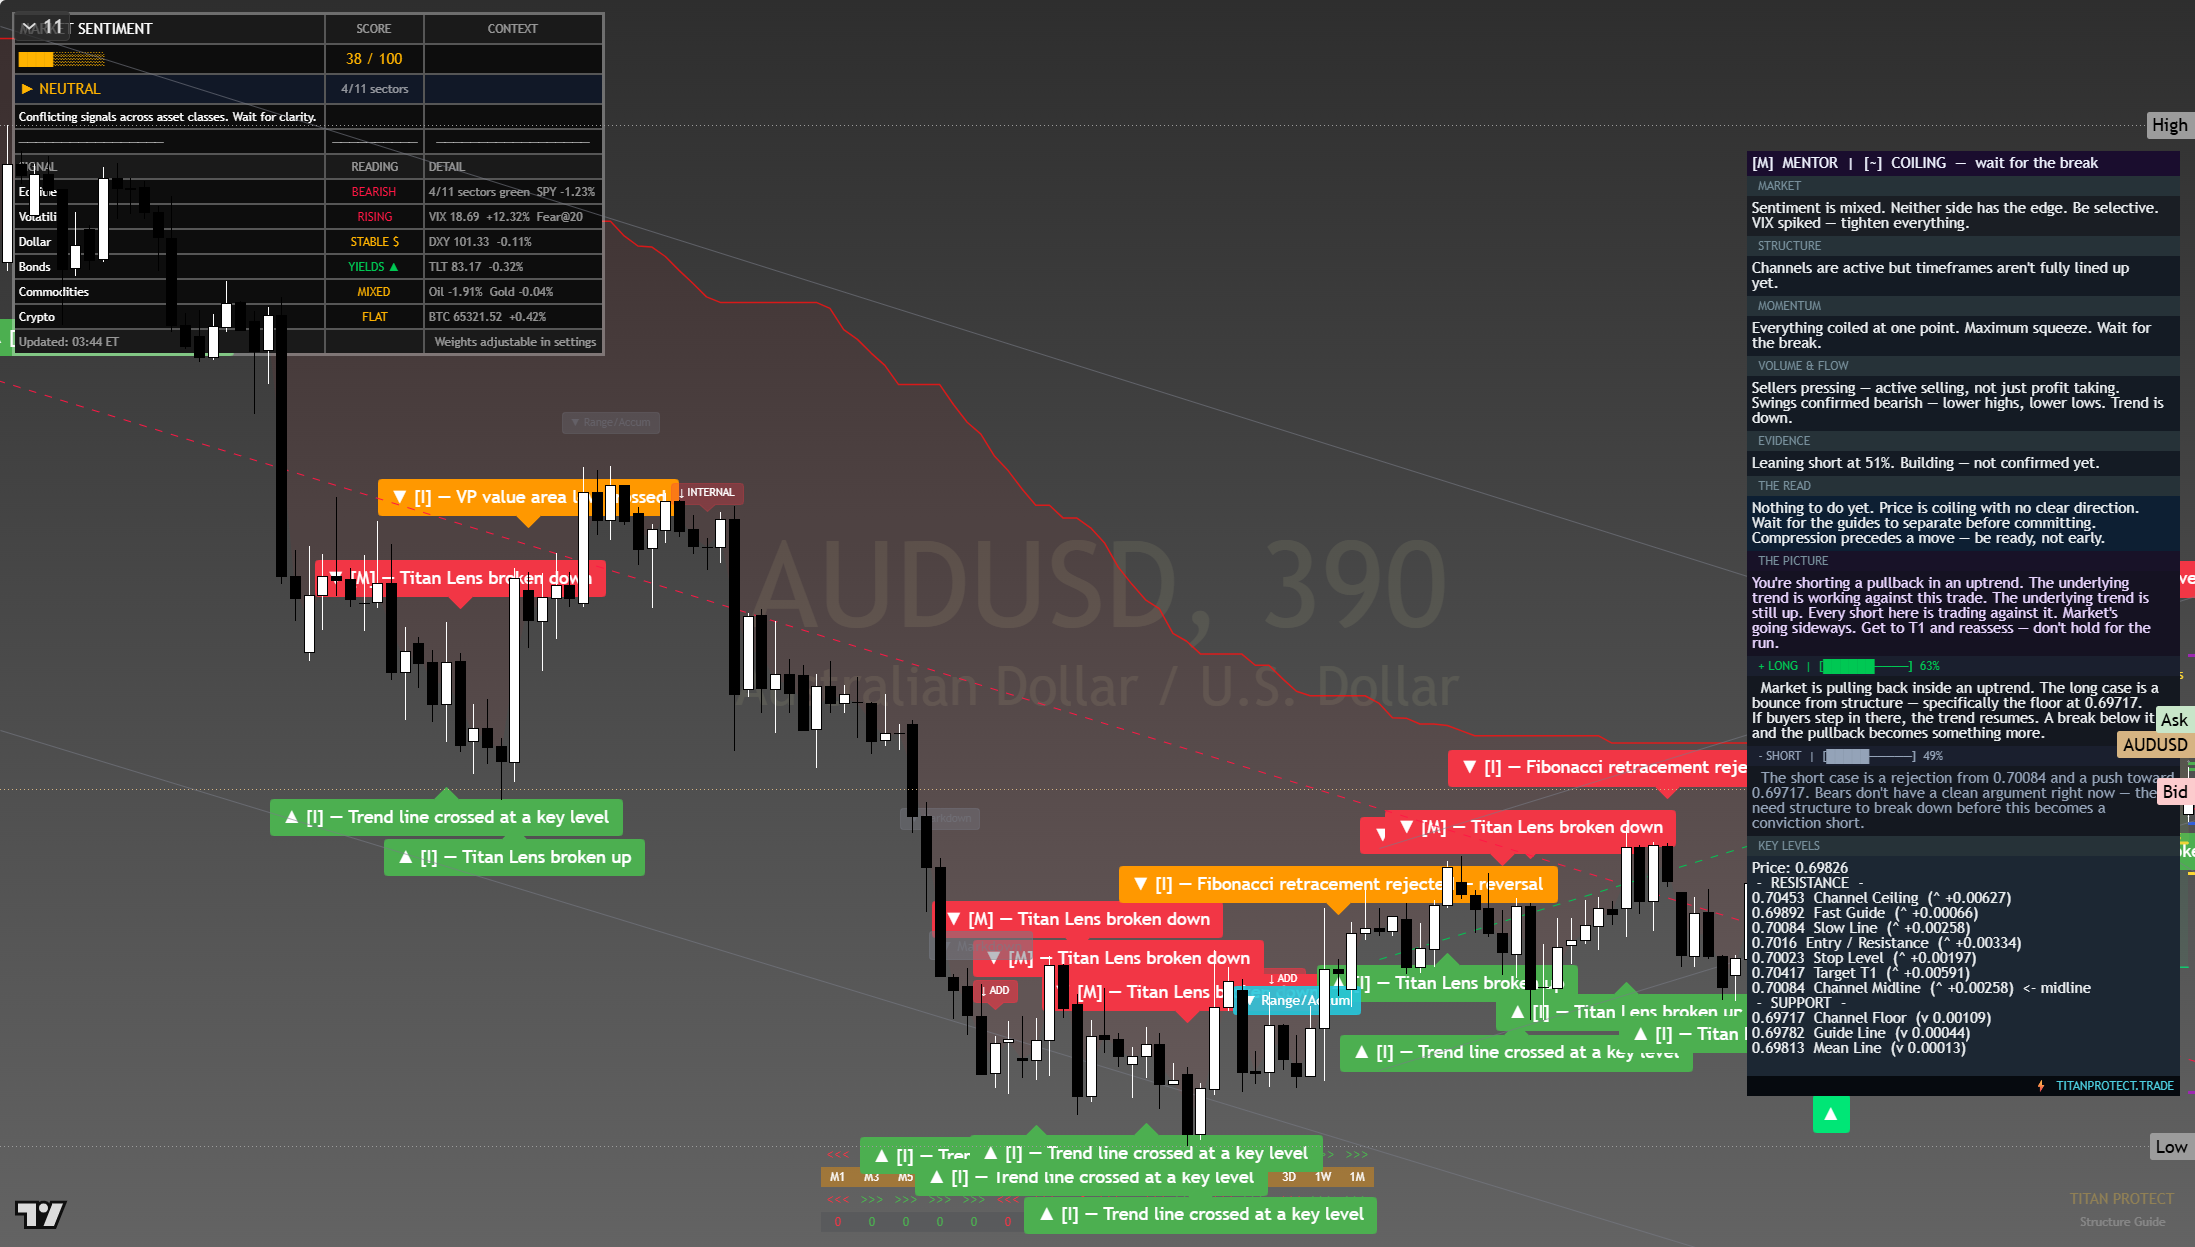
The chart above is the full daily read: structure, momentum, the levels that matter, and where the current price sits against them. Read it top to bottom for the complete picture, and pair it with our session briefs for the wider market context.
This is analysis, not financial advice. It reflects our multi-factor framework and is not a recommendation to buy or sell. Always do your own research and manage your risk.
Thursday 23 Jul 2026
0.6984
The dollar sits firm as the natural pull in a week that opened with an equity wobble and a haven bid, so the crosses trade the same risk-off-versus-steadying tension the equity tape does.
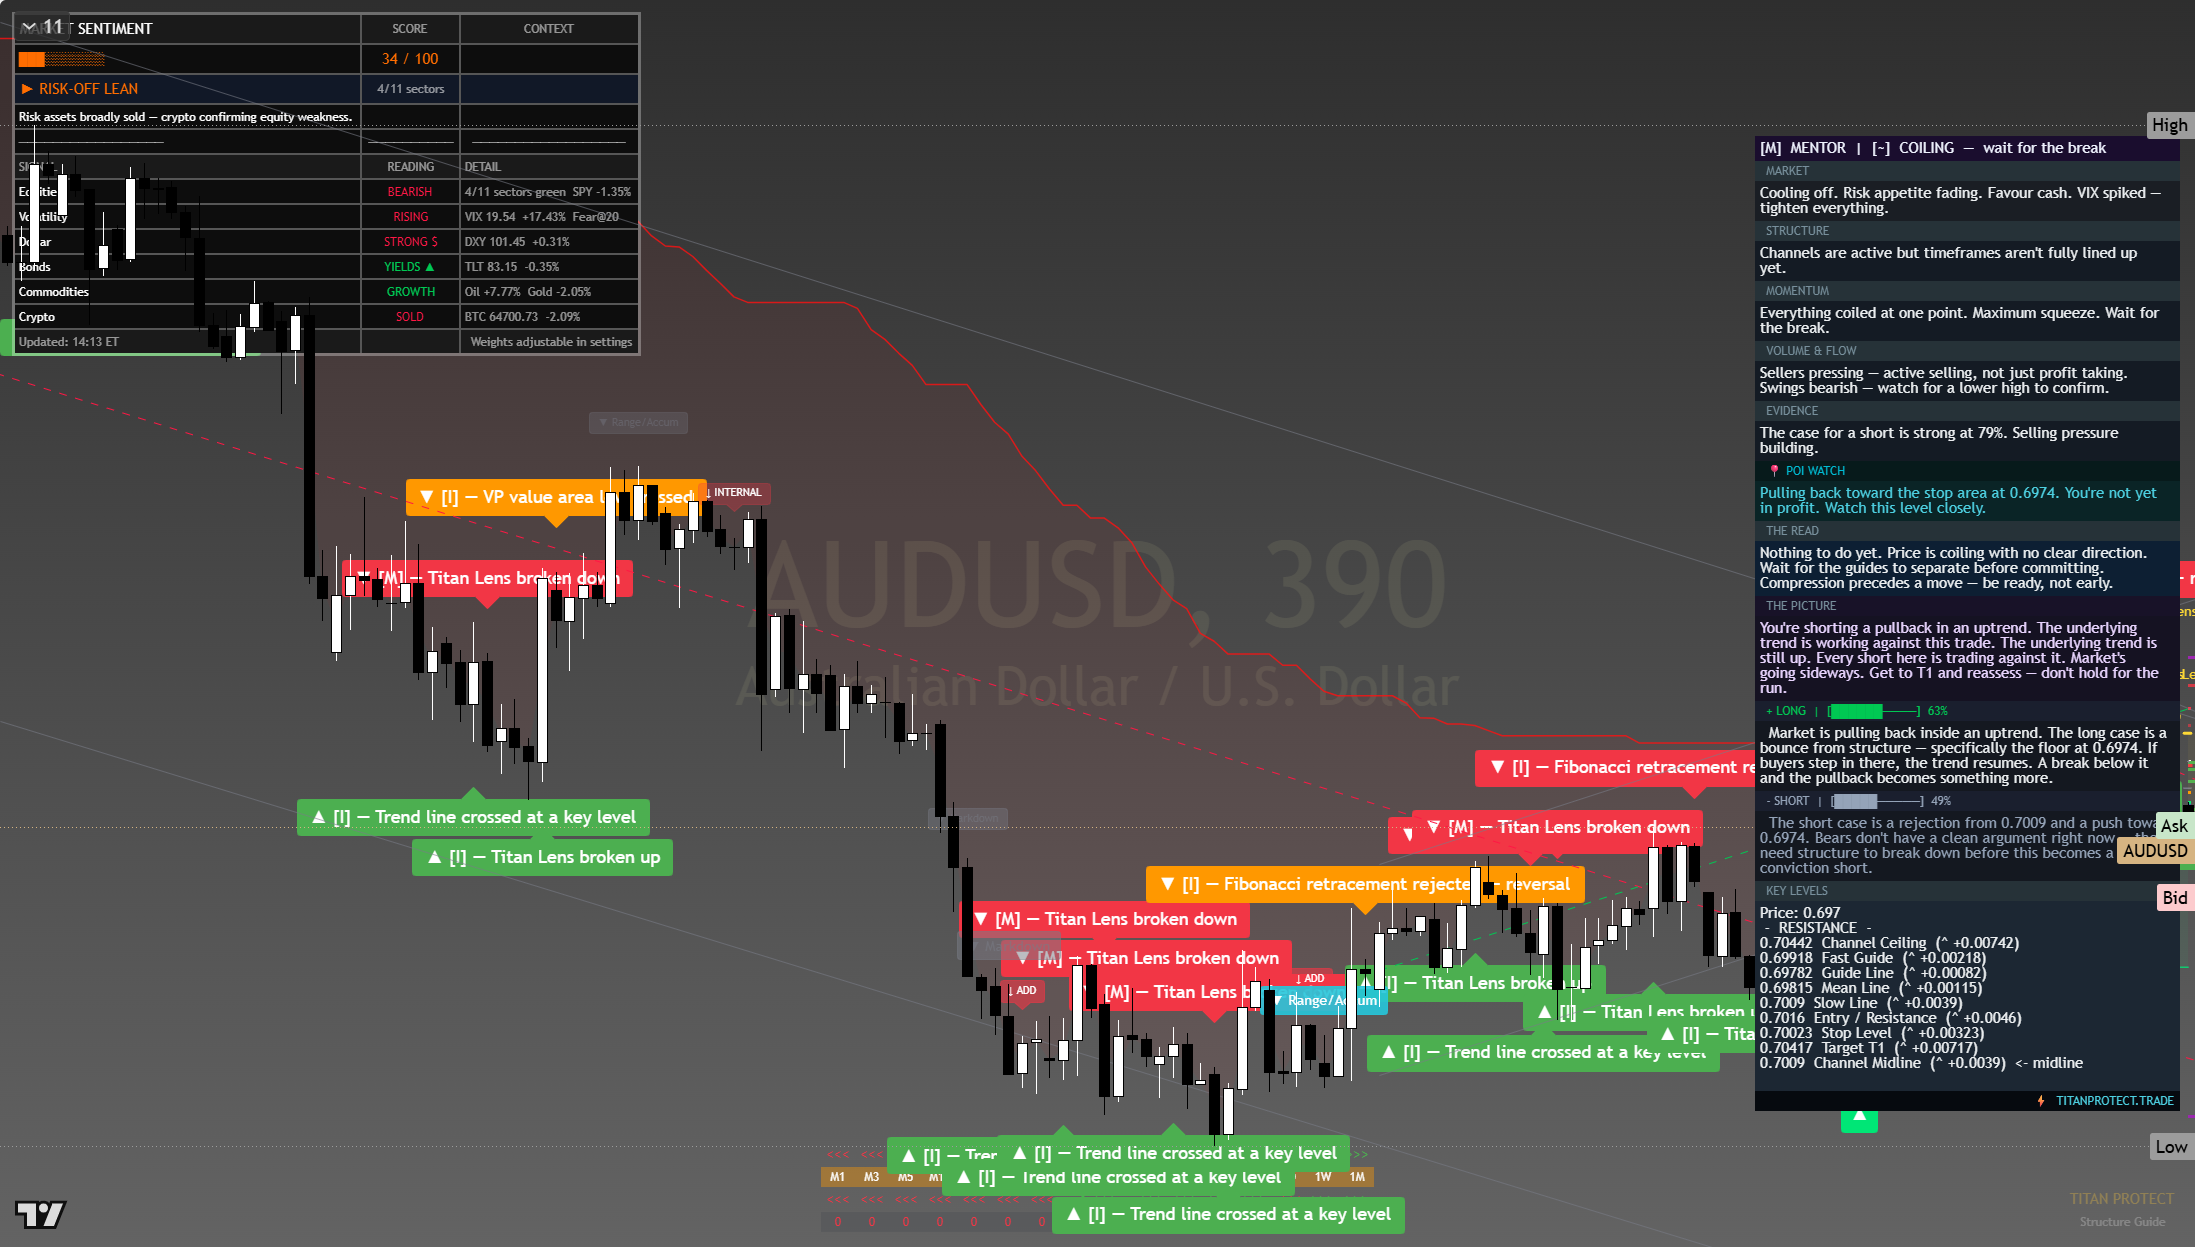
The chart above is the full daily read: structure, momentum, the levels that matter, and where the current price sits against them. Read it top to bottom for the complete picture, and pair it with our session briefs for the wider market context.
This is analysis, not financial advice. It reflects our multi-factor framework and is not a recommendation to buy or sell. Always do your own research and manage your risk.
Wednesday 22 Jul 2026
0.6999
The dollar sits firm as the natural pull in a week that opened with an equity wobble and a haven bid, so the crosses trade the same risk-off-versus-steadying tension the equity tape does.
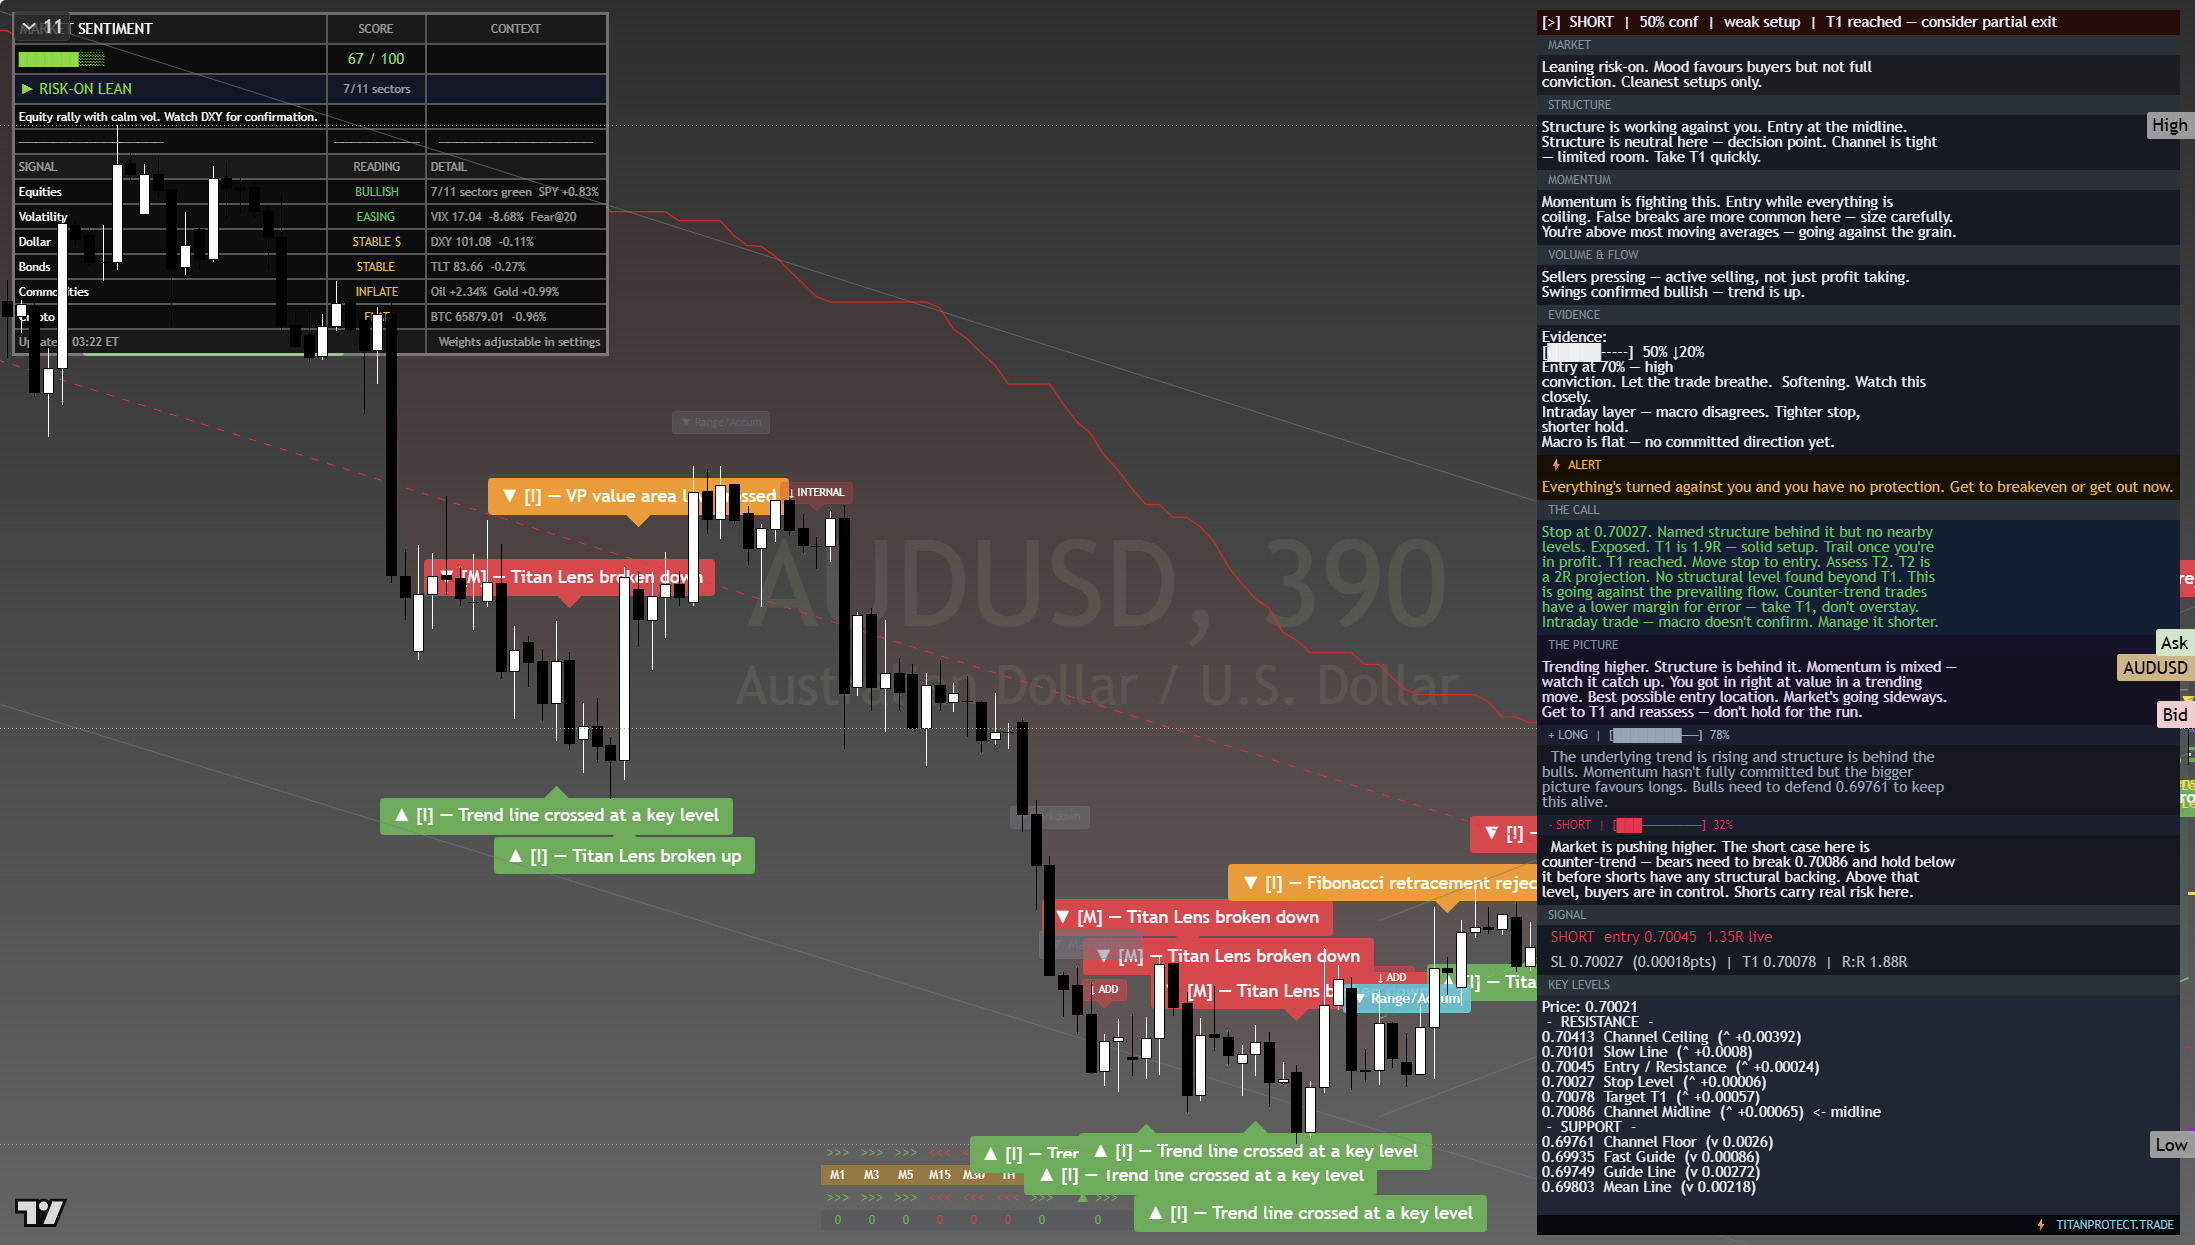
The chart above is the full daily read: structure, momentum, the levels that matter, and where the current price sits against them. Read it top to bottom for the complete picture, and pair it with our session briefs for the wider market context.
This is analysis, not financial advice. It reflects our multi-factor framework and is not a recommendation to buy or sell. Always do your own research and manage your risk.
Monday 20 Jul 2026
0.6988
The dollar sits firm as the natural pull in a week that opened with an equity wobble and a haven bid, so the crosses trade the same risk-off-versus-steadying tension the equity tape does.
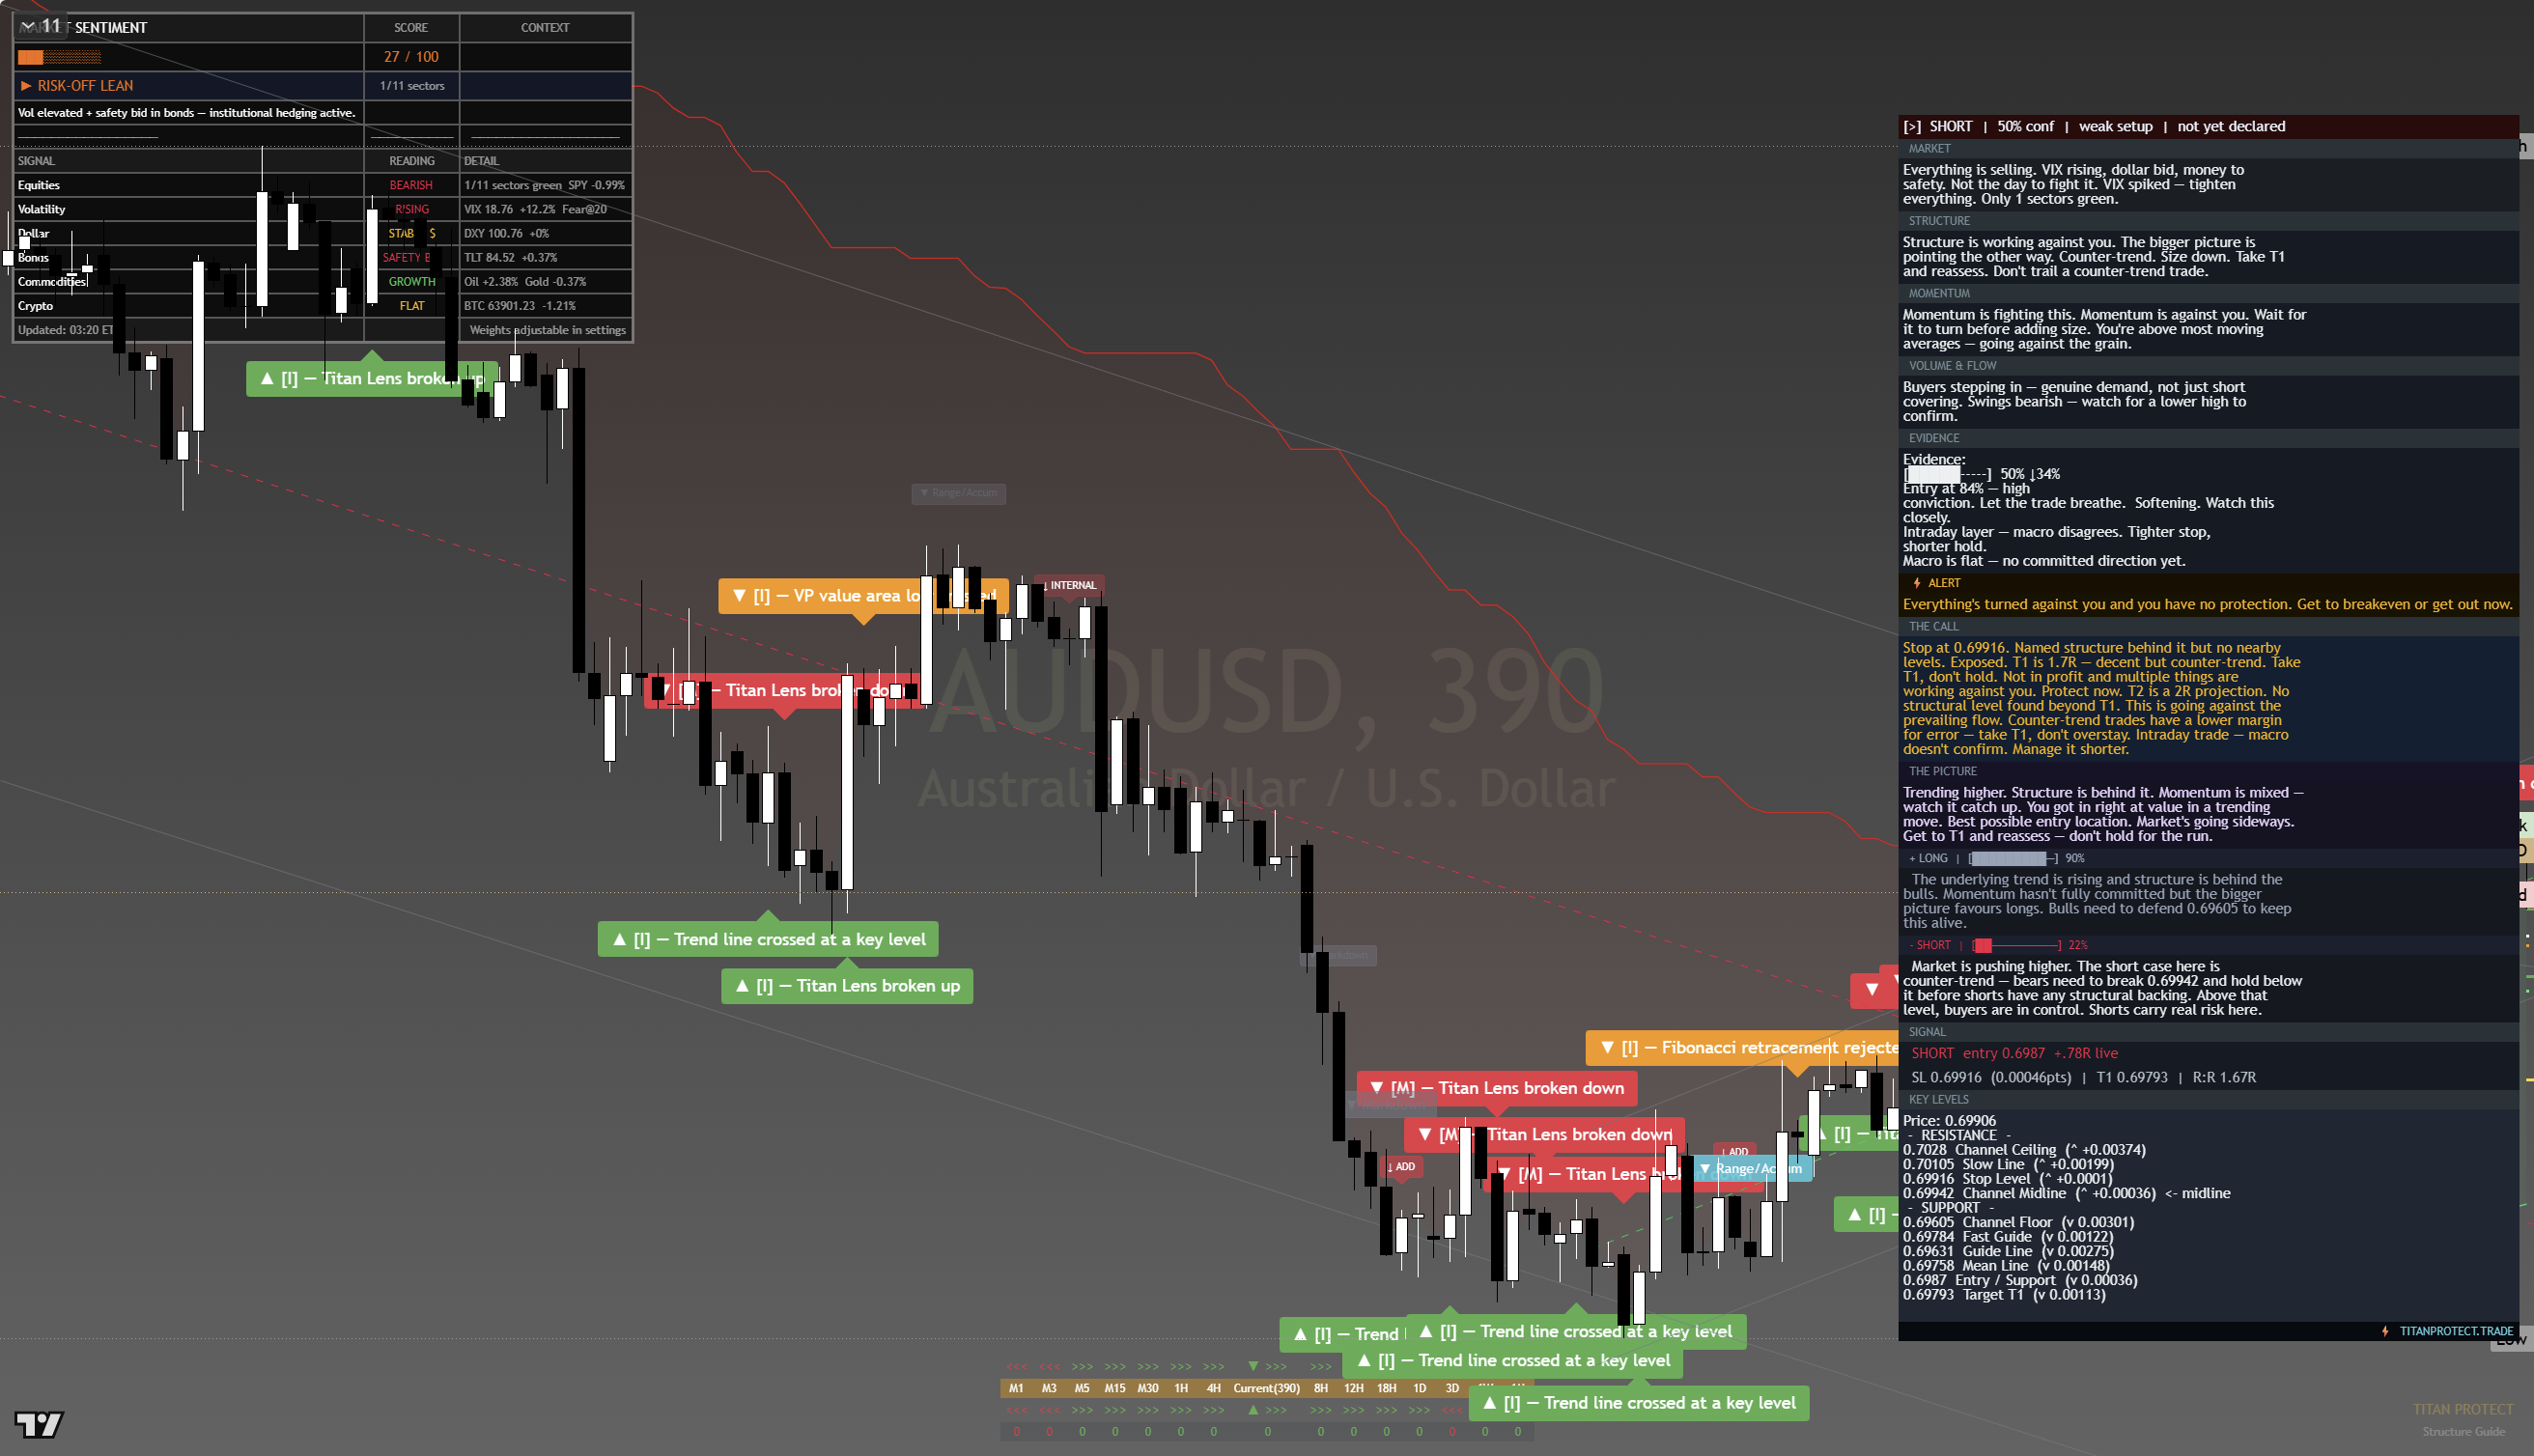
The chart above is the full framework read: structure, momentum, the levels that matter, and where the current price sits against them. Read it top to bottom for the complete picture, and pair it with our session briefs for the wider market context.
This is analysis, not financial advice. It reflects our multi-factor framework and is not a recommendation to buy or sell. Always do your own research and manage your risk.
Sunday 12 Jul 2026
EUR/USD — Daily Framework Read | Saturday 11 July 2026
EUR/USD | Post Close Setup Framework Read | Data basis: 2026-07-11 close
Where It Sits
Structure
Structurally EUR/USD has pulled back into the session close. The broader trend remains intact on the daily timeframe but the shorter timeframe has softened. The structure is contested near the 1.1416 level.
Momentum
Momentum is neutral with internal readings near the centre of the range. That is the signature of a market digesting the prior move. The tape needs a fresh catalyst to commit to direction.
Volume & Flow
Volume data is limited for this session. The positioning read is neutral — no obvious skew in either direction. Watch for flow confirmation on the next session.
Key Levels
| Level | Type | Significance | Action Zone |
|---|---|---|---|
| 1.1488 | Resistance | Upper range target, prior supply zone | Take profits / fade if rejected |
| 1.1440 | Pivot | Mid-range continuation marker | Hold = constructive; lose = consolidation |
| 1.1416 | Session close | Reference anchor for next session | Above = continuation; below = mean revert |
| 1.1377 | Support | Recent range floor, demand zone | Buy zone with defined stop |
| 1.1328 | Major support | Prior breakout retest level | Stop-out below for longs |
Three Scenarios
Continuation
EUR/USD holds the session close at 1.1416 and pushes lower on continued positioning flow. The broader trend remains intact. Watch the dollar tape for confirmation.
Range
EUR/USD opens flat and ranges around 1.1416. Neither side has conviction without a fresh data catalyst. Range trade dominates.
Mean Reversion
EUR/USD breaks below support on a shift in dollar positioning. Mean reversion within the broader trend. Watch for a clean test of support before committing.
Risk Score
Risk sits at Around 45%
Risk sits around 45 per cent. Vix at 15.0 supports a measured risk posture. sentiment at 50 is neutral. Currency pairs carry intervention and data-release headline risk. Standard sizing with defined stops — discipline beats conviction.
How to Walk It
Entry / Stop / Target structure:
- Long 1.1377 pullback | Stop 1.1328 | Target 1.1440 | R:R 2:1
- Long 1.1440 breakout | Stop 1.1416 | Target 1.1488 | R:R 1.5:1
- Fade 1.1488 rejection | Stop above resistance | Target 1.1416 | R:R 2:1
Experience-level guidance:
Beginner: Reduce size to half your standard. Trade only the cleanest setup from the entries above. If the tape opens against your bias, do nothing — wait for the second hour, when the institutional flow has tipped its hand.
Intermediate: Use the levels table to define the trading range. Fade the extremes with defined stops, take profits before the round-number resistance levels.
Advanced: The vol regime supports defined-risk structures around the key pivot levels. Keep notional small relative to your book — asymmetric speculation, not core positioning.
Continue Reading
The macro frame driving this read is unpacked in the session briefs:
Check the latest session briefs on the site.
This analysis is for educational and informational purposes only. It does not constitute financial advice. Always manage your risk independently and in accordance with your own financial circumstances.
Friday 10 Jul 2026
EUR/USD — Daily Framework Read | Friday 10 July 2026
EUR/USD | Post Close Setup Framework Read | Data basis: 2026-07-10 close
Where It Sits
Structure
Structurally EUR/USD has pulled back into the session close. The broader trend remains intact on the daily timeframe but the shorter timeframe has softened. The structure is contested near the 1.1416 level.
Momentum
Momentum is neutral with internal readings near the centre of the range. That is the signature of a market digesting the prior move. The tape needs a fresh catalyst to commit to direction.
Volume & Flow
Volume data is limited for this session. The positioning read is neutral — no obvious skew in either direction. Watch for flow confirmation on the next session.
Key Levels
| Level | Type | Significance | Action Zone |
|---|---|---|---|
| 1.1488 | Resistance | Upper range target, prior supply zone | Take profits / fade if rejected |
| 1.1440 | Pivot | Mid-range continuation marker | Hold = constructive; lose = consolidation |
| 1.1416 | Session close | Reference anchor for next session | Above = continuation; below = mean revert |
| 1.1377 | Support | Recent range floor, demand zone | Buy zone with defined stop |
| 1.1328 | Major support | Prior breakout retest level | Stop-out below for longs |
Three Scenarios
Continuation
EUR/USD holds the session close at 1.1416 and pushes lower on continued positioning flow. The broader trend remains intact. Watch the dollar tape for confirmation.
Range
EUR/USD opens flat and ranges around 1.1416. Neither side has conviction without a fresh data catalyst. Range trade dominates.
Mean Reversion
EUR/USD breaks below support on a shift in dollar positioning. Mean reversion within the broader trend. Watch for a clean test of support before committing.
Risk Score
Risk sits at Around 45%
Risk sits around 45 per cent. Vix at 15.0 supports a measured risk posture. sentiment at 50 is neutral. Currency pairs carry intervention and data-release headline risk. Standard sizing with defined stops — discipline beats conviction.
How to Walk It
Entry / Stop / Target structure:
- Long 1.1377 pullback | Stop 1.1328 | Target 1.1440 | R:R 2:1
- Long 1.1440 breakout | Stop 1.1416 | Target 1.1488 | R:R 1.5:1
- Fade 1.1488 rejection | Stop above resistance | Target 1.1416 | R:R 2:1
Experience-level guidance:
Beginner: Reduce size to half your standard. Trade only the cleanest setup from the entries above. If the tape opens against your bias, do nothing — wait for the second hour, when the institutional flow has tipped its hand.
Intermediate: Use the levels table to define the trading range. Fade the extremes with defined stops, take profits before the round-number resistance levels.
Advanced: The vol regime supports defined-risk structures around the key pivot levels. Keep notional small relative to your book — asymmetric speculation, not core positioning.
Continue Reading
The macro frame driving this read is unpacked in the session briefs:
Check the latest session briefs on the site.
This analysis is for educational and informational purposes only. It does not constitute financial advice. Always manage your risk independently and in accordance with your own financial circumstances.
Thursday 9 Jul 2026
Titan Protect · Ticker Read
AUD/USD Holds 0.6934 as a Soft Dollar Fights Falling Metals and a Risk-Off Tape, Thursday 9 July 2026
0.6934
+0.17%
Range a tight 11 pips · Dollar Index soft near 100.98 (-0.16%)
The Read
The Aussie is threading a needle. A gently softer US dollar is lending quiet support at the lows, yet the two forces that usually power this pair higher are pulling in opposite directions. Crude oil has ripped +5.2% to the mid 70s, a tailwind for the broad commodity complex, but the metals that matter far more to Australia have been hammered: gold is down 1.49% and silver off 3.7% on the day. Layer on a risk-off equity tape in Europe, with the German and UK benchmarks down more than 1.6%, and the small caps soft in the US, and you have a currency that wants to rally on the weak dollar but keeps getting capped by its own commodity backdrop. The net result is a razor-thin 11 pip range and a market that has not yet chosen a side.
Into Thursday, treat 0.6934 as the pivot. As long as buyers keep defending the 0.6931 session floor and the round 0.6900 handle below it, the path of least resistance leans mildly constructive on the back of the soft dollar. Lose 0.6900 with metals still bleeding and the story flips to a deeper unwind.
Structure
Price is coiled just beneath the 0.6942 session high and holding well above the 0.6931 low, a compression that typically resolves with an expansion move rather than more chop. The broader posture remains balanced: the pair has neither confirmed a fresh uptrend nor rolled into a clean downtrend, which is why the market regime reads as neutral. The tell is which side of 0.6900 the pair closes the Asia and London sessions on. A defended 0.6900 keeps the constructive structure intact; a decisive break turns the recent base into overhead supply.
Momentum
Momentum is flat-to-mildly-positive, matching the +0.17% tape. There is no thrust here; the modest green is more a function of the dollar easing than of genuine Aussie demand. With broad market volatility ticking up (the fear gauge nudged higher into 17, though still off the prior day) and metals under pressure, upside momentum needs a fresh catalyst to build. Until the pair clears and holds 0.6942, momentum stays in a low-energy state where mean reversion inside the range dominates over trend continuation.
Volume & Participation
Participation is subdued, consistent with the compressed range. The heavy moves on the day sit in commodities and European equities, not in the Aussie itself, which tells you the FX crowd is waiting for a cleaner signal from either the dollar or the metals complex. Thin conditions cut both ways: a break can extend quickly on light liquidity, but false breaks are equally common. Wait for a range resolution to be confirmed by follow-through rather than chasing the first push through either edge.
Key Levels
| Level | Type | Why It Matters | Action |
|---|---|---|---|
| 0.6985 | Resistance | Prior swing shelf and the gateway to the 0.7000 handle. | Fade first touch; breakout only on a hold. |
| 0.6960 | Resistance | Intraday supply that capped the last push higher. | Watch reaction; a clean break opens 0.6985. |
| 0.6942 | Near resistance | Today’s session high and the top of the coil. | Trigger for longs on an hourly close above. |
| 0.6931 | Near support | Today’s session low and the floor of the range. | Buy-the-dip zone while it holds on a closing basis. |
| 0.6900 | Support | Round psychological handle and the bull/bear line. | Defend for longs; break flips bias bearish. |
| 0.6870 | Support | Next demand pocket if 0.6900 gives way. | Downside target on a confirmed break lower. |
Scenarios Into Thursday
Bull · 35%
The soft dollar theme wins out and metals stabilise. AUD/USD reclaims 0.6942, clears 0.6960 and grinds toward 0.6985, with 0.7000 back in view if the risk-off mood in equities calms. Confirmation is an hourly close above 0.6942 that holds on the retest.
Base · 40%
The tug-of-war persists. Price oscillates between 0.6900 and 0.6960, with the 0.6931 to 0.6942 band as the centre of gravity. Neither the weak dollar nor the metals drag is decisive, so the pair chops and traders play the edges rather than the middle.
Bear · 25%
Falling gold and silver plus a broadening risk-off tape overwhelm the soft dollar. AUD/USD loses 0.6900 on a closing basis and slides toward 0.6870, with momentum sellers pressing while equities stay heavy. Invalidation for this view is a reclaim of 0.6931.
Probabilities sum to 100%.
Risk Rating
Elevated · 62%
The read carries an above-average risk footprint. The main drivers: a sharp fall in the metals complex that historically pressures the Aussie, a risk-off equity backdrop with European benchmarks down more than 1.6%, and a broad volatility gauge that ticked higher on the day. Offsetting factors, a softer dollar and firmer crude, keep the score from running hotter, but the conflicting cross-asset signals mean position sizing should stay conservative until the range resolves.
Entry Ideas
Bullish idea. Look to buy dips into 0.6931 to 0.6935 while the floor holds, or enter on strength via an hourly close back above 0.6942. First objective 0.6960, then 0.6985. Invalidation: a closing break below 0.6900.
Bearish idea. Wait for a decisive close below 0.6900 before pressing short, targeting 0.6870. Chasing inside the range invites whipsaw. Invalidation: a reclaim of 0.6931 that holds.
Data captured 07:00 London / 16:00 Sydney / 02:00 New York, Thursday 9 July 2026 (2026-07-09).
Disclaimer: This content is for educational and informational purposes only and does not constitute financial, investment or trading advice, nor a recommendation to buy or sell any instrument. Markets carry risk and you can lose capital. Levels and scenarios reflect a point-in-time view and can change without notice. Always do your own research and consider seeking advice from a licensed professional before trading. Titan Protect accepts no liability for decisions made on the basis of this material.
Wednesday 8 Jul 2026
Australian Dollar (AUD/USD) Holds 0.6927 as Crude’s 5% Surge Fails to Break the Range
Titan Protect Daily Framework Read | Tuesday 7 July 2026, US close
The Australian Dollar (AUD/USD) closed the New York session at 0.6927, essentially flat on a night where the headline was a violent sector rotation rather than a currency story. Crude oil ripped 5.32% higher to $72.20, a move that would normally hand the commodity bloc a clean tailwind, but the reaction in AUD/USD was muted and range-bound. That gap between a strong pro-commodity input and a subdued currency response is the tell: capital rotated out of growth and into energy, it didn’t rotate into risk broadly. The Nasdaq 100 dropped 1.77% on the same session, which should have pressured the Aussie as a risk-sensitive currency, yet it didn’t break down either. Gold gave back ground to around $4,110 and the VIX stayed calm at 16.13, both consistent with a market repositioning rather than de-risking. Fear and Greed improved to 43 and USD/JPY sat at 162.15, both neutral readings. Read together, tonight was a sector reshuffle inside a risk-neutral regime, and AUD/USD absorbed the crosscurrents by doing very little. That kind of session tends to compress volatility before the next directional push, and the framework below treats 0.6927 as a coiled pivot rather than a level to fade blindly.
Context matters here more than the headline number. The Aussie has long traded as a proxy for global commodity demand and broad risk appetite, so a 5% crude spike ought to be an unambiguous positive. Tonight it wasn’t unambiguous at all, because the same session took nearly two full percentage points off the Nasdaq 100. Those two forces landed on AUD/USD at roughly the same time and mostly cancelled each other out, which is why the close sat almost exactly where it opened. That’s not indecision from weak conviction, it’s two genuine flows fighting for control of the same pair. The calm VIX print and the improved Fear and Greed reading both argue that this was capital reallocating within risk assets rather than fleeing them, which is the more constructive of the two possible explanations for a rotation day. A currency that holds its ground through a cross-current session like this one usually has a directional answer waiting close by, it just needs one of the two competing narratives to win out clearly enough for the market to commit.
Key Levels
| Level | Price | Why It Matters | Action |
|---|---|---|---|
| Resistance | 0.6962 | Caps the recent upside attempts and lines up with where sellers have repeatedly stepped in on rallies. A close above here would need the commodity strength to actually translate into broad risk appetite. | Fade the first touch, only chase a confirmed break with volume. |
| Pivot | 0.6927 | Tonight’s closing level and the balance point between the crude tailwind and the tech-led risk-off pull. Whichever side holds through the next session sets the near-term tone. | Trade with the side that holds, avoid the middle chop. |
| Support | 0.6891 | Prior demand shelf from the last consolidation. A clean loss of this level with the Nasdaq weakness persisting would confirm the risk-off leg is taking over from the commodity story. | Buy the reaction with a tight invalidation below, or stand aside if it breaks with momentum. |
Bias
Neutral, mild bullish lean. The crude surge is a genuine positive for a commodity-linked currency, and the regime read is neutral rather than risk-off, so the path of least resistance favours a slow grind toward resistance rather than a breakdown. That lean only holds while equity weakness stays contained to the tech complex and doesn’t broaden. If the Nasdaq weakness is still just a rotation into energy and other cyclicals, the Aussie has room to work higher on the coattails of the commodity move. If it turns into the first leg of a broader growth scare, the bias flips fast, since a risk-sensitive currency doesn’t get to keep a commodity tailwind once the wider market decides it wants safety over yield.
Strategy Breakdown
- Scalp: Fade extremes of the 0.6891 to 0.6962 range on low timeframes until one side breaks with conviction.
- Intraday: Lean long on dips toward the pivot while crude strength holds, tighten up fast if the Nasdaq weakness spreads to broader risk sentiment.
- Swing: Wait for a confirmed close outside the range before committing, the mixed signals argue against sizing a multi-day position tonight.
Risk
Risk: 35%. The calm VIX and neutral regime cap the downside risk, but the divergence between a strong commodity tailwind and a soft tech tape means the currency could swing either way once the market decides which signal it’s trading.
Next Session Scenarios (Wednesday 8 July)
| Scenario | Probability | Description |
|---|---|---|
| Commodity-led grind higher | 40% | Crude strength persists, risk sentiment steadies, AUD/USD grinds toward 0.6962 for a retest. |
| Range holds, chop continues | 35% | Neither signal dominates, price oscillates between 0.6891 and 0.6962 without a decisive break. |
| Risk-off spreads, support fails | 25% | Tech weakness broadens into wider equity selling, commodity currencies get sold alongside growth assets, 0.6891 gives way. |
Position Sizing
STANDARD applies tonight. The calm volatility backdrop and neutral regime support a normal allocation, but the mixed crude-versus-tech signal argues against MAX size until the range resolves. MAX sizing should wait for a confirmed break of either 0.6962 or 0.6891 with the broader tape agreeing on direction. Move to REDUCED if the Nasdaq weakness starts pulling broader risk lower and the pair struggles to hold the pivot, and treat AVOID as the right call for anyone without a clear trigger for which side of the range breaks first, since chasing a rotation day’s crosscurrents without a plan is how disciplined risk management erodes.
This is analysis, not financial advice. Always manage your risk.
Friday 3 Jul 2026
AUD/USD – Daily Read
July 2, 2026 | Forex | Titan Macro Desk
0.72365
Chart-based read for AUD/USD. Framework review data pending for this instrument. Price action and key levels shown on the chart below.

Framework Metrics
This read is generated by the Titan framework and reflects our multi-factor analytical model. It is not financial advice. Past performance is not indicative of future results. Always conduct your own research before making investment decisions.
Thursday 2 Jul 2026
AUD/USD – Daily Read
July 2, 2026 | Forex | Titan Macro Desk
0.72365
Chart-based read for AUD/USD. Framework review data pending for this instrument. Price action and key levels shown on the chart below.
Framework Metrics
This read is generated by the Titan framework and reflects our multi-factor analytical model. It is not financial advice. Past performance is not indicative of future results. Always conduct your own research before making investment decisions.