AMD – Daily Read
27 September 2026 | Stock | Titan Macro Desk
$630.63
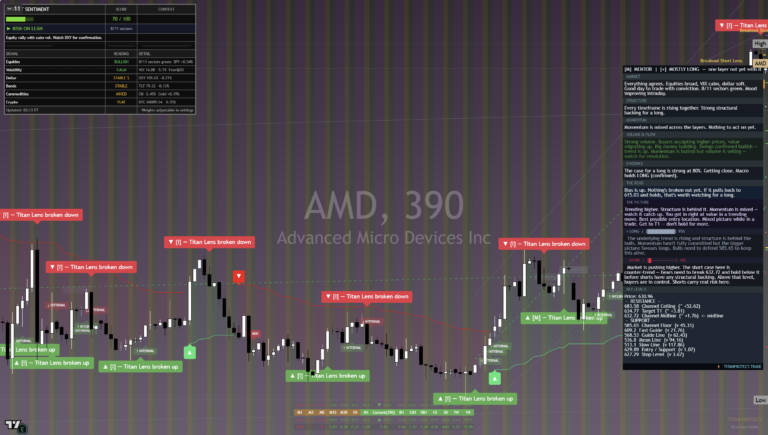
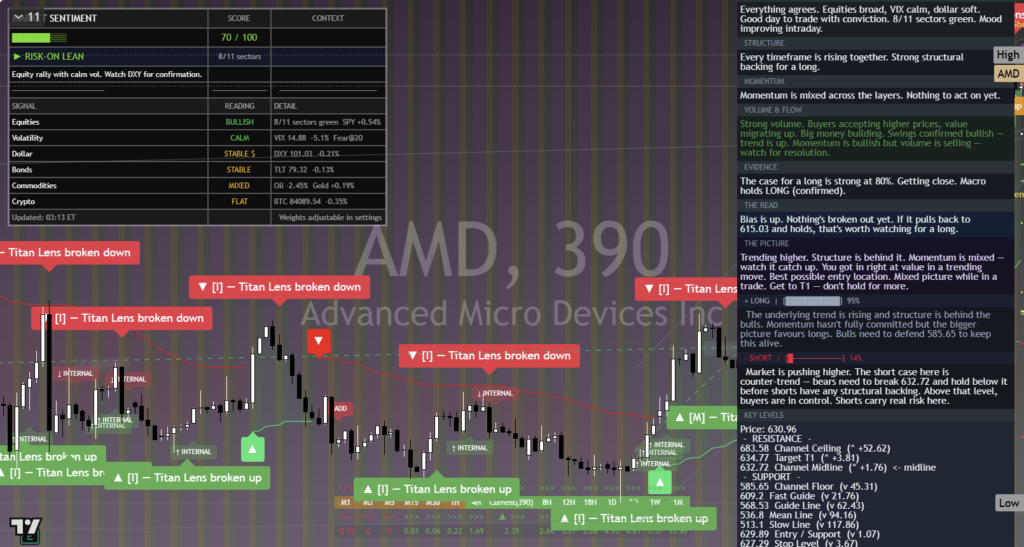
AMD is trading like a leadership stock in an accelerating price discovery phase, but the immediate setup is extended enough to demand discipline. Last price $630.63, 0.2 percent higher on the day. It is pressing the top of its one-month range, which matters because sustained acceptance near the ceiling usually reflects persistent demand, while failure this close to resistance can invite a sharp reset. The clear view is constructive above nearby support, with confirmation still required before treating the range high as a durable breakout.
The broader backdrop is one in which investors are rewarding visible growth, operating leverage, and strategic exposure to computing demand, while remaining sensitive to changes in risk appetite and expectations for future earnings. For AMD specifically, the stock’s asset-class behavior matters: high-growth semiconductor shares can attract concentrated flows when conviction rises, but those same flows can reverse quickly when expectations become crowded. One month average $531.42; price is above it, and the structure reads as a clean uptrend, price above both its one-month and longer averages. Momentum roughly 22.2 percent up over the last two weeks. That strength confirms sponsorship, although it also raises the cost of disappointment because late buyers have less room for error.
Month swing high $638.95, about 1.3 percent above the current price. This is the immediate decision point because it marks the boundary between continued range containment and renewed price discovery. Nearer round number handles at $640.00 and $630.00. The lower handle is the first area buyers need to defend to preserve pressure on the high, while the upper handle is a natural destination and potential acceptance test after a breakout. Three month range $410.71 to $638.95. The width of that range shows how far the stock has already travelled and why confirmation matters more than anticipation here. A shelf of support at $440.50, about 30.1 percent below. That shelf is structurally important because it represents the deeper demand zone separating an orderly correction from a more damaging unwind.
The bull path is straightforward: if buyers keep control around the current area and force a decisive move above $638.95, then prior supply has been absorbed and the path opens toward $640.00. Holding above that upper handle would strengthen the case that the move is being accepted rather than briefly chased. The bear path begins with rejection near the range ceiling. If $630.00 cannot hold, then the market is signaling that immediate demand has weakened, increasing the chance of a broader retracement toward the average zone. If that deterioration ultimately reaches and loses $440.50, then the bullish structure is materially impaired and $410.71 becomes exposed.
The principal risk is asymmetry after a rapid advance: strong structure can coexist with poor short-term entry quality. A failed breakout, weakening semiconductor leadership, or a broad retreat from growth exposure would challenge the thesis. Losing $440.50 would invalidate the constructive structural read rather than merely pause it. Net, AMD remains bullish while buyers defend the nearby handles, but conviction should rise only through sustained acceptance above the range high.
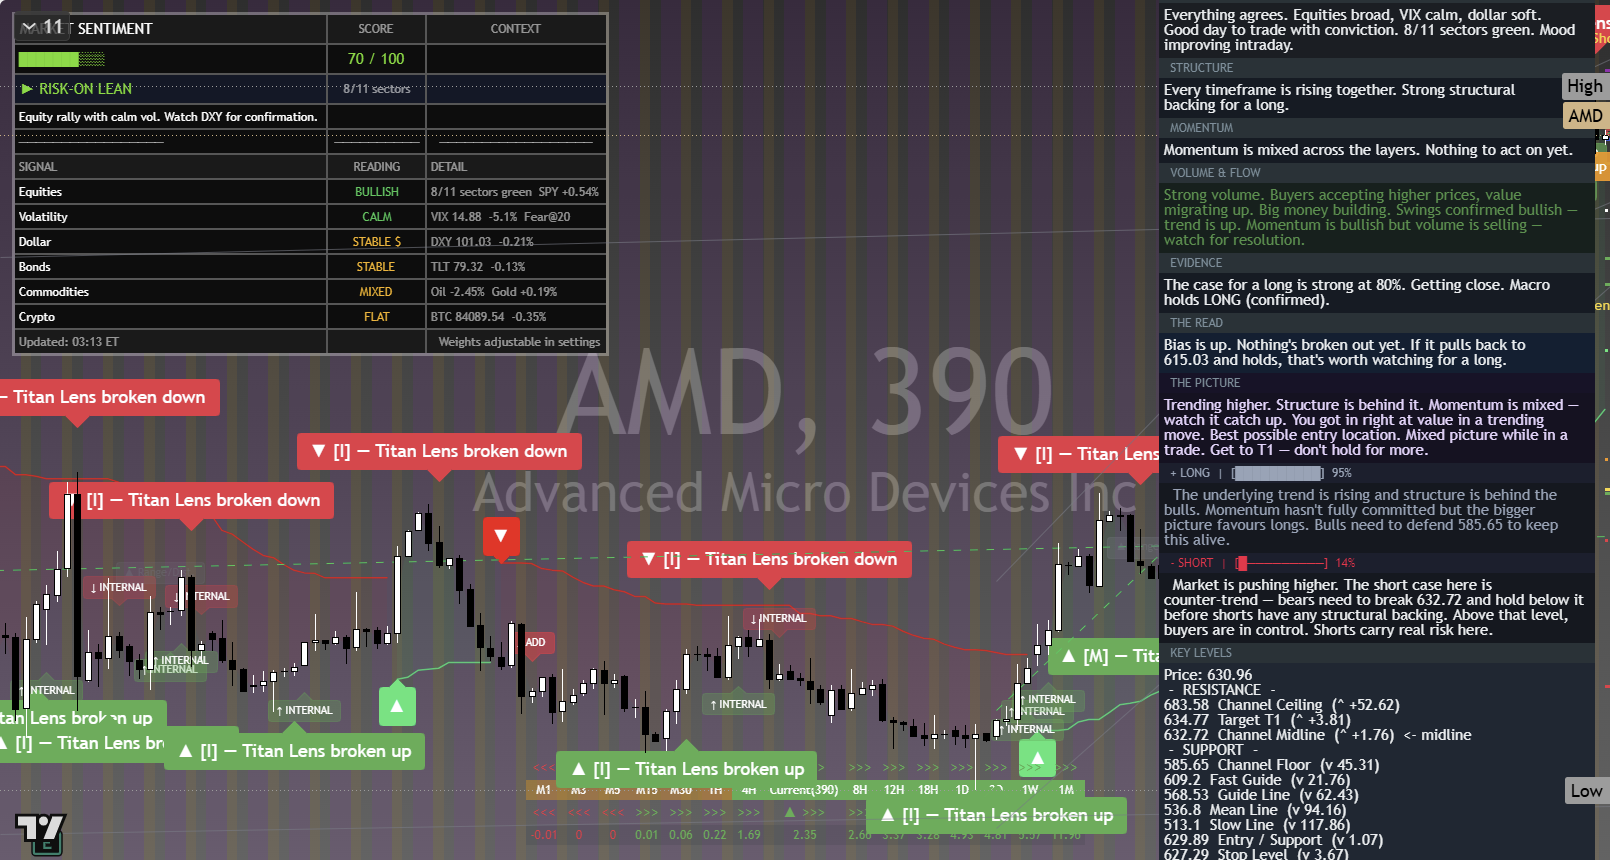
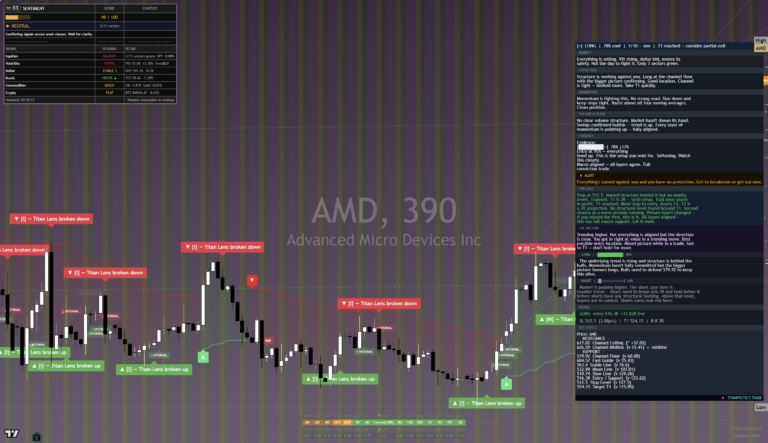
The chart above is the full daily read: structure, momentum, the levels that matter, and where the current price sits against them. Read it top to bottom for the complete picture, and pair it with our session briefs for the wider market context.
This is analysis, not financial advice. It reflects our multi-factor framework and is not a recommendation to buy or sell. Always do your own research and manage your risk.