
Titan Playbook Series
Titan Playbook 05: Trend Following
The oldest systematic edge in financial markets, and the one most traders abandon before it works.
The Core Idea
Trend following rests on a single, repeatable observation: markets move in extended directional sequences, and instruments in established trends have a higher probability of continuing in that direction than reversing. The strategy is to identify those trends, enter them after confirmation, size positions appropriately, and hold until the trend is demonstrably over. No prediction of when the move will end. No target based on fundamental value. Simply: the trend is intact, remain in the trade.
The approach sounds straightforward. In practice, it is one of the hardest styles to execute because of what it demands emotionally. Trend following accounts go through extended periods of flat or declining performance when markets are ranging, choppy, or reversing frequently. During those periods, the strategy produces a stream of small losses. Then, when a genuine trend emerges, the system captures it in full. The profit on one good trend can offset months of marginal losses. But you have to still be in the game when that trend arrives, which means sitting through the difficult periods without abandoning the system.
Most people cannot do this. The evidence is in the hedge fund flow data. Managed futures funds, which run systematic trend-following strategies, regularly see assets under management decline in their worst periods and rebuild as performance resumes. Investors time the cycle perfectly wrong, redeeming after drawdowns and subscribing after strong runs. Individual traders running their own trend-following accounts do the same thing with their confidence.
The Turtle Trader Legacy
The best-documented test of trend following as a learnable system came from an experiment run by commodity trader Richard Dennis in 1983. Dennis bet a colleague that he could teach a group of ordinary people with no trading background to trade profitably using a defined set of rules. He recruited and trained 23 people, gave them accounts ranging from $500,000 to $2 million, and sent them to trade. The results over the following years were extraordinary. Several of the “Turtles”, as they became known, went on to build hundreds of millions of dollars in assets under management.
The rules they followed were not complicated. They traded breakouts from defined period highs and lows. They sized positions based on volatility, specifically the Average True Range of the instrument. They added to winning positions in a defined sequence. They exited when the market gave back a set amount of profit from the peak. The edge was not in the sophistication of the entry signal. It was in the systematic execution of a process that allowed wins to run and losses to be cut quickly.
That insight remains the core of trend following. The signal matters less than the discipline applied to it.
Trend Identification
Before a trend-following system can generate entries, it needs a method for confirming that a trend exists. Several approaches are widely used, and each has genuine merit in different market conditions.
Moving average crossovers, where a shorter-period average crossing above or below a longer-period average signals directional change, are among the most tested signals in market history. The 50-day/200-day crossover, known as the Golden Cross on the upside and the Death Cross on the downside, is followed closely enough by institutional participants that it has become a self-reinforcing signal in many markets.
Breakouts from defined ranges, particularly from multi-week or multi-month consolidations, represent another widely-used trigger. A market that has been contained between two levels for an extended period and then breaks clearly through one of them is exhibiting the kind of directional resolution that trend-following systems are designed to capture.
Channel-based approaches, where price must remain within a progressively adjusted band to maintain the trend signal, offer a more dynamic definition that adapts to changing volatility conditions.
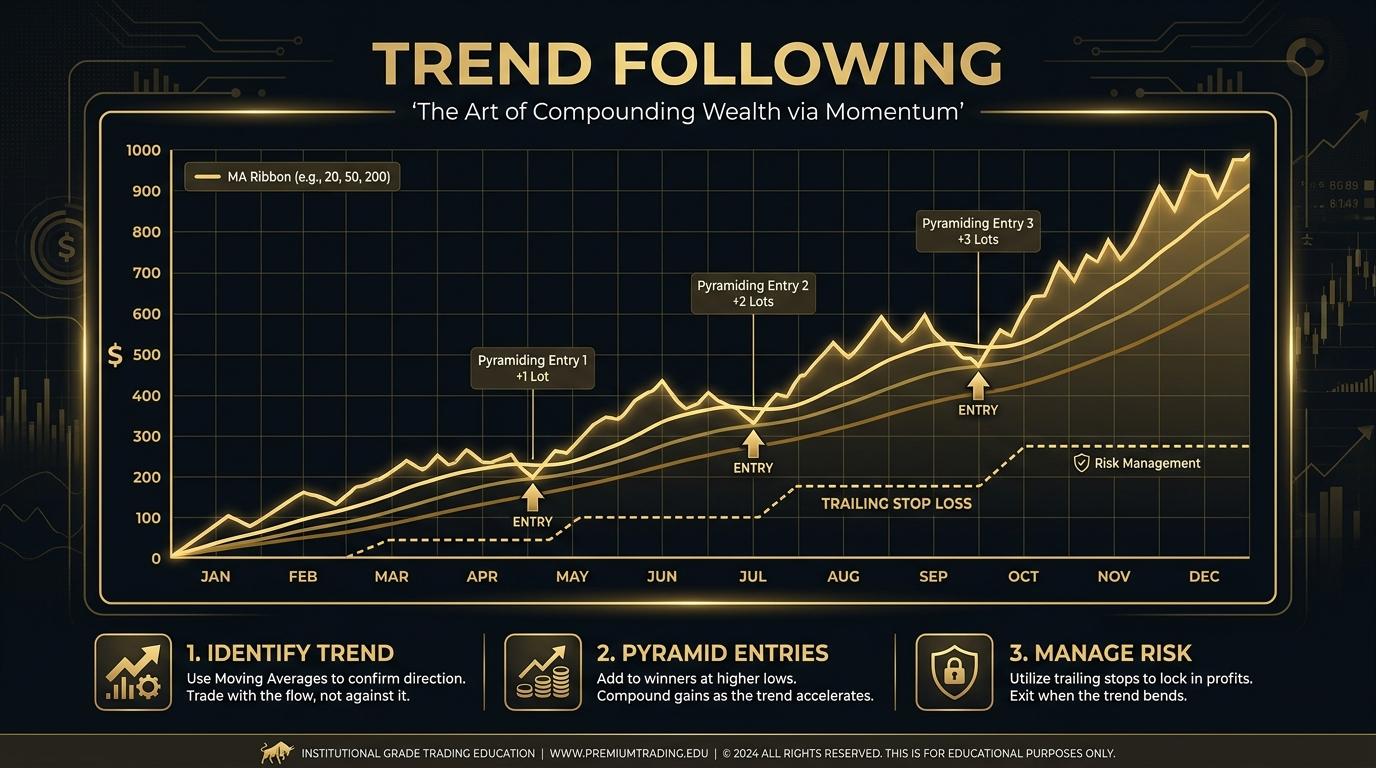
Pyramiding
Pyramiding is the practice of adding to a winning position as the trend extends. Used correctly, it concentrates risk in trades that are already proving themselves correct while keeping maximum position size modest at the initial entry. The logic is straightforward: if a trend is genuine, adding at defined intervals as the market moves in your favour increases overall exposure at the point of maximum directional evidence.
The risk is that pyramiding turns a normal retracement within a healthy trend into a sharp aggregate loss if all positions are added near the peak. Managing this requires strict rules about how much can be added, at what intervals, and where the stop on the entire position sits as size accumulates. Trend followers who composite without these rules do not trend follow. They hold concentrated exposure that compounds their risk just as the trend enters its final phase.
| Metric | Typical Range for Trend Following | What It Means |
|---|---|---|
| Win Rate | 30% to 45% | Majority of trades are small losses. Profitability comes from the size of wins. |
| Average Win / Average Loss | 3:1 to 6:1 or higher | Each win must compensate for multiple losses. Cutting losses early is essential. |
| Max Drawdown Period | Months, sometimes over a year | Long flat periods are the norm, not a signal that the system is broken. |
| Trade Frequency | Low, 1-4 significant entries per month | Not suited to traders who need constant activity to feel engaged. |
| Best Market Conditions | Trending, directionally persistent markets | Ranging, choppy conditions produce consistent small losses. |
| Worst Market Conditions | High-frequency reversals, low-volatility consolidation | Multiple whipsaw losses before a genuine trend emerges. |
Why Most People Cannot Trend Follow
The statistics are important but they are not why trend following fails for most people. The reason is psychological. A 35% win rate means you lose on 65% of your trades. Most of those losses come in clusters, when the market is ranging and every breakout attempt fails. Sitting through thirty consecutive small losses, remaining confident that the system is intact and the next signal deserves full execution, requires a level of systematic conviction that is genuinely rare.
The specific failure point comes when a trend does emerge after a long losing sequence. By that point, many traders have either reduced their position size out of fear, stopped taking signals entirely, or abandoned the system. They miss the one trade that would have recouped the previous three months of losses and delivered meaningful profit. The system works. The trader who does not execute it consistently does not.
Building the psychological resilience for trend following requires understanding, in advance and in detail, what the drawdown periods look like. Study the historical performance of any trend-following system you intend to run, focusing specifically on the worst performing periods. If that scenario plays out and you know it is possible, it is significantly easier to maintain conviction than if it arrives as a surprise.
Action Items
- Review the worst historical drawdown of any trend-following system or strategy you are considering. Make sure you could fund and emotionally sustain that drawdown before starting.
- Define your trend confirmation criteria in writing. What exactly must be true before you consider a trend valid enough to enter?
- Set a maximum open risk per trade based on ATR-based sizing rather than a fixed pip or point value. Volatility-adjusted sizing is core to the approach.
- If you plan to composite, write the composite rules before placing the first trade. Maximum additions, spacing, and how the overall stop adjusts at each addition.
- Review every time you have previously abandoned a trade or system early. Identify whether the decision was based on evidence that the edge was broken or simply on discomfort with normal drawdown.
Continue Learning
- Titan Playbook 04: Swing Trading
- Titan Playbook 06: Mean Reversion
- What Is a Stop Loss?
- Risk/Reward Ratio Explained