Titan Playbook Series
Titan Playbook 06: Mean Reversion
Fading extended moves requires a precise read of market structure. Get it wrong and you are fighting a trend.
The Reversion Concept
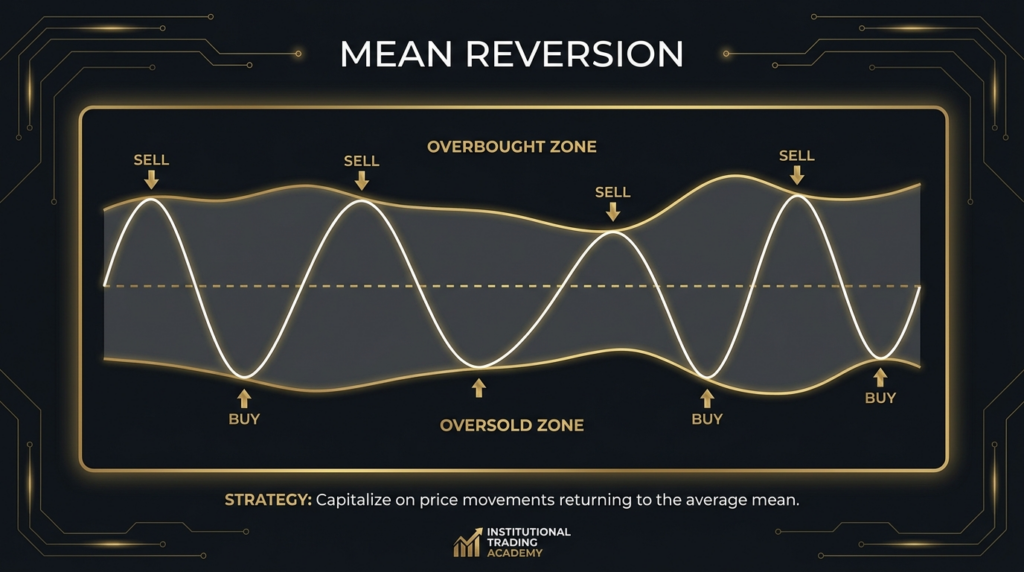
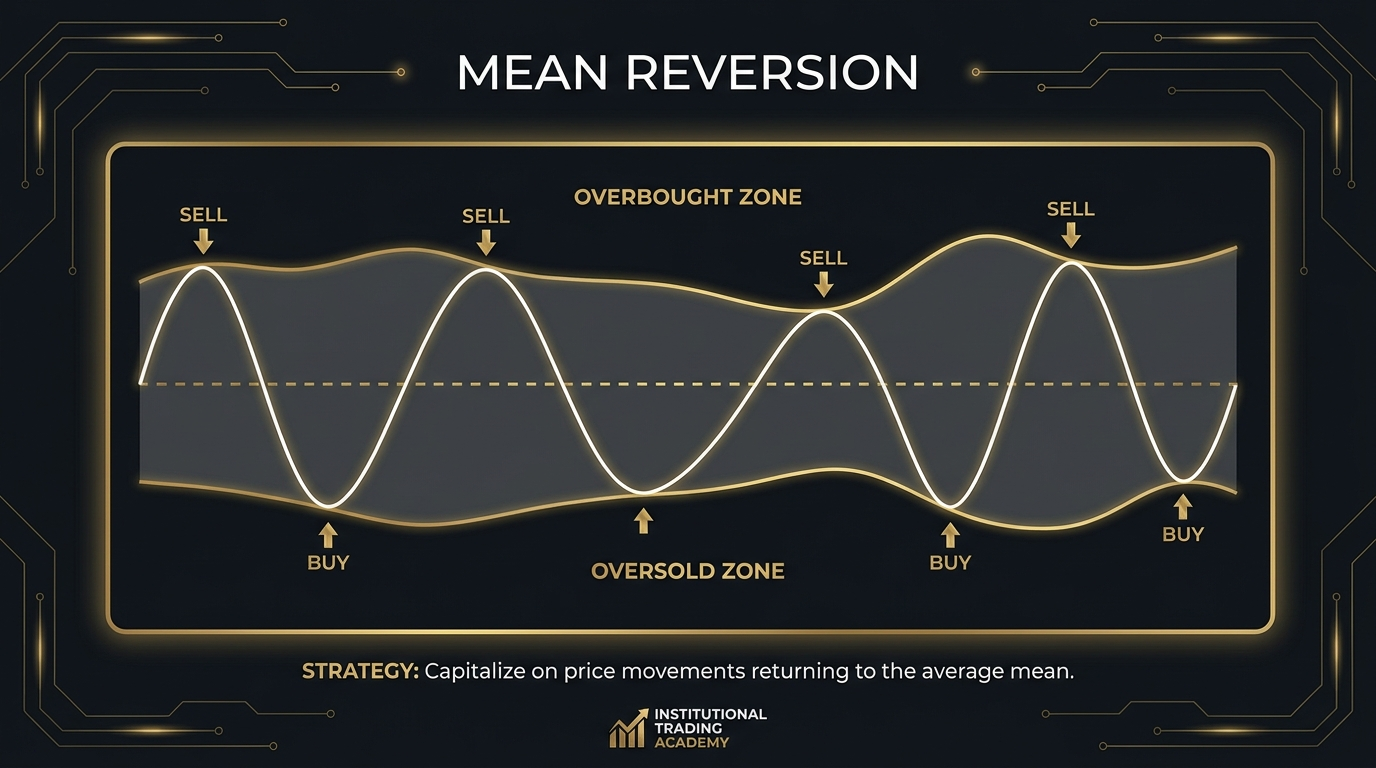
Mean reversion is built on the observation that price tends to return toward an average after moving to an extreme. A market that has sold off sharply in a short period is statistically more likely to recover some of that loss than to continue falling at the same rate indefinitely. Conversely, a market that has extended aggressively to the upside without consolidation tends to pull back before resuming or reversing.
This is a real and documented phenomenon. It is also one of the most dangerous concepts in trading when applied without a rigorous framework for determining when the conditions that support it are actually present. The line between fading an overextended move within a range and fighting an established trend is exactly the line that separates profitable mean reversion from a sequence of losses that each feel statistically justified.
Understanding that distinction is the central skill of mean reversion trading. Not the indicator setup. Not the entry trigger. The judgment of whether the instrument is in a regime where reversion is valid or one where it will destroy you.
Technical Approaches
Several technical frameworks are widely associated with mean reversion. None of them are reliable in isolation. Each requires the structural context check described above to filter out the high-failure setups.
Bollinger Bands plot two standard deviation bands above and below a moving average. Price touching or closing outside the upper band after an extended directional move in a ranging market can indicate overextension. The mean reversion entry fades the extreme and targets the middle band or the opposite extreme. The problem is that in a trending market, price can walk along the outer band for extended periods without reverting. Using Bollinger Bands as a standalone entry signal in a trending environment produces exactly the kind of losing streak that convinces traders the approach does not work, when the real issue was using a ranging tool in a trending environment.
RSI at extremes, typically above 70 for overbought and below 30 for oversold readings, is another commonly cited mean reversion trigger. The same caution applies. A strongly trending market can sustain RSI readings above 70 for weeks. The RSI extreme confirms that a move has been large. It does not confirm that the move is over.
The most reliable applications of these tools combine the extreme reading with a structural reason for reversion: a clearly defined range, a significant support or resistance level being tested, or a failure to close through a key level despite multiple attempts.
When Mean Reversion Works
Mean reversion has its strongest edge in instruments that are moving within well-defined ranges. Individual equities trading between established support and resistance levels, currency pairs consolidating after a large directional move, indices in a period of post-event digestion: these are the conditions where the statistical case for reversion is genuinely strong.
The key characteristics of a favourable mean reversion environment include: a clearly visible range with multiple prior tests of both the upper and lower boundaries; declining momentum as price approaches an extreme (rather than accelerating momentum, which suggests a breakout rather than a reversal); and volume behaviour that shows diminishing participation at the extreme rather than surging volume confirming a genuine directional move.
Timing matters within the session as well. Mean reversion setups that develop during high-volume periods, when the institutional participation is present to drive the reversion, have more credibility than setups forming in thin, low-volume windows where a single order can push price through your stop without any genuine market conviction behind the move.
When Mean Reversion Kills Accounts
Mean reversion kills accounts when it is applied to trending instruments. The mistake is so common that it has its own informal name among professional traders: picking up pennies in front of a steamroller. The payoff on a successful fade is typically a return to the mean, a relatively modest gain. The loss on a failed fade in a trending market can be multiples of that if the stop is not tight and clearly defined.
The scenarios that most consistently produce catastrophic mean reversion losses follow a recognisable pattern. A market has been trending for weeks. It extends sharply in one session. A trader looks at an RSI reading, decides the move is overdone, and fades it. The market continues moving in the trend direction. The trader adds to the position, reasoning that the extreme is even more extreme now and reversion is even more likely. The losses compound. The position eventually becomes too large to manage rationally.
This is not a failure of the mean reversion concept. It is a failure to check whether the preconditions for applying it were actually present. In a confirmed trend, they were not.
| Factor | Mean Reversion | Trend Following |
|---|---|---|
| Market Regime | Ranging, defined boundaries | Trending, directionally persistent |
| Trade Direction | Against the recent move | With the prevailing direction |
| Target Type | Fixed: return to mean or opposite range boundary | Trailing: hold as long as trend is intact |
| Typical Win Rate | Higher (55% to 70%) in correct conditions | Lower (30% to 45%), compensated by win size |
| Average Win/Loss Ratio | Close to 1:1, reliant on high win rate | 3:1 to 6:1, reliant on letting wins run |
| Catastrophic Failure Mode | Applying in a trend: unlimited downside on fades | Abandoning system during drawdown: missing the recovery |
| Best Instruments | FX pairs in range, sector ETFs in consolidation | Commodity futures, equity indices in macro trends |
| Hold Duration | Hours to days within the range | Weeks to months across the trend |
The Fade Discipline
Successful mean reversion requires a specific discipline at entry and exit that is different from any other style. The entry is made against recent price action, which creates immediate psychological pressure. Price is moving away from you as you enter. The instinct to wait for confirmation that the move has stopped is understandable, but by the time a reversal is confirmed, the entry price is significantly worse and the risk/reward has deteriorated.
The practised fade trader enters at the extreme and accepts that the position may initially continue moving against them within a defined tolerance. The stop is placed at a level that represents genuine structural invalidation, the point at which the range assumption is demonstrably broken, not simply at a comfortable distance from the entry.
Exit discipline is equally specific. Mean reversion trades are not held beyond their structural target. Once price has returned to the mean or the opposite range boundary, the trade is closed. The temptation to hold for a continuation past that point is where many fade traders turn a profitable approach into a breakeven one, giving back the gain waiting for a trend that the market regime does not support.
Action Items
- Before any mean reversion entry, confirm the market regime explicitly. Is the instrument in a defined range? What are the clear boundaries? How many touches of each boundary have there been?
- Add a trend check to your pre-trade routine. If price is above its 20-day and 50-day averages with both averages sloping upward, do not fade intraday bounces against that trend on the short side.
- Define the stop for every mean reversion trade at structural invalidation, not at a dollar amount. The stop should be at the level where the range is demonstrably broken, not where the loss feels uncomfortable.
- Set a hard target at the mean or opposite boundary. Exit fully there. Do not hold for more without a separately justified reason.
- Track every mean reversion loss over the next month. For each one, check: was the instrument in a defined range at the time of entry? If not, the loss was structural, not bad luck.
Continue Learning
- Titan Playbook 05: Trend Following
- Titan Playbook 01: Trading Styles Overview
- What Is a Stop Loss?
- Risk/Reward Ratio Explained
- Building a Trading Routine