Russell 2000 (RTY) – Daily Read
24 September 2026 | Index | Titan Macro Desk
2,838.7
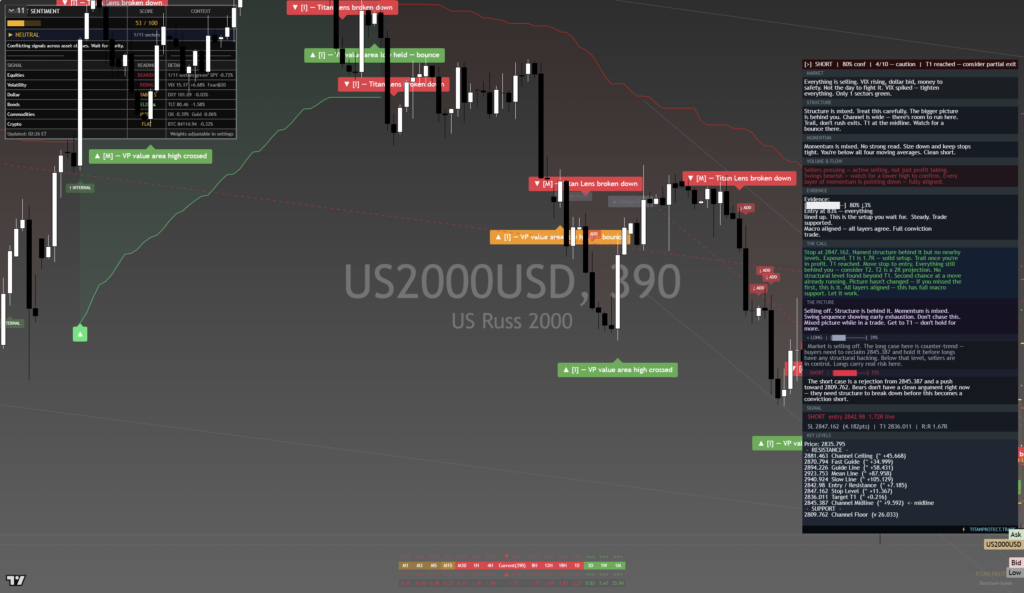
Russell 2000 (RTY) is testing a critical floor with sellers still controlling the broader structure. Last price 2,839, 0.0 percent lower on the day. That flat headline understates the pressure beneath the surface: it is down near the floor of its one-month range, and recent weakness leaves the index vulnerable to another leg lower. The clear view is defensive while support is under examination, although the proximity of that support creates scope for a sharp rebound if sellers fail to force a breakdown.
The macro backdrop matters because smaller companies are especially sensitive to financing conditions, domestic growth expectations, and confidence in the economic outlook. A firmer rate environment or renewed growth concern would weigh more heavily on this index than on larger, cash-rich peers. Conversely, easing financial pressure and improving confidence could quickly attract buyers into an asset class that has already absorbed meaningful selling. Momentum roughly 2.2 percent down over the last two weeks, showing that the immediate burden remains on buyers to prove exhaustion rather than merely point to an apparently cheap level.
The one month average 2,902 sits above price, and the structure reads as a downtrend, price under both its one-month and longer averages. That makes 2,902 an important recovery marker because reclaiming it would show that demand is beginning to repair the damaged structure. The nearer round number handle at 2,850 is the first test. Holding above it would improve the tone, while repeated rejection there would confirm that sellers remain active on modest rebounds. A shelf of support at 2,832, about 0.2 percent below, is the immediate line of defence and also the lower boundary of the three month range 2,832 to 3,070. Buyers must defend it to preserve the range. The other nearer round number handle at 2,800 is the next psychological and positioning reference if that defence fails. The month swing high 2,977, about 4.9 percent above the current price, is the major upside barrier because clearing it would overturn the recent sequence of weakness.
The bull path is straightforward: if 2,832 holds, then a recovery through 2,850 can develop into a test of 2,902. If buyers then sustain acceptance above that area, the market can challenge the month swing high. A decisive move above 2,977 opens the path toward 3,070, signalling that the range floor successfully absorbed supply. The bear path is equally clear: if rebounds stall below 2,850 and pressure returns, then losing 2,832 exposes 2,800. Failure there would imply that the range has broken and that weakness is broadening rather than simply probing support.
The main risk to the bearish lean is a forceful recovery that holds above 2,902, because that would weaken the case that sellers retain control. The bullish rebound case is invalidated by sustained trade below 2,832, especially if 2,800 cannot attract committed demand. Net, the index is at a decision point, but proximity to support is not itself a reason to turn bullish. Until buyers reclaim the nearby barriers, rallies remain corrective and downside risk remains live.
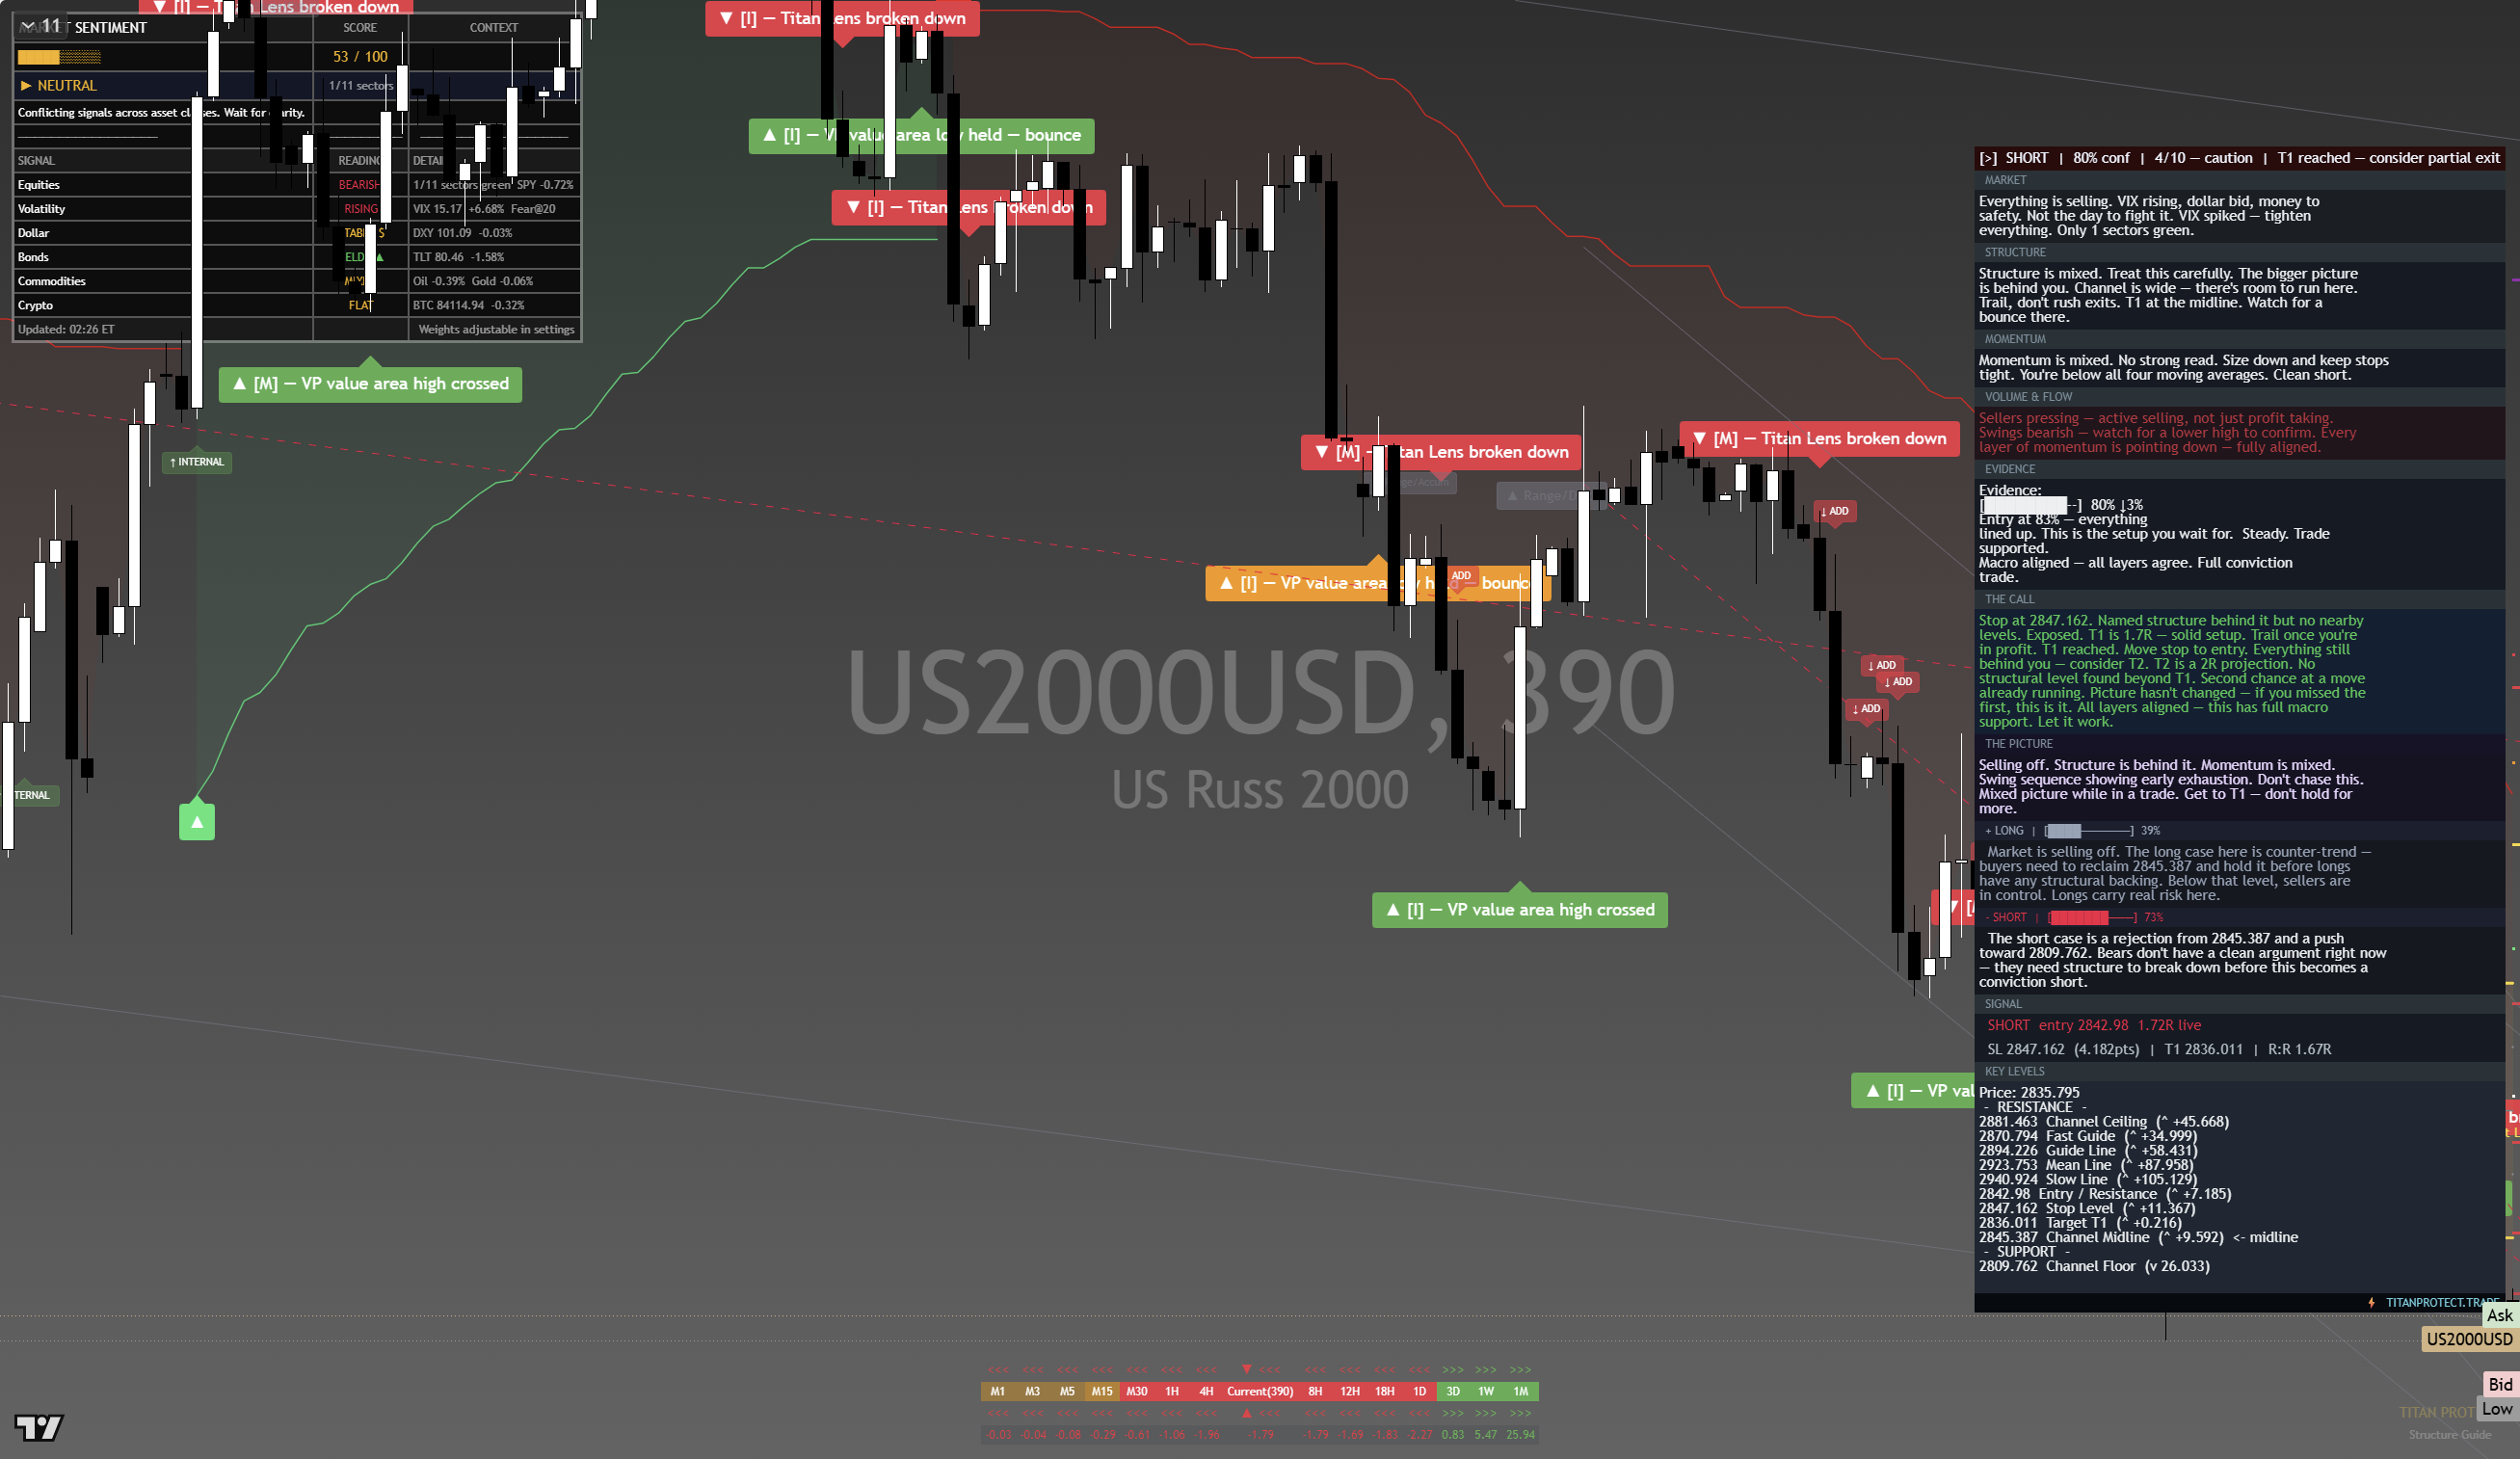
The chart above is the full daily read: structure, momentum, the levels that matter, and where the current price sits against them. Read it top to bottom for the complete picture, and pair it with our session briefs for the wider market context.
This is analysis, not financial advice. It reflects our multi-factor framework and is not a recommendation to buy or sell. Always do your own research and manage your risk.