S&P 500 (SPX) – Daily Read
21 September 2026 | Index | Titan Macro Desk
7,650.5
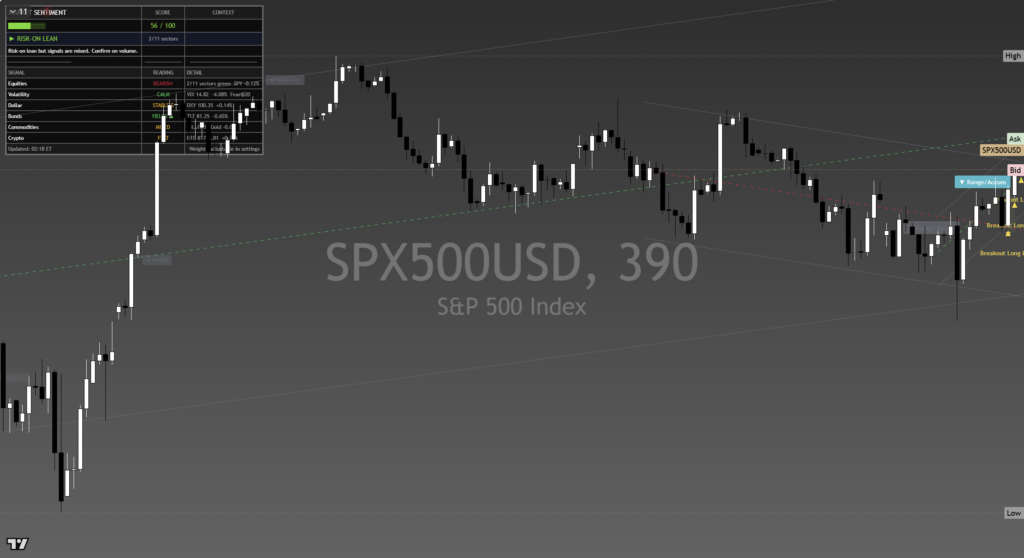
The S&P 500 is consolidating within an established upward trend, but the near-term balance is less comfortable than the flat headline suggests. The last price is 7,650, 0.0 percent higher on the day, leaving the index caught between resilient underlying demand and a pullback that has not yet found a decisive direction. The clear view is cautiously constructive while support holds, although buyers still need to reclaim nearby overhead territory before the market can resume its advance with conviction.
The macro backdrop remains a contest between confidence in growth and sensitivity to the rates outlook. That matters particularly for an index whose leadership can be vulnerable when financing conditions tighten or earnings expectations lose momentum. At present, the absence of strong directional follow-through suggests investors are assessing those crosscurrents rather than making a broad risk-on or risk-off commitment. The index is sitting mid-range over the past month, which reinforces that sense of balance. Momentum is roughly 0.8 percent up over the last two weeks, so the tape retains a modest positive bias, but it is not yet powerful enough to settle the argument.
The one month average is 7,660; price is below it, and the structure reads as a pullback, slipping under the one-month average while the longer trend still points up. That makes 7,660 the first test of whether buyers can regain control rather than merely defend weakness. Above there, 7,750 is the nearer round number handle where supply may thicken as traders reassess exposure. The month swing high is 7,771, about 1.6 percent above the current price, and it is the more important ceiling because clearing it would confirm that the pullback has been absorbed.
On the downside, a shelf of support at 7,508, about 1.9 percent below, is where buyers must demonstrate that the longer upward structure remains intact. The nearby 7,500 round number handle adds psychological importance and should attract defensive demand, but repeated tests would weaken that protection. The three month range is 7,294 to 7,817, framing the broader battlefield and showing that current trade remains in its upper half without being at an extreme.
The bull path is straightforward: if the index retakes 7,660, establishes acceptance above 7,750, and then delivers a decisive move above 7,771, that opens the path toward 7,817. Such a sequence would show that sellers have been absorbed and that buyers are again willing to pay through resistance. The bear path begins if rebounds repeatedly fail below 7,660 and pressure builds toward support. Losing 7,508 exposes 7,294, because the failure would convert an orderly pullback into a broader deterioration and leave the lower boundary of the three month range as the next meaningful reference.
The main risk to the constructive read is that macro uncertainty turns consolidation into sustained de-risking. A failure at overhead levels alone would not invalidate the trend, but a clean loss of support would. Net, the S&P 500 remains a buy-the-dip structure under pressure, with confirmation above resistance required before confidence should rise.
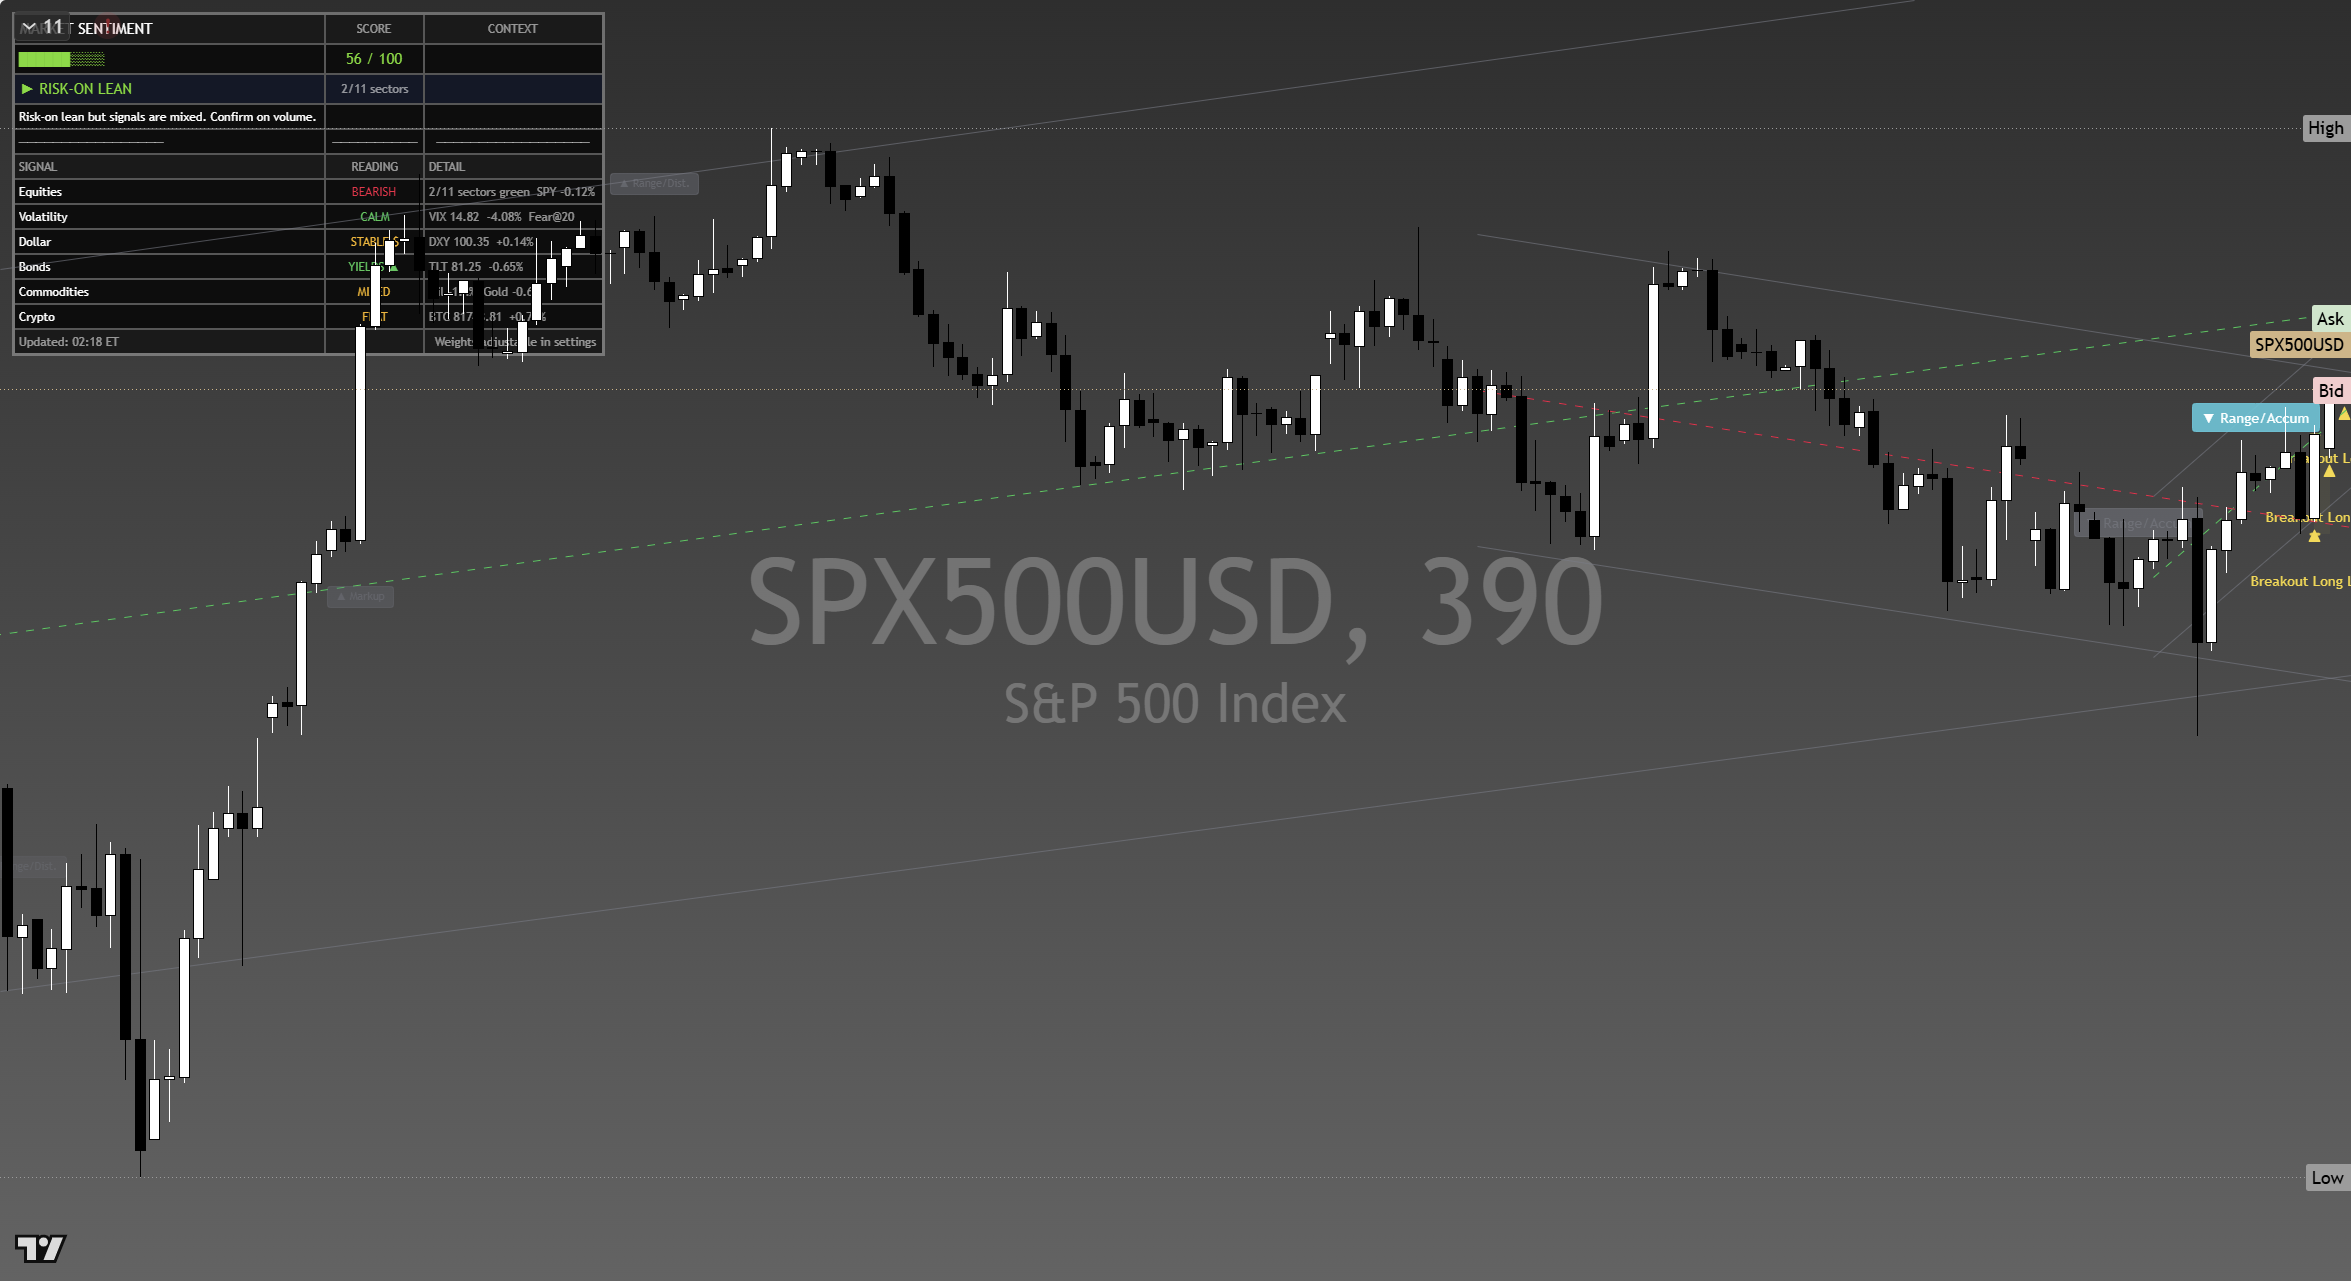
The chart above is the full daily read: structure, momentum, the levels that matter, and where the current price sits against them. Read it top to bottom for the complete picture, and pair it with our session briefs for the wider market context.
This is analysis, not financial advice. It reflects our multi-factor framework and is not a recommendation to buy or sell. Always do your own research and manage your risk.