
The SP500 Framework Journal for July 2026, newest read at the top. Each dated entry is our read on the close, kept as a living record so the framework can be judged over time. This is analysis, not financial advice.
Friday 31 Jul 2026
7,485.0
Equity indices open the week defensive after Friday’s chip-led drop, with the Nasdaq still below its 29,000 pivot and the market waiting on Wednesday’s mega-cap earnings before it commits either way.
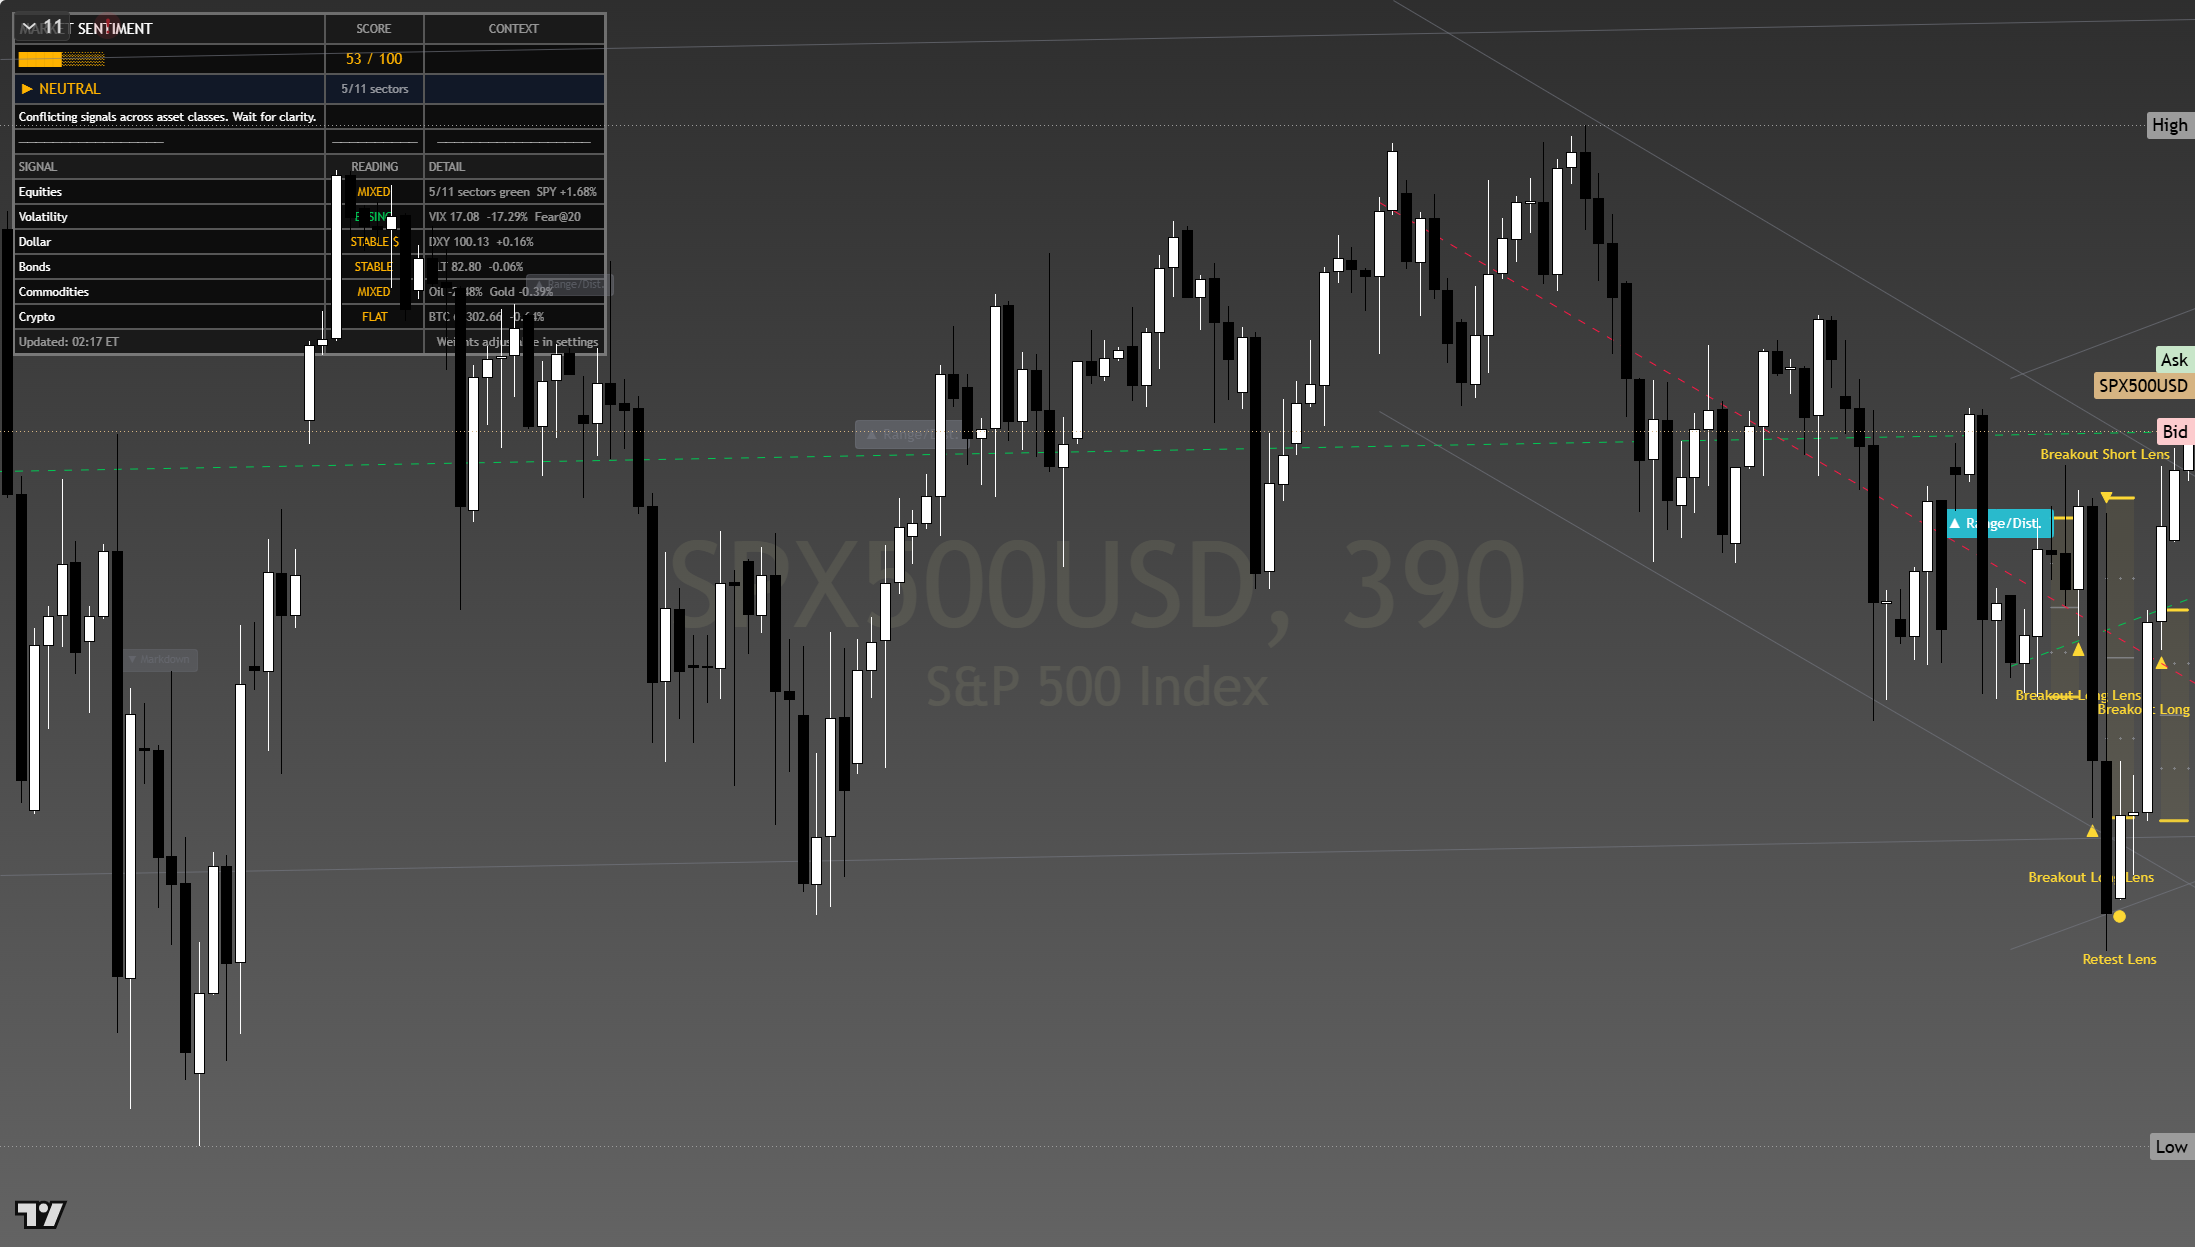
The chart above is the full daily read: structure, momentum, the levels that matter, and where the current price sits against them. Read it top to bottom for the complete picture, and pair it with our session briefs for the wider market context.
This is analysis, not financial advice. It reflects our multi-factor framework and is not a recommendation to buy or sell. Always do your own research and manage your risk.
Thursday 30 Jul 2026
7,343.2
Equity indices open the week defensive after Friday’s chip-led drop, with the Nasdaq still below its 29,000 pivot and the market waiting on Wednesday’s mega-cap earnings before it commits either way.
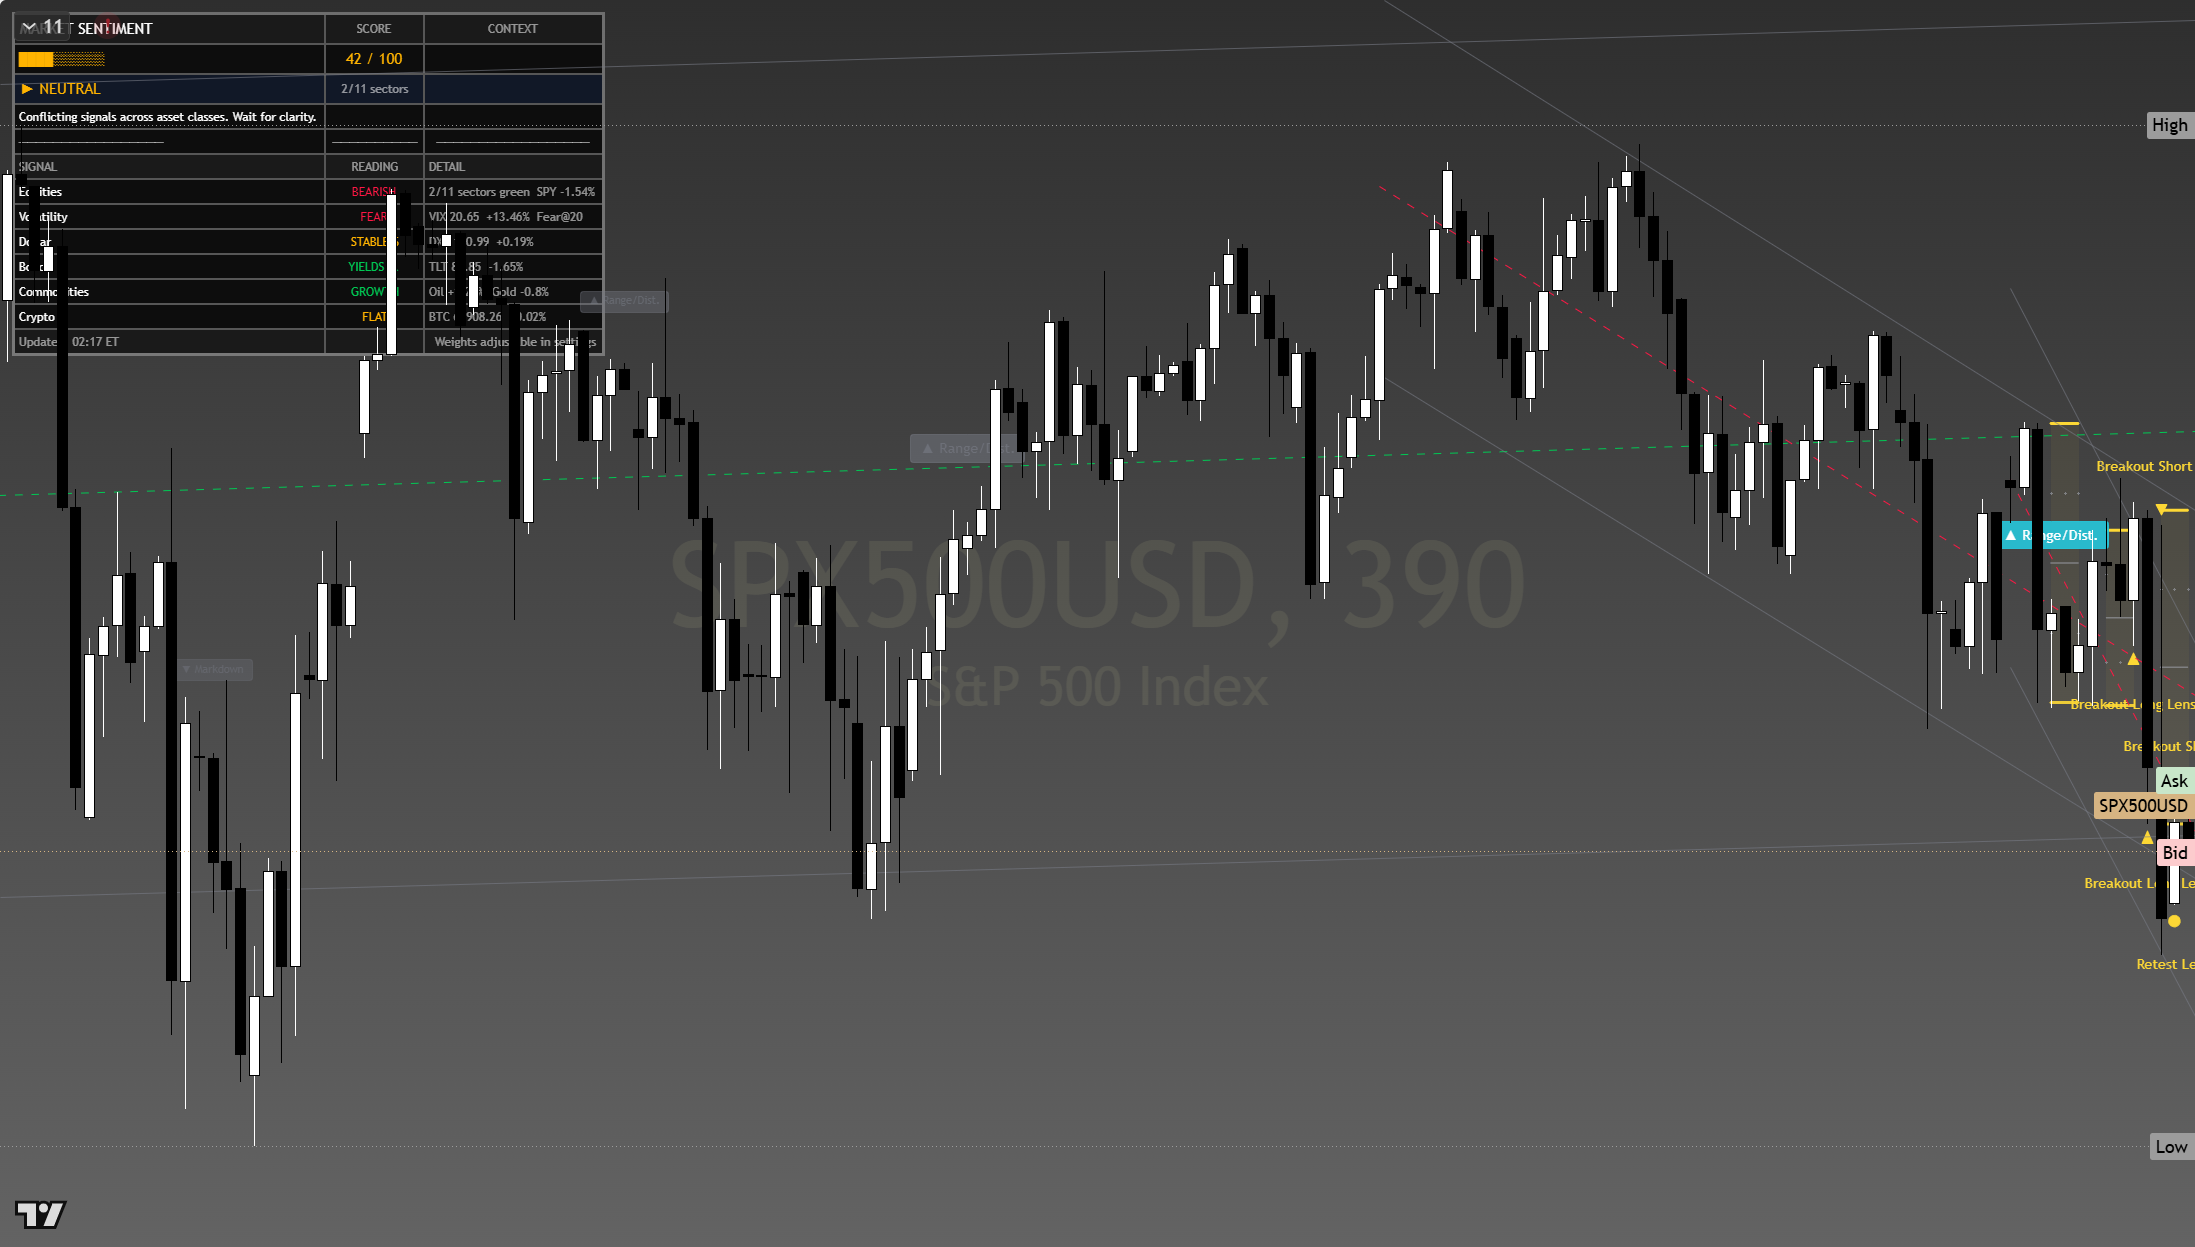
The chart above is the full daily read: structure, momentum, the levels that matter, and where the current price sits against them. Read it top to bottom for the complete picture, and pair it with our session briefs for the wider market context.
This is analysis, not financial advice. It reflects our multi-factor framework and is not a recommendation to buy or sell. Always do your own research and manage your risk.
Wednesday 29 Jul 2026
7,429.6
Equity indices open the week defensive after Friday’s chip-led drop, with the Nasdaq still below its 29,000 pivot and the market waiting on Wednesday’s mega-cap earnings before it commits either way.

The chart above is the full daily read: structure, momentum, the levels that matter, and where the current price sits against them. Read it top to bottom for the complete picture, and pair it with our session briefs for the wider market context.
This is analysis, not financial advice. It reflects our multi-factor framework and is not a recommendation to buy or sell. Always do your own research and manage your risk.
Tuesday 28 Jul 2026
7,393.8
Equity indices open the week defensive after Friday’s chip-led drop, with the Nasdaq still below its 29,000 pivot and the market waiting on Wednesday’s mega-cap earnings before it commits either way.
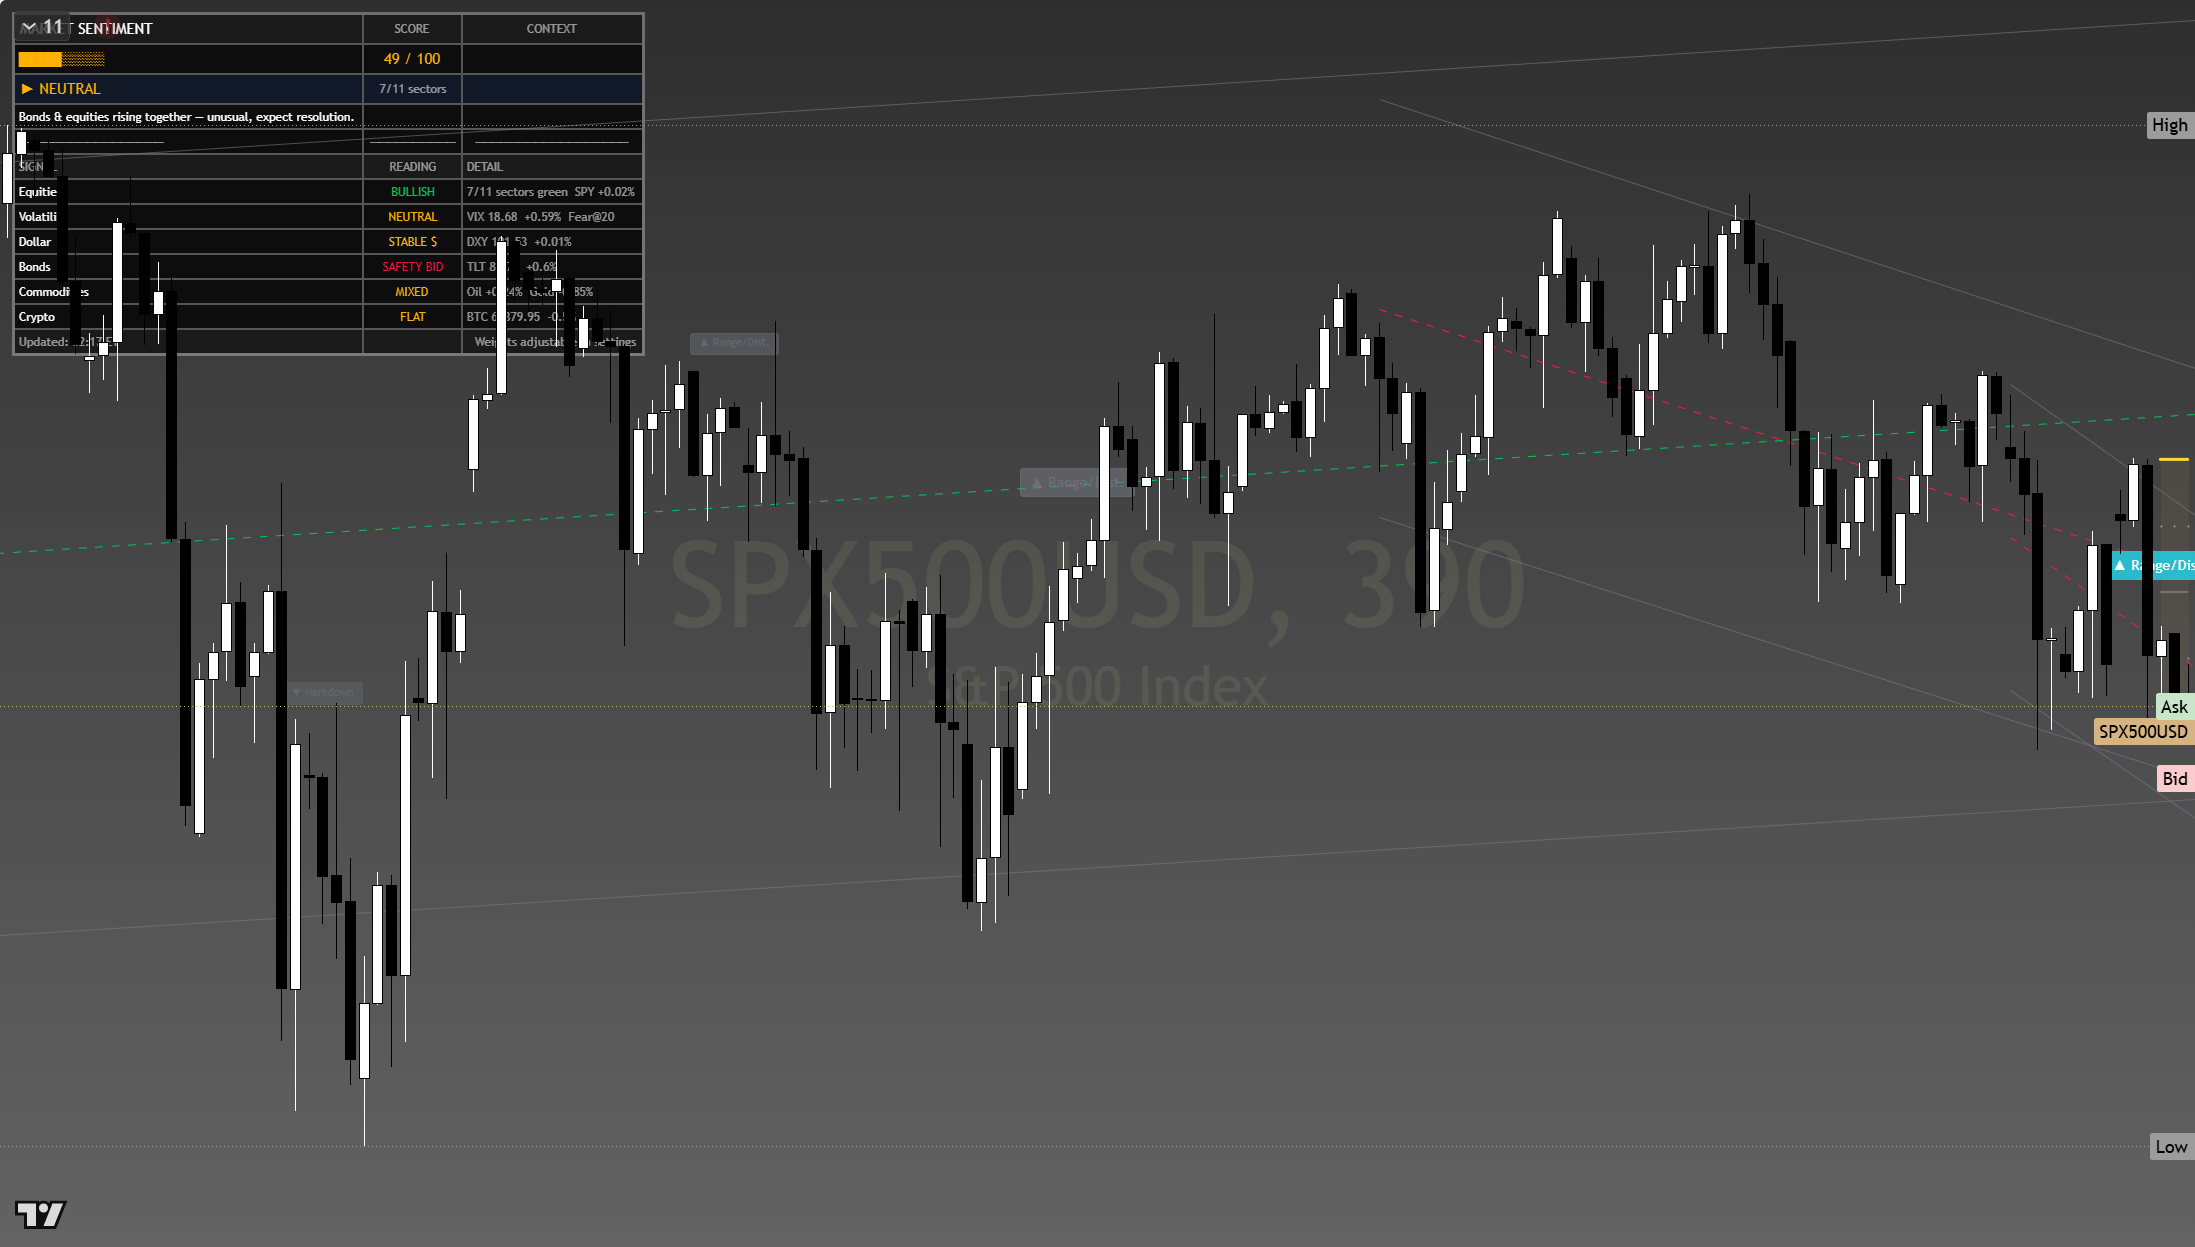
The chart above is the full daily read: structure, momentum, the levels that matter, and where the current price sits against them. Read it top to bottom for the complete picture, and pair it with our session briefs for the wider market context.
This is analysis, not financial advice. It reflects our multi-factor framework and is not a recommendation to buy or sell. Always do your own research and manage your risk.
Monday 27 Jul 2026
7,485.6
Equity indices open the week defensive after Friday’s chip-led drop, with the Nasdaq still below its 29,000 pivot and the market waiting on Wednesday’s mega-cap earnings before it commits either way.
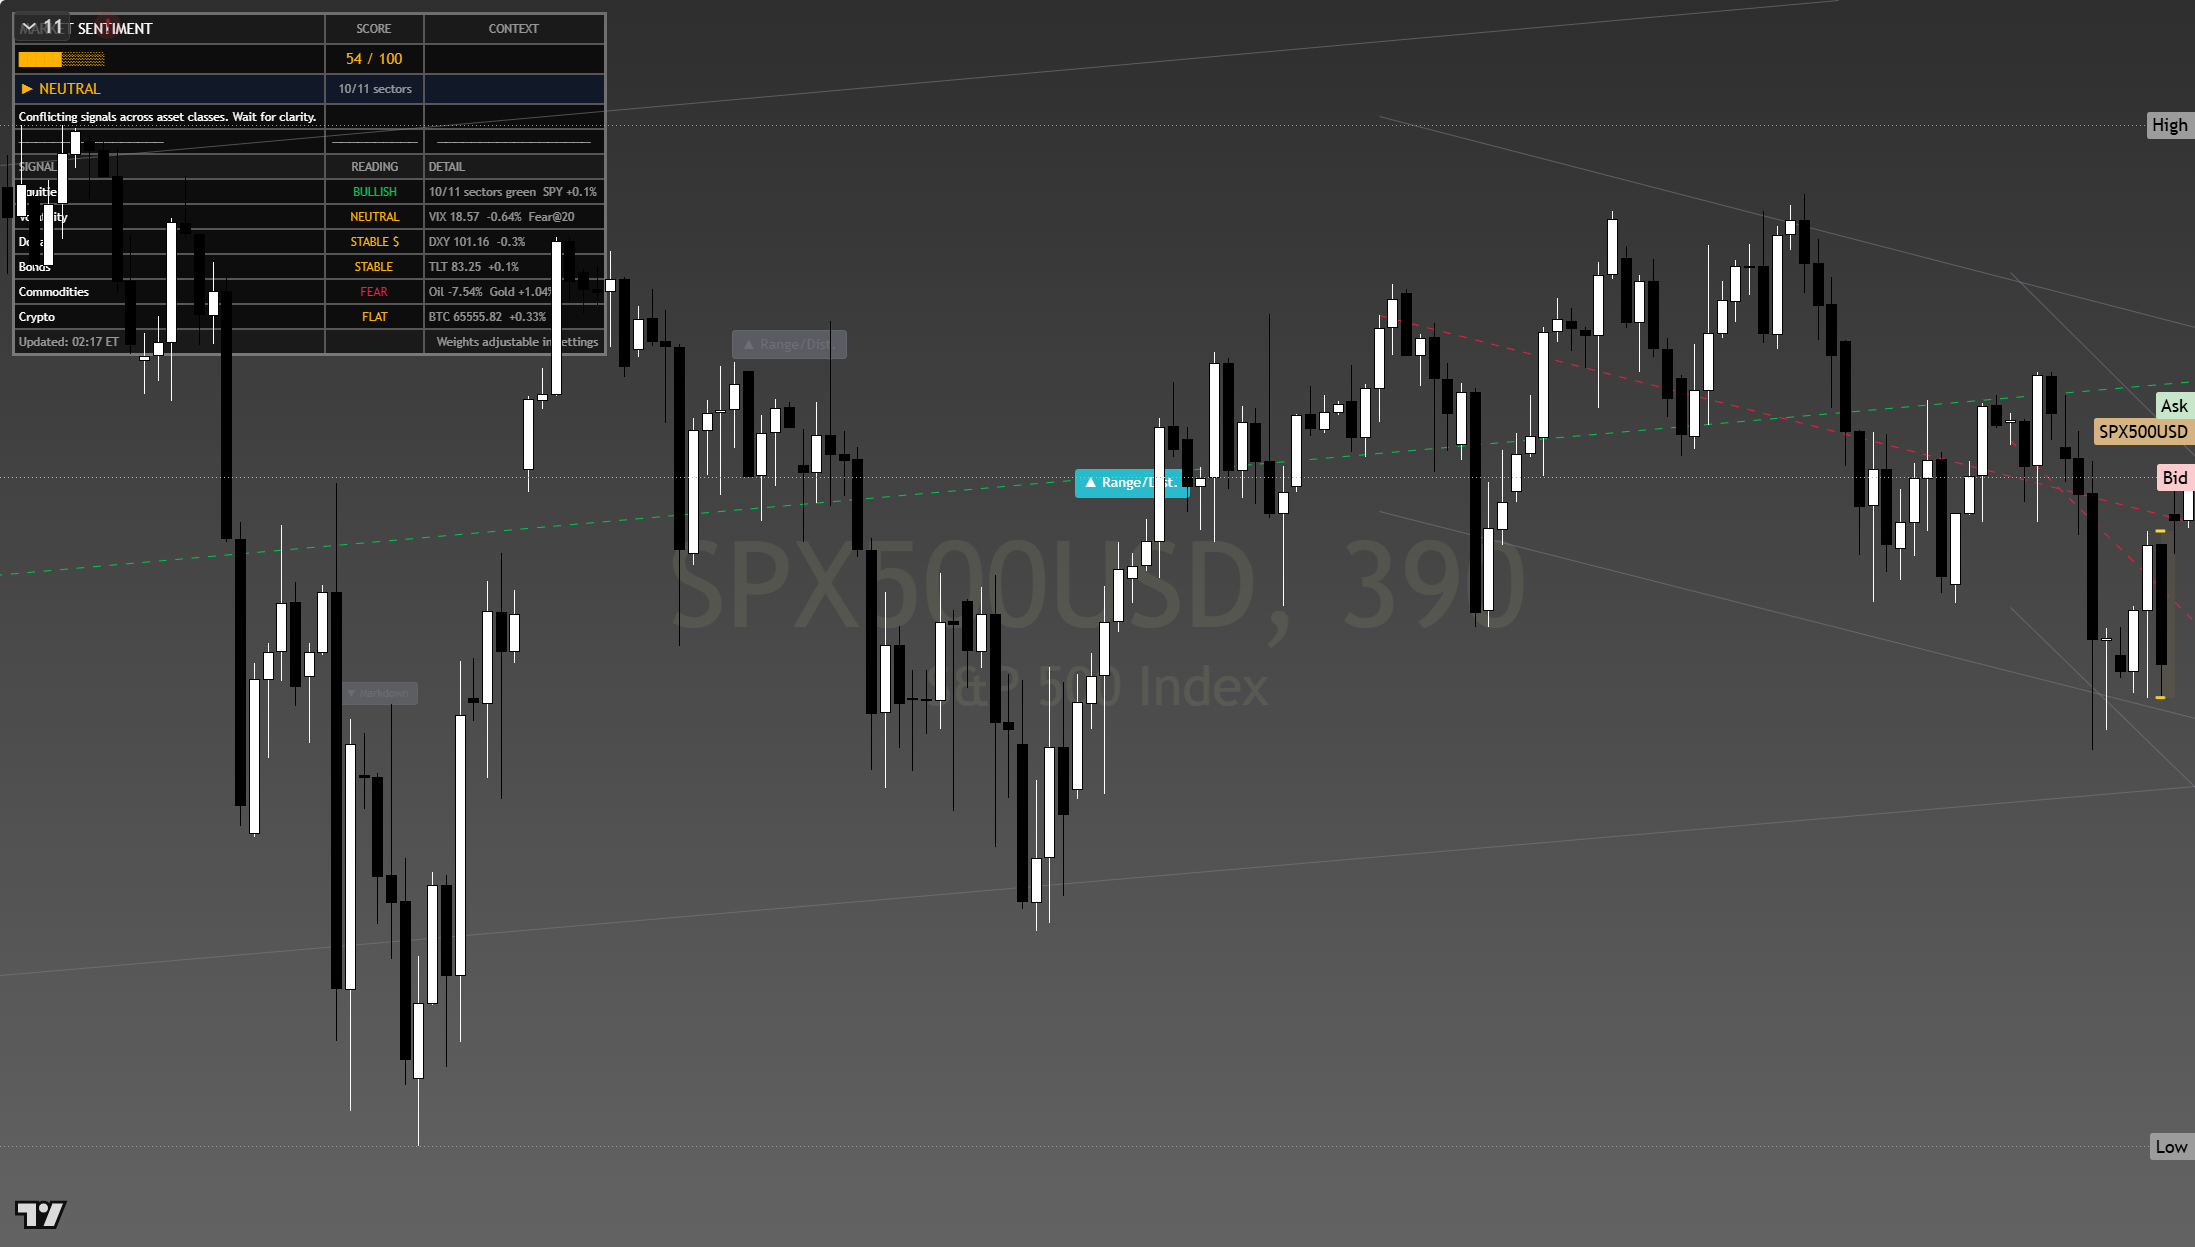
The chart above is the full daily read: structure, momentum, the levels that matter, and where the current price sits against them. Read it top to bottom for the complete picture, and pair it with our session briefs for the wider market context.
This is analysis, not financial advice. It reflects our multi-factor framework and is not a recommendation to buy or sell. Always do your own research and manage your risk.
Sunday 26 Jul 2026
7,415.8
Equity indices open the week defensive after Friday’s chip-led drop, with the Nasdaq still below its 29,000 pivot and the market waiting on Wednesday’s mega-cap earnings before it commits either way.
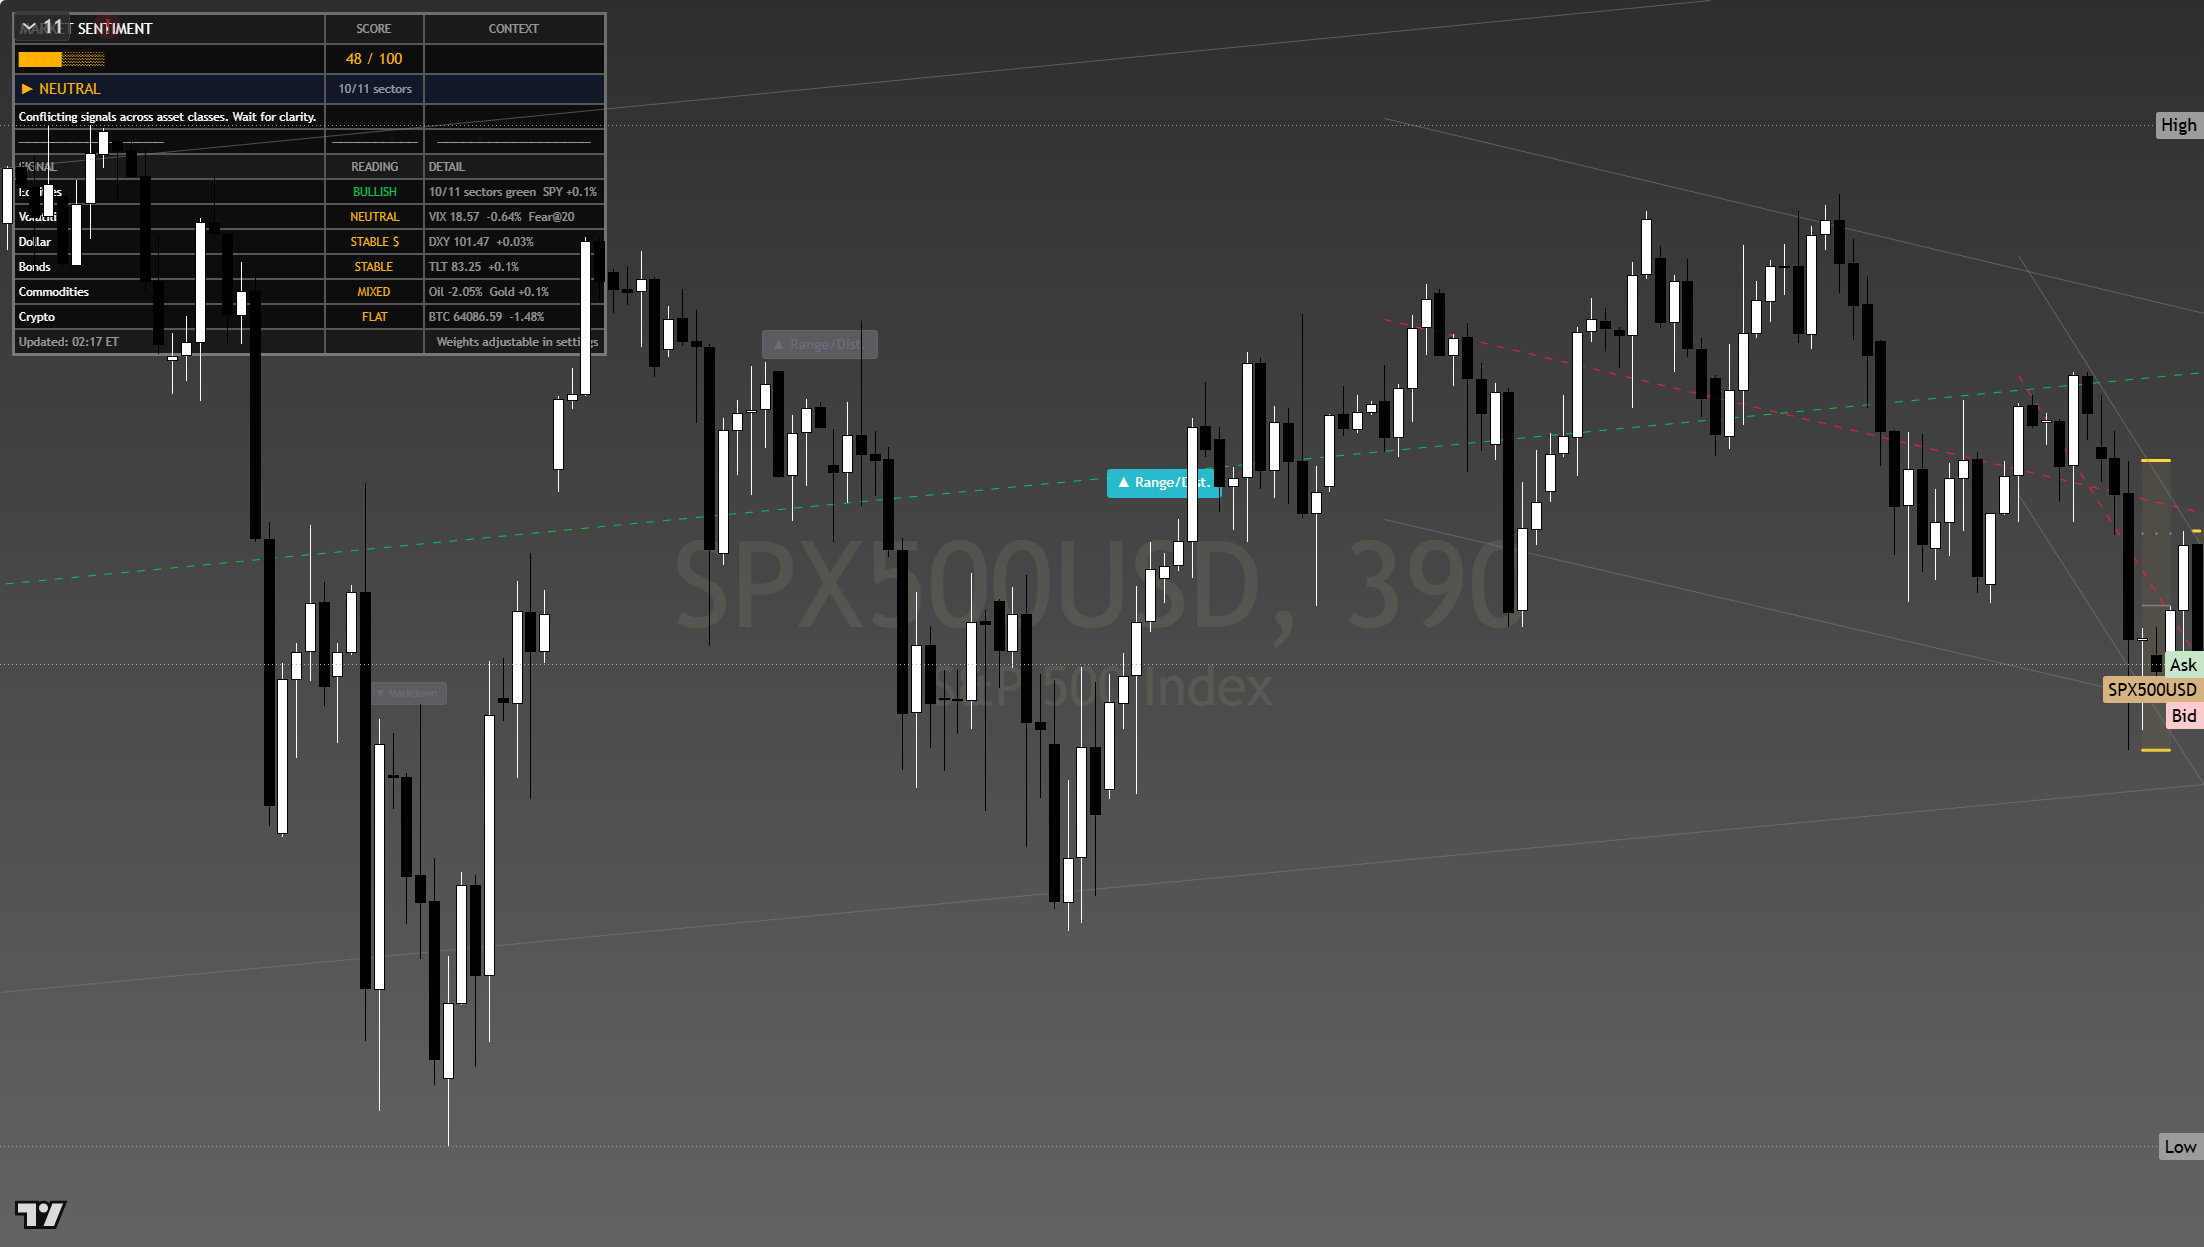
The chart above is the full daily read: structure, momentum, the levels that matter, and where the current price sits against them. Read it top to bottom for the complete picture, and pair it with our session briefs for the wider market context.
This is analysis, not financial advice. It reflects our multi-factor framework and is not a recommendation to buy or sell. Always do your own research and manage your risk.
Saturday 25 Jul 2026
7,415.8
Equity indices open the week defensive after Friday’s chip-led drop, with the Nasdaq still below its 29,000 pivot and the market waiting on Wednesday’s mega-cap earnings before it commits either way.
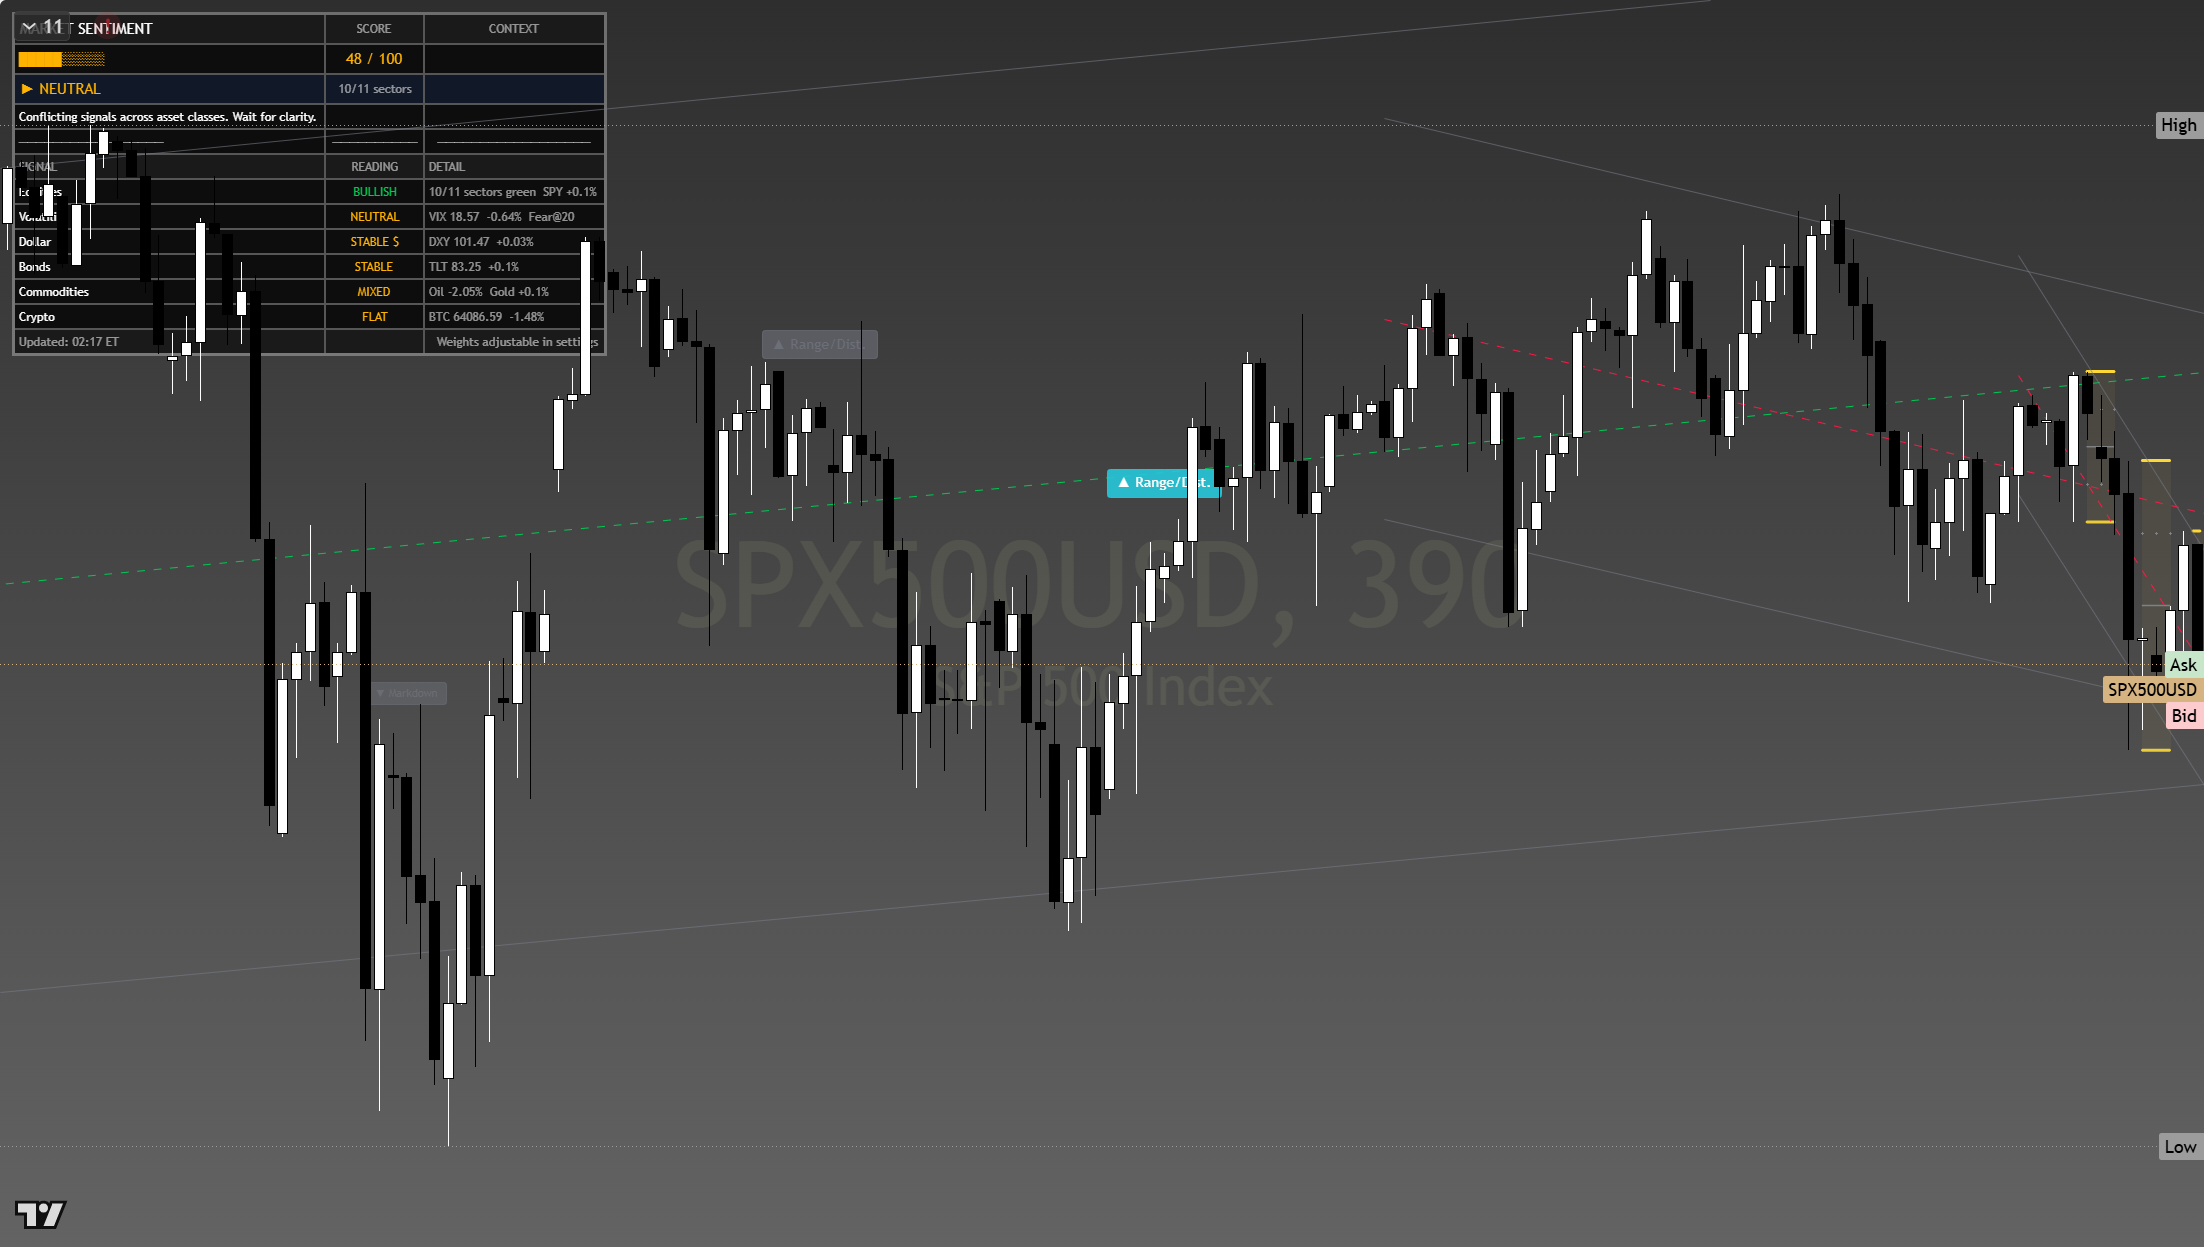
The chart above is the full daily read: structure, momentum, the levels that matter, and where the current price sits against them. Read it top to bottom for the complete picture, and pair it with our session briefs for the wider market context.
This is analysis, not financial advice. It reflects our multi-factor framework and is not a recommendation to buy or sell. Always do your own research and manage your risk.
Friday 24 Jul 2026
7,417.6
Equity indices open the week defensive after Friday’s chip-led drop, with the Nasdaq still below its 29,000 pivot and the market waiting on Wednesday’s mega-cap earnings before it commits either way.
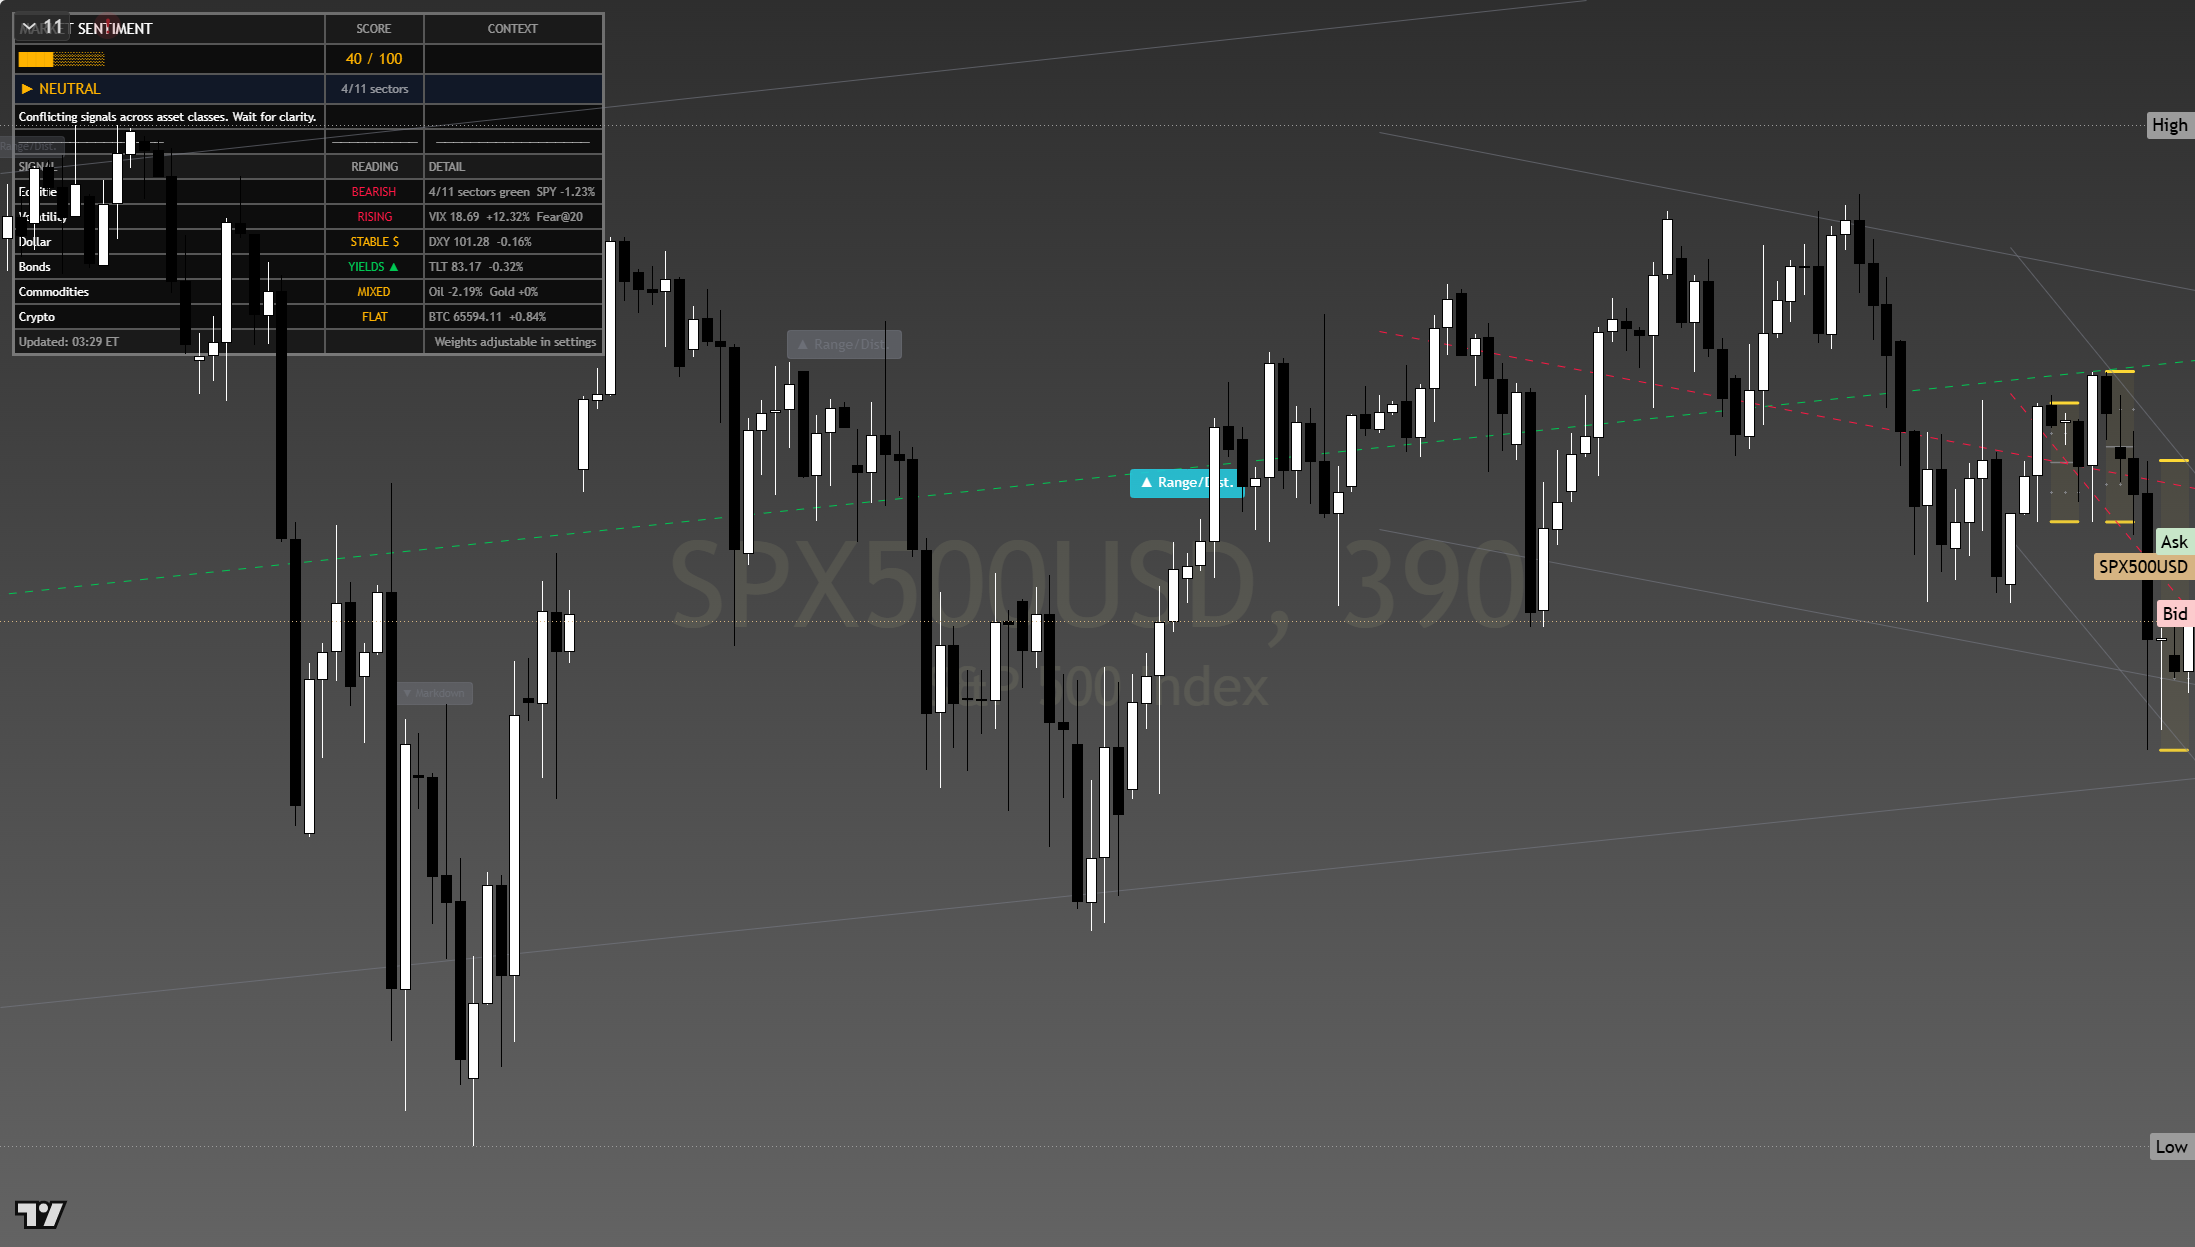
The chart above is the full daily read: structure, momentum, the levels that matter, and where the current price sits against them. Read it top to bottom for the complete picture, and pair it with our session briefs for the wider market context.
This is analysis, not financial advice. It reflects our multi-factor framework and is not a recommendation to buy or sell. Always do your own research and manage your risk.
Thursday 23 Jul 2026
7,448.2
Equity indices open the week defensive after Friday’s chip-led drop, with the Nasdaq still below its 29,000 pivot and the market waiting on Wednesday’s mega-cap earnings before it commits either way.
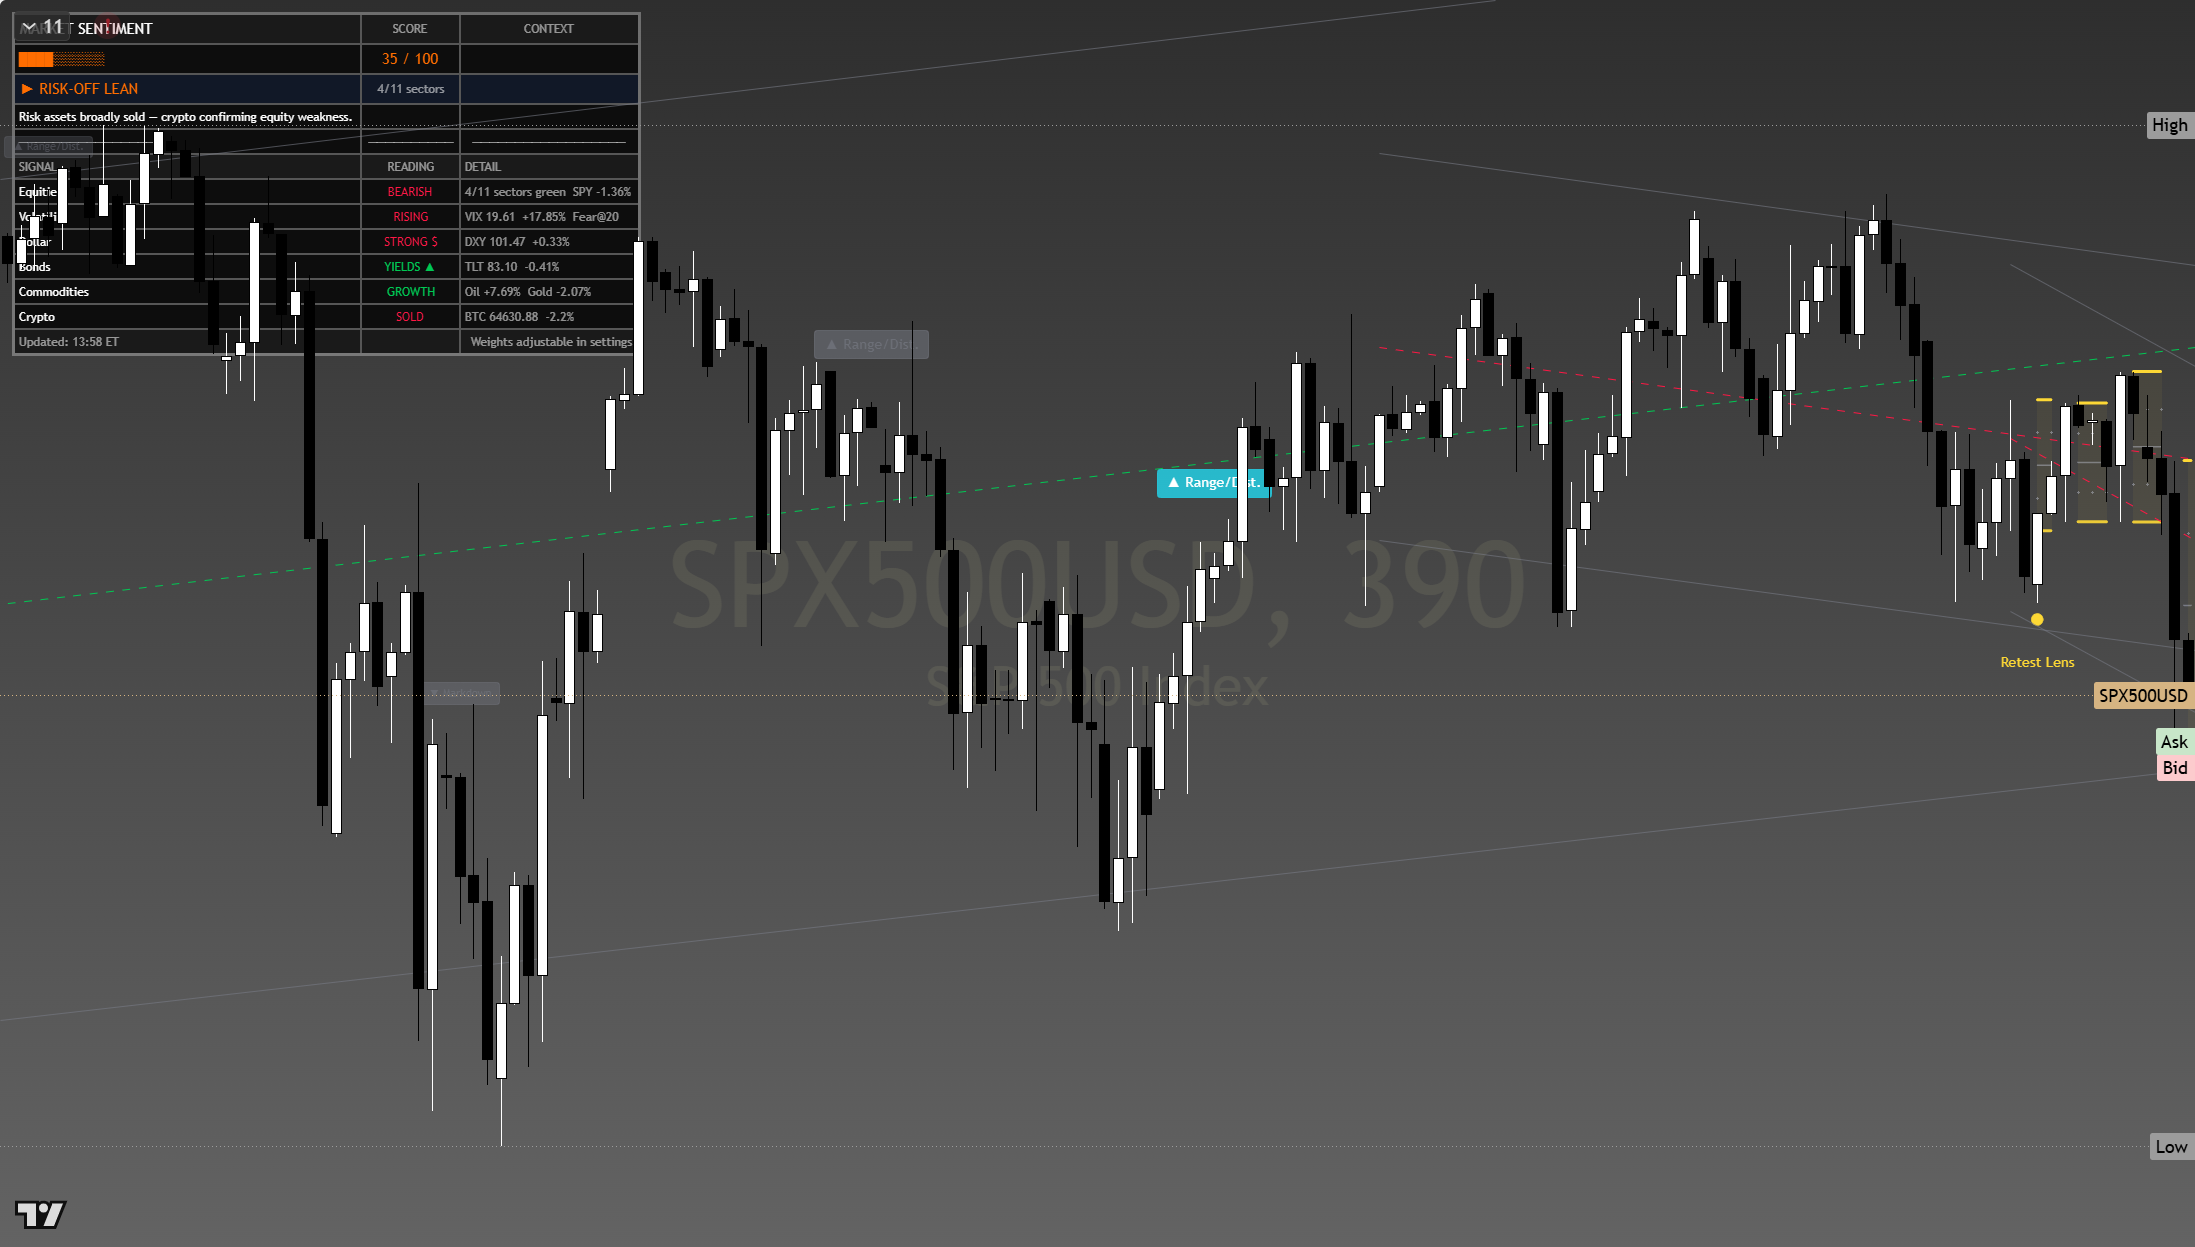
The chart above is the full daily read: structure, momentum, the levels that matter, and where the current price sits against them. Read it top to bottom for the complete picture, and pair it with our session briefs for the wider market context.
This is analysis, not financial advice. It reflects our multi-factor framework and is not a recommendation to buy or sell. Always do your own research and manage your risk.
Wednesday 22 Jul 2026
7,501.2
Equity indices open the week defensive after Friday’s chip-led drop, with the Nasdaq still below its 29,000 pivot and the market waiting on Wednesday’s mega-cap earnings before it commits either way.
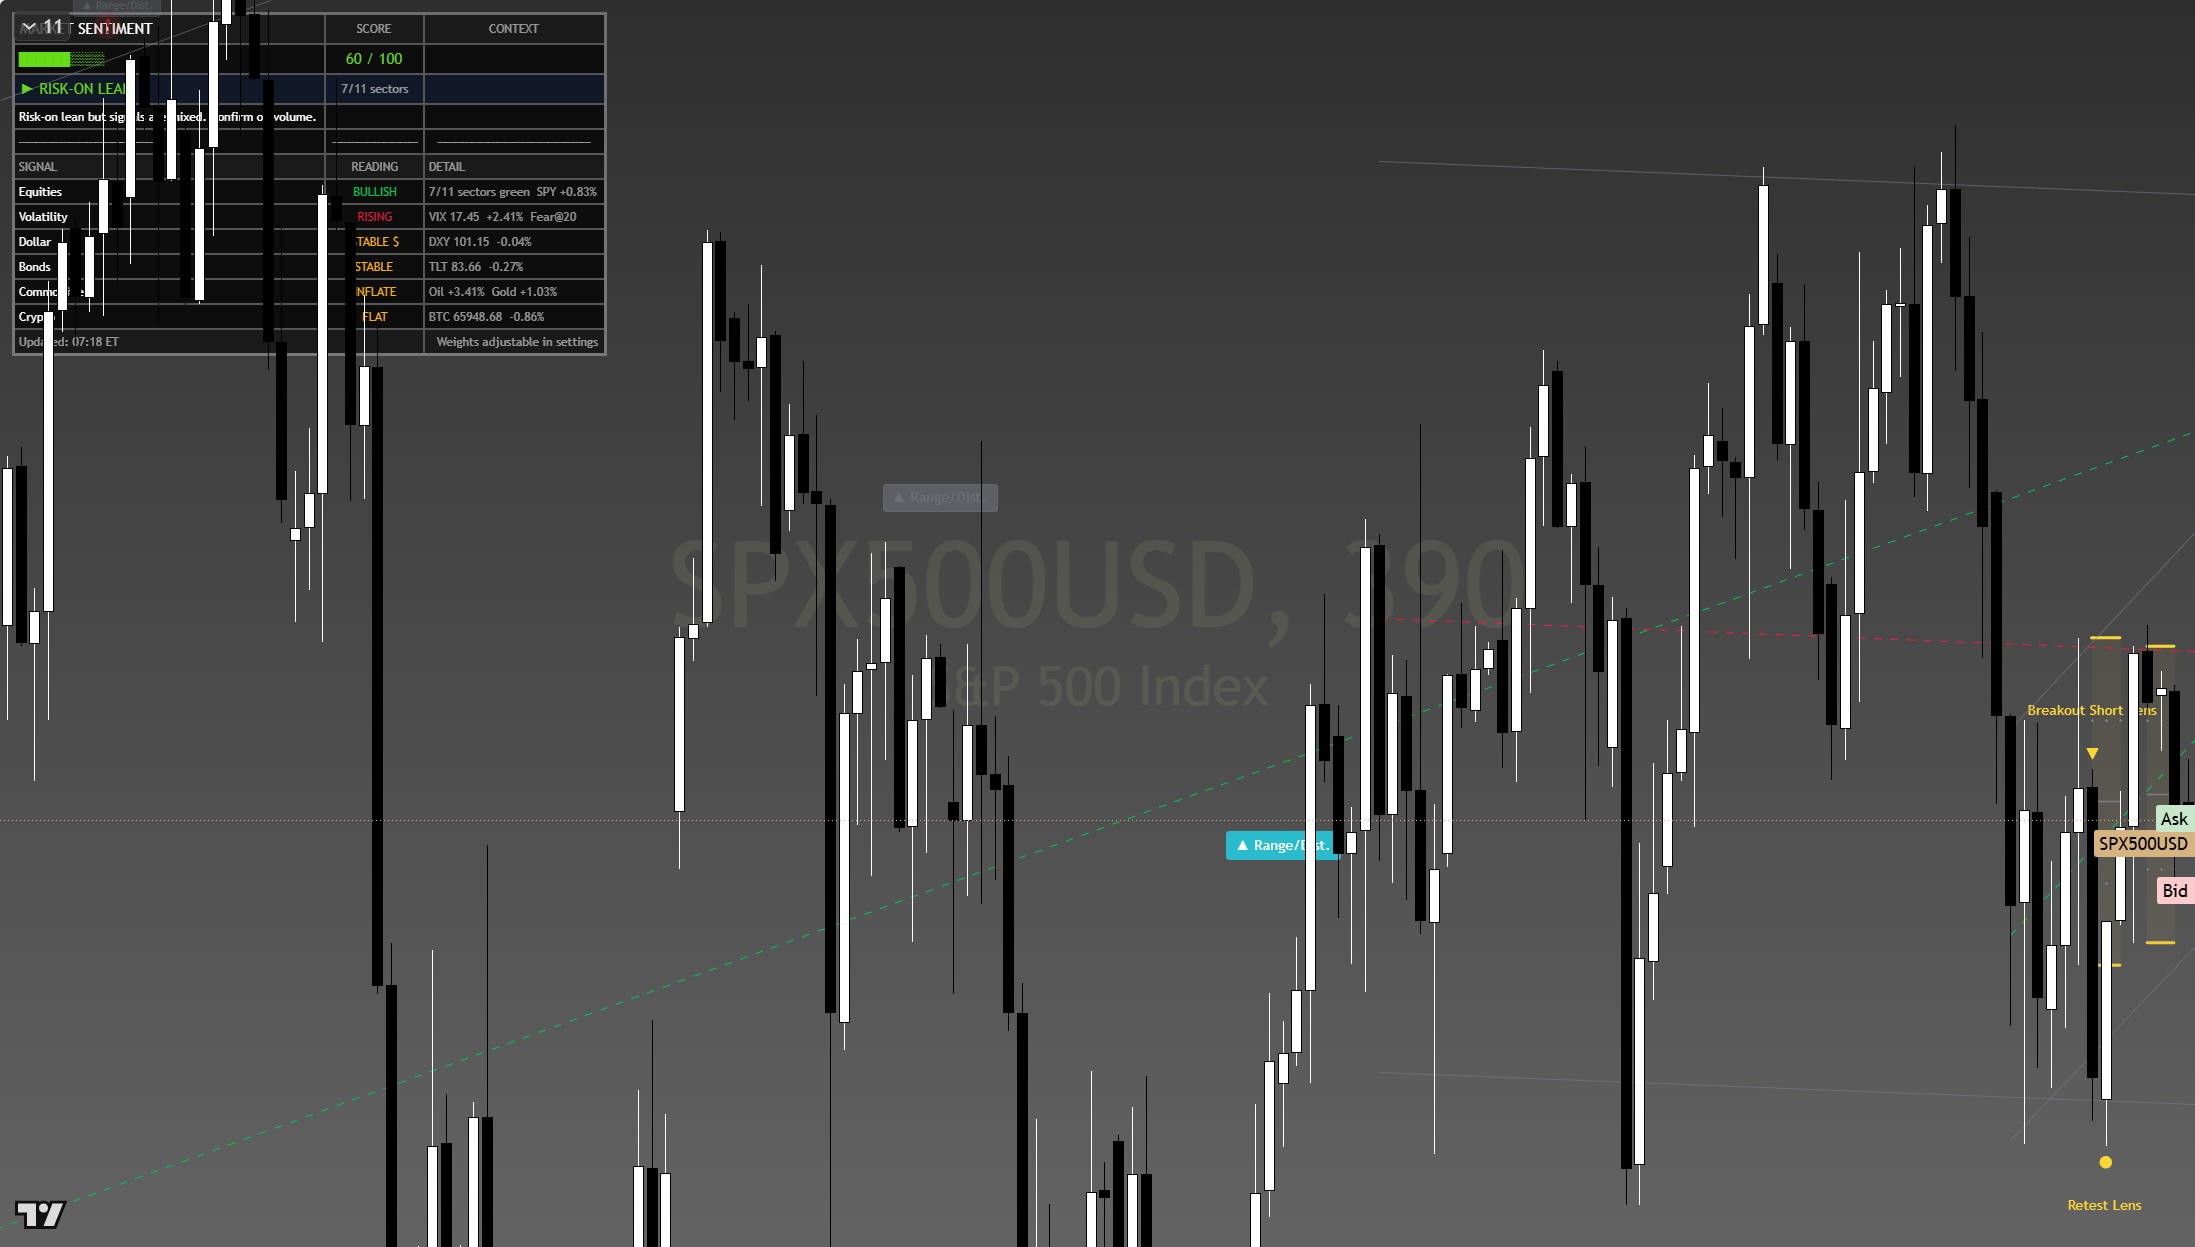
The chart above is the full daily read: structure, momentum, the levels that matter, and where the current price sits against them. Read it top to bottom for the complete picture, and pair it with our session briefs for the wider market context.
This is analysis, not financial advice. It reflects our multi-factor framework and is not a recommendation to buy or sell. Always do your own research and manage your risk.
Monday 20 Jul 2026
7,461.8
Equity indices open the week defensive after Friday’s chip-led drop, with the Nasdaq still below its 29,000 pivot and the market waiting on Wednesday’s mega-cap earnings before it commits either way.
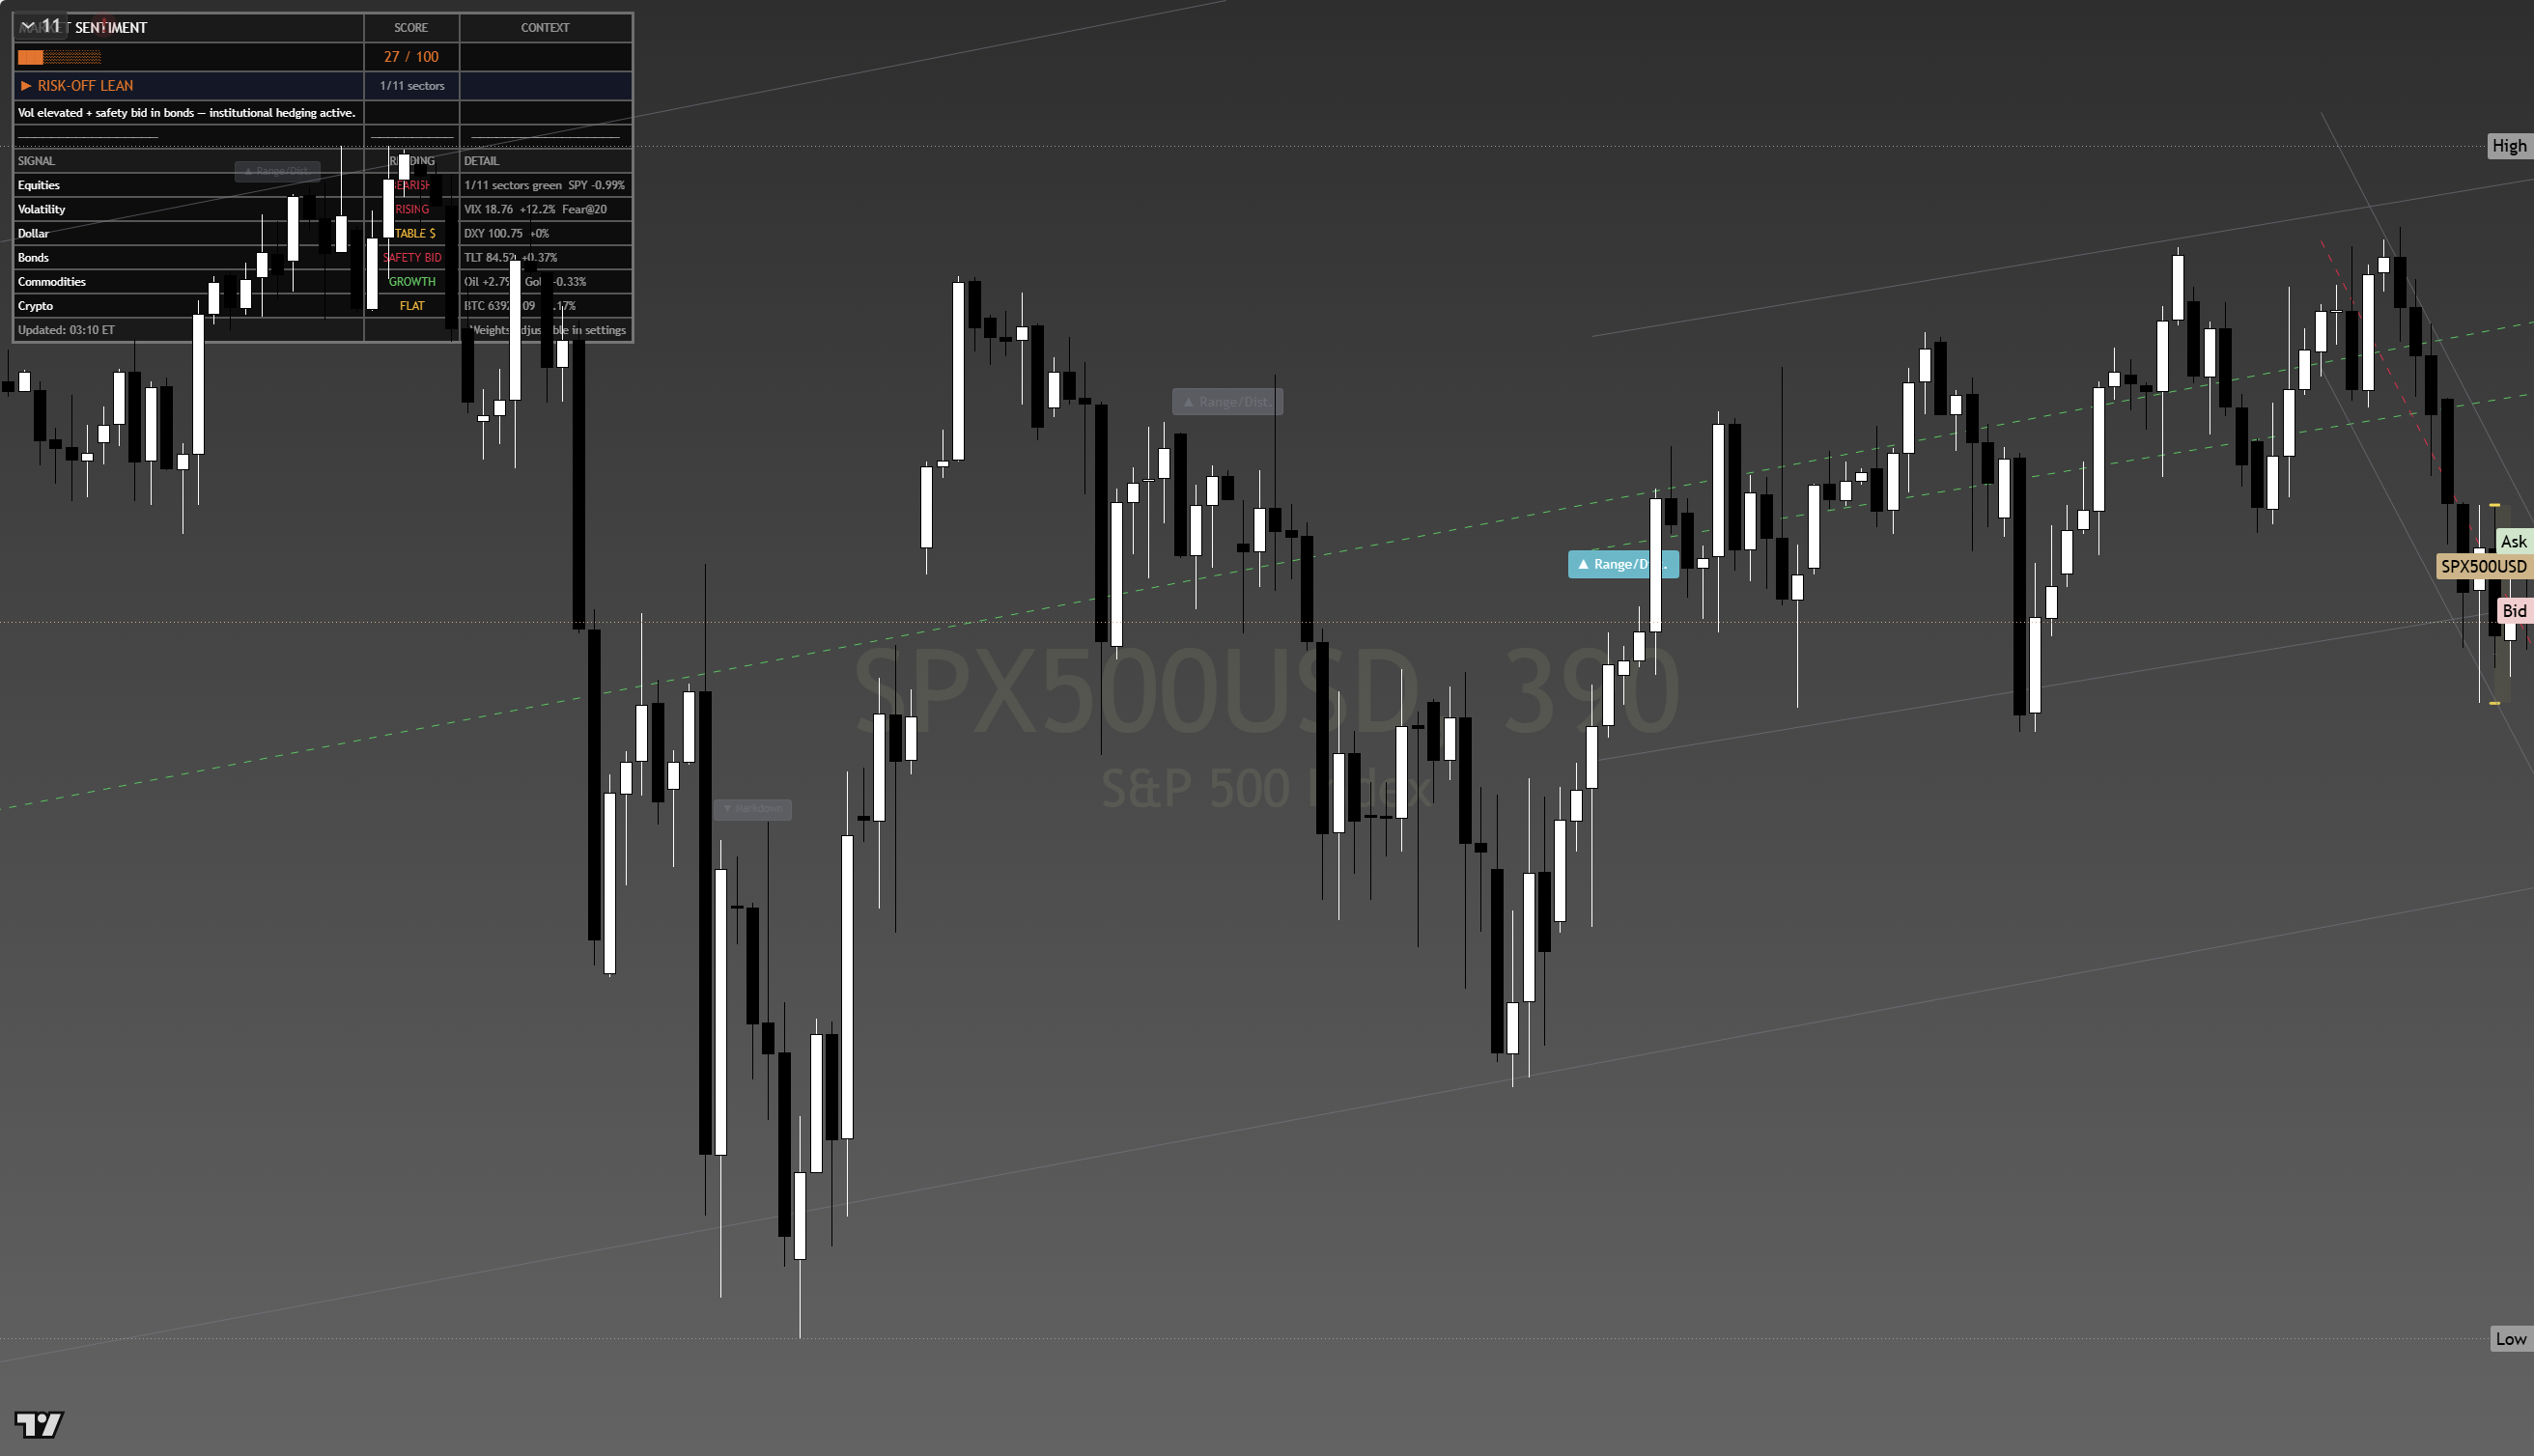
The chart above is the full framework read: structure, momentum, the levels that matter, and where the current price sits against them. Read it top to bottom for the complete picture, and pair it with our session briefs for the wider market context.
This is analysis, not financial advice. It reflects our multi-factor framework and is not a recommendation to buy or sell. Always do your own research and manage your risk.
Wednesday 15 Jul 2026
S&P 500 (SPX) Reclaims 7,543 on the Cool-CPI Relief Rally, 7,525 Settlement Pin Is the Line That Has to Hold: Daily Read 14 July 2026
S&P 500 (SPX) | Daily Framework Read | Tuesday 14 July 2026 (US cash close)
A soft June inflation print did the heavy lifting today. Headline prices fell 0.4% on the month against expectations of a 0.2% dip, the annual rate cooled to 3.5% from 3.8%, and Treasury yields dropped sharply, flipping what had been a nervy, de-risking tape into a broad relief bid. The S&P 500 (SPX) closed at 7,543.59, up 0.38% on the day, holding comfortably above the prior close of 7,515 that had capped the last two sessions. The catch is that the index finished only a fraction above the 7,525 options settlement pin, front-end volatility has been crushed to complacent levels, and crude did not get the cooling memo, sitting bid near 79.82 on the live Hormuz premium. The relief is real, but the follow-through has to be earned.
Framework thesis: Bullish with measured conviction. The cool-CPI dovish surprise and falling yields validate a push toward 7,575 and then the 7,600 round number, and the read stays constructive while the index holds the 7,515 breakout base. But the setup is not a clean green light. With the volatility index down at 16.5 and the front-end gauge under 14, there is very little cushion priced for a wobble, and the un-cooled oil premium is the one macro thread that can reprice equity risk overnight. Buy the reclaim, respect the pin, and keep size disciplined into tomorrow’s bank earnings.
Where it sits today
The S&P 500 (SPX) settled at 7,543.59, a gain of 28.25 points or 0.38% on the session. The index opened at 7,536.70, dipped to an early low of 7,513.23 as the inflation data was digested, then worked steadily higher to a session high of 7,557.44 before easing into the close. Volume ran near 2.8 billion shares, healthy participation behind the move rather than a thin drift.
The internal picture was uneven under a firm headline. Semiconductors led the tape and dragged the US Tech 100 (NAS100) up a punchier 1.1% to roughly 29,586, while the Dow finished close to flat, weighed by a 25% profit warning from IBM. That split matters: today’s index strength was concentrated in the rate-sensitive, growth end of the market that benefits most directly from lower yields, not a uniform, everything-participates advance. The broad tape got the dovish tailwind, but leadership is narrow.
The volatility index closed at 16.5, down 3.85% on the day and below its five-session average near 16.2, with the shorter-dated front-end reading dropping to 13.46. That is a market pricing calm. It is also a market with almost no premium set aside for a surprise, which is exactly the condition that turns a small catalyst into an outsized move.
What the framework reads
The composite read is constructive but not euphoric. The dovish inflation surprise is a genuine regime input, not noise. Cooler prices plus a sharp drop in yields remove the single biggest overhang that had been pressuring valuations, and the index responded by reclaiming the 7,515 shelf that had acted as a ceiling. When a market absorbs a supportive catalyst and closes near the highs of the range rather than fading it, the path of least resistance tilts higher into the next session.
Two cautions temper the conviction. First, the move is narrow. A relief rally carried by semiconductors while the Dow sits flat on a single-name profit warning is a market leaning on one engine. Broadening would confirm the thesis; failure to broaden would leave the index exposed if leadership stalls. Second, and more important for the days ahead, is the cooling-official-energy against rising-live-oil split. The inflation report is a rear-view mirror on prices that were already softening, while crude is trading forward on a live geopolitical premium, bid near 79.82 with Brent up above 85. If that oil bid persists or extends, it feeds directly back into the next inflation print and undercuts the very dovish story that powered today’s rally. The market is currently choosing to look through it. That is a choice, not a settled fact.
Net, the framework carries a bullish bias into 15 July with moderate conviction. The reclaim is respected, the trend structure is intact above 7,515, and the burden of proof sits with the bears to reclaim that base. But this is a spot to trade the level rather than marry the narrative, because the volatility cushion is thin and the oil thread is unresolved.
Key levels
| Level | Type | What it means |
|---|---|---|
| 7,675 | Resistance | Upside settlement cluster on the forward expiry calendar. The stretch objective if the relief rally broadens. |
| 7,600 | Resistance | Round-number magnet and the first real test above today’s range. A clean break here confirms momentum. |
| 7,557 | Near resistance | Session high. The intraday ceiling that has to give way for continuation. |
| 7,544 | Spot | Today’s cash close. The reference point for the entire setup. |
| 7,525 | Pivot support | Options settlement pin. The magnet that price closed just above. Losing it invites a drift back into the pin. |
| 7,515 | Key support | Prior close and the reclaimed base. The line that separates a live breakout from a failed one. |
| 7,500 | Support | Round-number floor. A close beneath here negates the relief bid and shifts the read neutral. |
| 7,480 | Deeper support | Structural shelf below the round number. Where a fuller give-back would look to stabilise. |
Levels reference the cash index close for 14 July 2026.
Opportunity: As long as 7,515 holds on a closing basis, the dovish-yield tailwind keeps the continuation trade alive. A hold of that base with the volatility index staying soft points the index at 7,575 first and the 7,600 round number next, and a break there opens the 7,675 upside cluster. The cleanest expression is a pullback buy into the 7,520 to 7,525 pin, not a chase of the highs.
Risk: The oil premium is the crack in the story. Crude bid near 79.82 on a live Hormuz risk sits directly at odds with the cooling inflation that fuelled the rally, and it feeds straight into the next price print. Pair that with a volatility index at 16.5 and a front-end gauge under 14, meaning almost no downside protection is priced, and a firm oil session or a soft bank earnings tone tomorrow could snap the index back through 7,515 faster than the calm tape suggests.
Three scenarios into tomorrow’s bank earnings
Bullish continuation, 50%. The dovish read holds, yields stay offered, bank earnings land supportive, and the index clears 7,557 to press 7,575 and then 7,600. Leadership broadens beyond semiconductors, confirming the move.
Sideways consolidation, 30%. The relief pop digests just above the 7,525 pin. The index chops between 7,515 and 7,557 as the market waits on earnings tone and watches whether the oil premium eases or firms. No decisive break either way.
Correction, 20%. A persistent oil bid or a soft bank print reprices the dovish story. The index loses 7,515, drops back through the 7,500 round number, and works toward the 7,480 shelf as the thin volatility cushion unwinds.
Risk score
Overall risk on this setup rates 45%, moderate. The directional read is constructive and structurally clean above the base, which keeps the score out of the high-risk band, but three factors stop it being low.
- Thin volatility cushion. With the volatility index at 16.5 and the front-end gauge under 14, the market has priced almost no room for a surprise, so any shock lands harder.
- The oil counter-thread. Crude bid near 79.82 works against the cooling-inflation narrative and is the most likely source of an overnight repricing.
- Narrow leadership plus event risk. A semiconductor-led advance with the Dow flat, and bank earnings due tomorrow, leaves the tape dependent on a small set of engines.
How to walk it
This is a defined-risk continuation setup, sized moderate rather than aggressive given the thin cushion and tomorrow’s earnings event. Favour a pullback entry over chasing the close.
| Entry | Pullback into the 7,520 to 7,525 settlement pin, or a reclaim confirmation back above 7,557 |
| Stop | A close below 7,498, beneath the round-number floor where the relief bid is negated |
| First target | 7,600, the round-number test above today’s range |
| Second target | 7,675, the forward upside settlement cluster |
| Risk per unit | Roughly 0.4% from a 7,523 pin entry to the 7,498 stop, giving better than a 3-to-1 reward against the first target |
Trade the level, not the headline. Above 7,515 the read is patiently bullish and the pullback buy is favoured. On a decisive close below 7,500 the setup is void and the read steps aside to neutral, waiting for the oil thread and earnings tone to clarify before re-engaging.
One-line verdict
Cool CPI reclaimed the base and the S&P 500 (SPX) is patiently bullish above 7,515, but the thin volatility cushion and the un-cooled oil premium mean you buy the 7,525 pin with a defined stop, not the highs on faith.
Continue reading
- Macro Pulse: how the soft June inflation print reset the yield path
- Raw Materials Radar: the live Hormuz premium keeping crude bid near 80
- Index Focus: NAS100 (US Tech 100) leads as semiconductors carry the relief bid
- Earnings Echo: what tomorrow’s bank prints mean for the broad tape
Educational market analysis only. Not financial advice. Levels and prices reference the US cash close for 14 July 2026 and are subject to change.
Monday 13 Jul 2026
S&P 500 (SPX) Slips to 7,515 as an Oil Shock Wakes the Fear Gauge on CPI Eve
S&P 500 (SPX) | Daily Framework Read | Monday 13 July 2026 (US close)
The S&P 500 (SPX) closed at 7,515, down 0.79% on the day, after a Strait of Hormuz supply scare drove crude up roughly 9% to nearly $78 and finally jolted the fear gauge awake. The index opened at 7,547, tagged 7,565, then leaked to a 7,506 low before buyers reclaimed the round 7,500 line into the bell. This was a controlled fade, not a rout, but it was the first session in a while where the tape stopped ignoring risk. With consumer inflation, Fed Chair testimony and JPMorgan earnings all landing on Tuesday, the close leaves SPX pinned just above support with the burden of proof shifting to the bulls.
The thesis in one line: While SPX trades below the 7,540 pivot with oil bid and the volatility gauge expanding, the path of least resistance is a grind lower toward 7,450, and only a clean reclaim of 7,575 puts the bulls back in charge before Tuesday’s data.
Where it sits today
The S&P 500 (SPX) settled at 7,515, a loss of 60 points or 0.79%, versus Friday’s 7,575 close. The session traded a 59-point band: an open at 7,547, a high of 7,565 that never threatened Friday’s close, and a low of 7,506 that held the round 7,500 shelf on a closing basis. Volume ran heavy at roughly 2.7 billion shares across the tracking complex, the kind of participation that tells you the move had conviction behind it rather than thin-tape drift.
The internals were more defensive than the headline number. The NAS100 (NDX) shed 1.88%, more than double the broad index’s decline, as high-multiple technology took the brunt of the rotation. Gold slid 2.39% to near 4,006, an unusual pairing that suggests the day’s flows were about liquidity and positioning rather than a clean flight to safety. The single most important tell sat in the volatility complex: the fear gauge jumped about 14% to the low-to-mid teens after weeks of near-slumber. That is a regime the index has not had to price in for a while, and it arrived precisely on the eve of the week’s marquee catalysts.
What the framework reads
Structurally, SPX spent the session below its opening print and below the 7,540 area that had been acting as a closing magnet, and it never reclaimed Friday’s 7,575 settlement. That is a sequence of lower reference points inside the day, and it leaves the index sitting on support rather than leaning on resistance. The saving grace for bulls is the close back above 7,500: the round number did its job, the 7,506 low was defended, and the index did not surrender the level into the bell. So the read is a market that is heavy but not broken.
The composite lean is cautiously bearish. Three things stack on the bearish side of the ledger. First, the oil impulse is a genuine input cost shock that lands directly on inflation-sensitive breadth. Second, the volatility expansion is fresh and one-directional, and rising vol into an event window tends to keep index dealers defensive. Third, leadership is thinning, with the NAS100 (NDX) leading the tape lower rather than cushioning it. On the other side, the 7,500 hold, the orderly nature of the fade, and a heavy but not panicked close argue against chasing weakness blindly. The honest framing: this is a defensive lean with moderate conviction, not a high-conviction short, because Tuesday’s data can reset the entire picture in a single print.
Opportunity: A failed retest is the cleaner trade than a fresh breakdown. If SPX rallies back into 7,540 to 7,565 and stalls, that offers a defined-risk short against the 7,600 cap, with the day’s own structure marking the invalidation. Sellers get to lean on a level the market already rejected once today rather than guessing at a bottom.
Risk: This is single-catalyst tape. A soft inflation print alongside steady Fed testimony on Tuesday could gap SPX back through 7,575 and squeeze every defensive position at once. Do not marry the bearish lean, size it, and respect that oil headlines out of Hormuz can move in either direction overnight and drag the index with them.
Key levels
| Level | Type | Why it matters |
|---|---|---|
| 7,650 | Resistance | Next swing shelf; only in play on a strong data-driven reclaim |
| 7,600 | Resistance | Round-number cap and the logical stop reference for short setups |
| 7,575 | Pivot | Friday’s close; a clean reclaim flips the near-term bias bullish |
| 7,565 | Resistance | Session high; first supply and the top of today’s rejected zone |
| 7,540 | Bias pivot | Closing magnet the index failed to hold; the line that splits bull from bear |
| 7,515 | Current | Monday close, down 0.79%, resting just above support |
| 7,506 | Support | Session low; first line and the day’s defended floor |
| 7,500 | Support | Round-number floor held on the close; loss of it opens the next shelf |
| 7,450 | Support | First measured downside objective for the defensive lean |
| 7,400 | Support | Deeper demand shelf; the extension target if data disappoints |
Directional bias and conviction
Bias: cautiously bearish below 7,540, with moderate conviction. The tape is heavy, leadership is thinning and volatility is expanding, which is the right cocktail for a grind lower. But the index is sitting on support rather than breaking it, and one benign inflation print can flip the whole picture. Treat the lean as directional, not dogmatic: below 7,540 the sellers hold the edge; a sustained move back above 7,575 hands it to the buyers and puts 7,600 then 7,650 in view.
How to walk it
The higher-quality expression is to sell strength into the level the market already rejected, not to short a fresh breakdown into support.
| Setup | Defensive short on a failed retest |
| Entry zone | 7,540 to 7,565 on a stall |
| Stop | Above 7,605 (over the round-number cap) |
| Target 1 | 7,450 |
| Target 2 | 7,400 |
| Risk per trade | about 0.8% from a 7,550 entry to a 7,605 stop |
| Reward-to-risk | roughly 1.8 to 2.6 into the two targets |
Invalidation is clean and mechanical: a sustained reclaim of 7,575 voids the short thesis, and traders who want the other side can flip long above it, leaning on that pivot as support with 7,600 and 7,650 as objectives. Because Tuesday carries three event risks at once, keep size conservative and consider standing aside into the data rather than holding full exposure through the print. The 0.8% risk figure assumes a full position; a half-size expression through the event window is the more disciplined choice.
How tonight’s macro thread bears on SPX
The Strait of Hormuz supply scare is the engine of today’s move, and it hits the S&P 500 (SPX) through two channels. First, crude up roughly 9% to nearly $78 is an input-cost shock that lands one day before the consumer inflation report, exactly when the market least wants a fresh upside surprise to the price story. Second, the energy spike is what finally cracked the calm: the fear gauge snapped about 14% higher after weeks of complacency, and rising volatility into an event window keeps index positioning defensive by construction. That combination is why SPX faded rather than shrugged.
Tuesday concentrates the risk. Consumer inflation, Fed Chair testimony and JPMorgan earnings all land in a single session, and each pulls a different lever on the broad index. A hot inflation print with hawkish testimony would validate the oil-led vol expansion and pressure 7,500. A cooler print with steady testimony, and a clean bank result to open earnings season, could gap the index back over 7,575 and force the defensive crowd to cover. SPX is the aggregate of all three threads, so it is the instrument most exposed to the full spread of Tuesday outcomes rather than any single one. Tonight, that argues for respect over conviction.
Verdict: Heavy but not broken, the S&P 500 (SPX) at 7,515 leans lower toward 7,450 while below 7,540, and only a reclaim of 7,575 changes the story before Tuesday’s inflation and earnings gauntlet.
This is market commentary and educational analysis, not financial advice. Levels and scenarios reflect the market as at the Monday 13 July 2026 US close and can change with the next session.
Sunday 12 Jul 2026
S&P 500 — Daily Framework Read | Saturday 11 July 2026
S&P 500 | Post Close Setup Framework Read | Data basis: 2026-07-11 close
Where It Sits
Structure
Structurally S&P 500 sits above its short-term moving averages with the daily trend firmly higher. The recent advance has been orderly with no signs of distribution or topping behaviour. The reference anchor at 7,575.39 acts as the bias line.
Momentum
Momentum is neutral with internal readings near the centre of the range. That is the signature of a market digesting the prior move. The tape needs a fresh catalyst to commit to direction.
Volume & Flow
Flow on the session close was measured. Positioning data suggests steady accumulation rather than aggressive directional commitment. The pattern supports continuation rather than reversal.
Key Levels
| Level | Type | Significance | Action Zone |
|---|---|---|---|
| 7,685 | Resistance | Upper range target, prior supply zone | Take profits / fade if rejected |
| 7,610 | Pivot | Mid-range continuation marker | Hold = constructive; lose = consolidation |
| 7,575 | Session close | Reference anchor for next session | Above = continuation; below = mean revert |
| 7,520 | Support | Recent range floor, demand zone | Buy zone with defined stop |
| 7,445 | Major support | Prior breakout retest level | Stop-out below for longs |
Three Scenarios
Continuation
S&P 500 holds above the session close at 7,575.39 and extends higher on continued institutional flow. The vol regime supports trending moves and the path of least resistance remains up. Watch for a clean hold above the pivot level to confirm.
Range
S&P 500 opens flat and churns around the 7,575.39 level. Magnet to the prior close. The tape needs a fresh catalyst to commit. Range trade with defined stops.
Mean Reversion
S&P 500 opens firm but meets supply at the pivot, fades back below 7,575.39. Failed breakout pattern. Not the base case but worth size discipline if volatility expands.
Risk Score
Risk sits at Around 50%
Risk sits around 50 per cent. Vix at 15.0 supports a measured risk posture. sentiment at 50 is neutral. Index-level positions carry concentration risk in the leading names. Standard sizing with defined stops — discipline beats conviction.
How to Walk It
Entry / Stop / Target structure:
- Long 7,520 pullback | Stop 7,445 | Target 7,610 | R:R 2:1
- Long 7,610 breakout | Stop 7,575 | Target 7,685 | R:R 1.5:1
- Fade 7,685 rejection | Stop above resistance | Target 7,575 | R:R 2:1
Experience-level guidance:
Beginner: Reduce size to half your standard. Trade only the cleanest setup from the entries above. If the tape opens against your bias, do nothing — wait for the second hour, when the institutional flow has tipped its hand.
Intermediate: Use the levels table to define the trading range. Fade the extremes with defined stops, take profits before the round-number resistance levels.
Advanced: The vol regime supports defined-risk structures around the key pivot levels. Keep notional small relative to your book — asymmetric speculation, not core positioning.
Continue Reading
The macro frame driving this read is unpacked in the session briefs:
Check the latest session briefs on the site.
This analysis is for educational and informational purposes only. It does not constitute financial advice. Always manage your risk independently and in accordance with your own financial circumstances.
Friday 10 Jul 2026
S&P 500 — Daily Framework Read | Friday 10 July 2026
S&P 500 | Post Close Setup Framework Read | Data basis: 2026-07-10 close
Where It Sits
Structure
Structurally S&P 500 sits above its short-term moving averages with the daily trend firmly higher. The recent advance has been orderly with no signs of distribution or topping behaviour. The reference anchor at 7,575.39 acts as the bias line.
Momentum
Momentum is neutral with internal readings near the centre of the range. That is the signature of a market digesting the prior move. The tape needs a fresh catalyst to commit to direction.
Volume & Flow
Flow on the session close was measured. Positioning data suggests steady accumulation rather than aggressive directional commitment. The pattern supports continuation rather than reversal.
Key Levels
| Level | Type | Significance | Action Zone |
|---|---|---|---|
| 7,685 | Resistance | Upper range target, prior supply zone | Take profits / fade if rejected |
| 7,610 | Pivot | Mid-range continuation marker | Hold = constructive; lose = consolidation |
| 7,575 | Session close | Reference anchor for next session | Above = continuation; below = mean revert |
| 7,520 | Support | Recent range floor, demand zone | Buy zone with defined stop |
| 7,445 | Major support | Prior breakout retest level | Stop-out below for longs |
Three Scenarios
Continuation
S&P 500 holds above the session close at 7,575.39 and extends higher on continued institutional flow. The vol regime supports trending moves and the path of least resistance remains up. Watch for a clean hold above the pivot level to confirm.
Range
S&P 500 opens flat and churns around the 7,575.39 level. Magnet to the prior close. The tape needs a fresh catalyst to commit. Range trade with defined stops.
Mean Reversion
S&P 500 opens firm but meets supply at the pivot, fades back below 7,575.39. Failed breakout pattern. Not the base case but worth size discipline if volatility expands.
Risk Score
Risk sits at Around 50%
Risk sits around 50 per cent. Vix at 15.0 supports a measured risk posture. sentiment at 50 is neutral. Index-level positions carry concentration risk in the leading names. Standard sizing with defined stops — discipline beats conviction.
How to Walk It
Entry / Stop / Target structure:
- Long 7,520 pullback | Stop 7,445 | Target 7,610 | R:R 2:1
- Long 7,610 breakout | Stop 7,575 | Target 7,685 | R:R 1.5:1
- Fade 7,685 rejection | Stop above resistance | Target 7,575 | R:R 2:1
Experience-level guidance:
Beginner: Reduce size to half your standard. Trade only the cleanest setup from the entries above. If the tape opens against your bias, do nothing — wait for the second hour, when the institutional flow has tipped its hand.
Intermediate: Use the levels table to define the trading range. Fade the extremes with defined stops, take profits before the round-number resistance levels.
Advanced: The vol regime supports defined-risk structures around the key pivot levels. Keep notional small relative to your book — asymmetric speculation, not core positioning.
Continue Reading
The macro frame driving this read is unpacked in the session briefs:
Check the latest session briefs on the site.
This analysis is for educational and informational purposes only. It does not constitute financial advice. Always manage your risk independently and in accordance with your own financial circumstances.
Thursday 9 Jul 2026
S&P 500 — Daily Framework Read | Thursday 9 July 2026
S&P 500 | Post Close Setup Framework Read | Data basis: 2026-07-09 close
Where It Sits
Structure
Structurally S&P 500 sits above its short-term moving averages with the daily trend firmly higher. The recent advance has been orderly with no signs of distribution or topping behaviour. The reference anchor at 7,543.64 acts as the bias line.
Momentum
Momentum is positive but measured. The advance has been orderly without stretching the range. Internal readings are constructive without flagging exhaustion — supportive of continuation.
Volume & Flow
Flow on the session close was measured. Positioning data suggests steady accumulation rather than aggressive directional commitment. The pattern supports continuation rather than reversal.
Key Levels
| Level | Type | Significance | Action Zone |
|---|---|---|---|
| 7,640 | Resistance | Upper range target, prior supply zone | Take profits / fade if rejected |
| 7,575 | Pivot | Mid-range continuation marker | Hold = constructive; lose = consolidation |
| 7,544 | Session close | Reference anchor for next session | Above = continuation; below = mean revert |
| 7,490 | Support | Recent range floor, demand zone | Buy zone with defined stop |
| 7,425 | Major support | Prior breakout retest level | Stop-out below for longs |
Three Scenarios
Continuation
S&P 500 holds above the session close at 7,543.64 and extends higher on continued institutional flow. The vol regime supports trending moves and the path of least resistance remains up. Watch for a clean hold above the pivot level to confirm.
Range
S&P 500 opens flat and churns around the 7,543.64 level. Magnet to the prior close. The tape needs a fresh catalyst to commit. Range trade with defined stops.
Mean Reversion
S&P 500 opens firm but meets supply at the pivot, fades back below 7,543.64. Failed breakout pattern. Not the base case but worth size discipline if volatility expands.
Risk Score
Risk sits at Around 50%
Risk sits around 50 per cent. Vix at 15.8 supports a measured risk posture. sentiment at 47 is neutral. Index-level positions carry concentration risk in the leading names. Standard sizing with defined stops — discipline beats conviction.
How to Walk It
Entry / Stop / Target structure:
- Long 7,490 pullback | Stop 7,425 | Target 7,575 | R:R 2:1
- Long 7,575 breakout | Stop 7,544 | Target 7,640 | R:R 1.5:1
- Fade 7,640 rejection | Stop above resistance | Target 7,544 | R:R 2:1
Experience-level guidance:
Beginner: Reduce size to half your standard. Trade only the cleanest setup from the entries above. If the tape opens against your bias, do nothing — wait for the second hour, when the institutional flow has tipped its hand.
Intermediate: Use the levels table to define the trading range. Fade the extremes with defined stops, take profits before the round-number resistance levels.
Advanced: The vol regime supports defined-risk structures around the key pivot levels. Keep notional small relative to your book — asymmetric speculation, not core positioning.
Continue Reading
The macro frame driving this read is unpacked in the session briefs:
Check the latest session briefs on the site.
This analysis is for educational and informational purposes only. It does not constitute financial advice. Always manage your risk independently and in accordance with your own financial circumstances.
Wednesday 8 Jul 2026
S&P 500 (SPX) Slips to 7,504 as Crude’s 5.32% Surge Drives a Tech-to-Energy Rotation
S&P 500 (SPX) | Daily Framework Read | Tuesday 7 July 2026, US close
Where It Sits
Structure
The index gave back a modest 0.48% on a session where the real story was under the surface. Energy and value weighting did the defensive work while tech was sold hard, and that split composition is exactly why the broad index closed near flat while the Nasdaq 100 dropped 1.77%. Structurally, this looks like an index absorbing a sector shock rather than one breaking trend. The 7,504 close sits comfortably inside the recent range rather than at an extreme, which is consistent with rotation rather than distribution.
Momentum
Momentum diverged sharply by sector on Tuesday. Energy names carried strong upside momentum on crude’s 5.32% surge, while growth and tech carried the opposite, and the broad index landed in between. That divergence is the headline of the session: it was not a uniform down day, it was two opposing flows meeting in the middle. A calm VIX at 16.13 confirms there was no urgency behind either side of that trade.
Volume & Flow
Flow rotated rather than exited. Capital left growth positioning and moved into energy and cyclical names on the back of the crude spike, with gold easing back toward $4,110 as a further sign that this was a reallocation trade rather than a rush into traditional havens. The dollar’s steadiness near 162.15 on USD/JPY reinforces a neutral regime read: no capitulation, no scramble, just a reshuffle of where the money sits.
Key Levels
| Level | Type | Why It Matters | Action |
|---|---|---|---|
| 7,540 | Resistance | Pre-rotation ceiling; a reclaim here needs tech to stabilise, not just energy to keep running | Fade into strength unless the Nasdaq 100 confirms with its own reclaim |
| 7,504 | Pivot | Tuesday’s settlement price and the reference line for Wednesday’s open | Use as the intraday decision line; above favours stabilisation, below favours further rotation |
| 7,460 | Support | Where value and energy strength must keep absorbing any further tech weakness | Buyers should look for a clean reaction here before adding risk |
Bias
NEUTRAL. A calm VIX at 16.13 and an improving Fear and Greed reading of 43 both argue against treating Tuesday’s dip as the start of a risk-off leg. Until tech either stabilises or the selling broadens into energy and value, the base case is a sideways-to-choppy tape around 7,504 rather than a clean directional break in either direction.
Multi-Strategy Breakdown
- Scalp: Trade the 7,460 to 7,540 range on shorter timeframes, treating the 7,504 pivot as the fulcrum between the two.
- Intraday: Watch whether energy strength keeps offsetting tech weakness through Wednesday’s session; a widening gap between the two argues for staying flat rather than picking a side.
- Swing: Hold existing broad-market exposure through the rotation; this reads as a sector reshuffle rather than a reason to reduce core positioning.
Risk Score
Risk sits at Around 30% heading into Wednesday’s session.
Risk is moderate-low. A calm VIX at 16.13 alongside an improving sentiment reading confirms this is a rebalance, not a risk unwind, which keeps tail risk contained even with the tech-led drag on the index. The main watch item is whether the Nasdaq 100’s weakness broadens beyond growth names into the sectors currently cushioning the broad index.
Three Scenarios Into Wednesday
Rotation Continues
Energy and value keep absorbing further tech softness, and the index oscillates between 7,460 and 7,540 without a decisive break either way.
Tech Stabilises
The Nasdaq 100 finds a floor, buyers return to growth names, and the broad index grinds back toward the 7,540 resistance zone.
Rotation Broadens Lower
Tech weakness spreads beyond growth, energy strength fades as crude gives back part of its 5.32% gain, and the index breaks below 7,460.
Position Sizing
MAX
Not warranted. Tech remains under real pressure and the cushion holding the index up is sector-specific, not broad-based strength.
STANDARD, applies
A calm volatility backdrop and an orderly sector rotation support normal sizing on both existing positions and fresh entries at the levels above.
REDUCED
Would apply only if the Nasdaq 100 weakness starts spreading into the energy and value names currently doing the cushioning.
AVOID
Not the current read. There is no sign of the disorderly, fear-driven unwind that would justify stepping fully aside.
This is analysis, not financial advice. Always manage your risk.
Friday 3 Jul 2026
S&P 500 (SPY) – Daily Read
July 2, 2026 | Index | Titan Macro Desk
737.76
The analysis reads accumulation. Smart money appears to be quietly building positions. This typically precedes a markup phase. Ethical screening: FAIL. This security does not pass our values-based screening criteria. The risk-adjusted return profile shows excellent risk-adjusted returns.

Framework Metrics
This read is generated by the Titan framework and reflects our multi-factor analytical model. It is not financial advice. Past performance is not indicative of future results. Always conduct your own research before making investment decisions.
Thursday 2 Jul 2026
S&P 500 (SPY) – Daily Read
July 2, 2026 | Index | Titan Macro Desk
737.76
The analysis reads accumulation. Smart money appears to be quietly building positions. This typically precedes a markup phase. Ethical screening: FAIL. This security does not pass our values-based screening criteria. The risk-adjusted return profile shows excellent risk-adjusted returns.
Framework Metrics
This read is generated by the Titan framework and reflects our multi-factor analytical model. It is not financial advice. Past performance is not indicative of future results. Always conduct your own research before making investment decisions.


