VIX Crushed to 15.8 as the NAS100 Ripped 1.6%, But Crash Cover Stays Bid
Volatility Lens | Thursday 9 July 2026 | Post-Close read
Data locked at the New York close: 16:00 EDT / 21:00 BST / 06:00 AEST (Fri)
The volatility complex came apart at the seams today, and it did so in the direction that flatters the bulls. The headline gauge fell better than six per cent to close under 16, the nine-day measure sank to the low twelves, and the vol-of-vol index drifted back below 90. On the surface that is a green light. Look one layer down and the story fractures: put open interest still towers over calls, downside strikes still carry the richer premium, and the biggest names roll into a bank-earnings gauntlet with the tape priced for nothing to go wrong. Calm on top. Hedges still on underneath. That gap is the whole trade.
The core read: This is a compressed-volatility, risk-on close sitting on top of a defensive options book. The front end of the curve is pricing serenity while the protection bid quietly refuses to lift. When implied volatility gets this cheap into a known catalyst, the asymmetry flips: selling premium stops paying, and owning convexity gets cheap enough to be worth the carry. We are treating sub-16 not as safety but as an invitation to buy the insurance nobody wants.
The Tape That Set the Tone
Every major closed green, and the ones that closed greenest were the ones with the most beta. That ordering matters. When the growth-heavy benchmark leads the blue chips by more than a full percentage point, the market is not buying safety; it is reaching for risk. The volatility bid gets sold into that reach every single time.
Here is where the board settled at the bell.
| Instrument | Close | Change | Volatility signal |
|---|---|---|---|
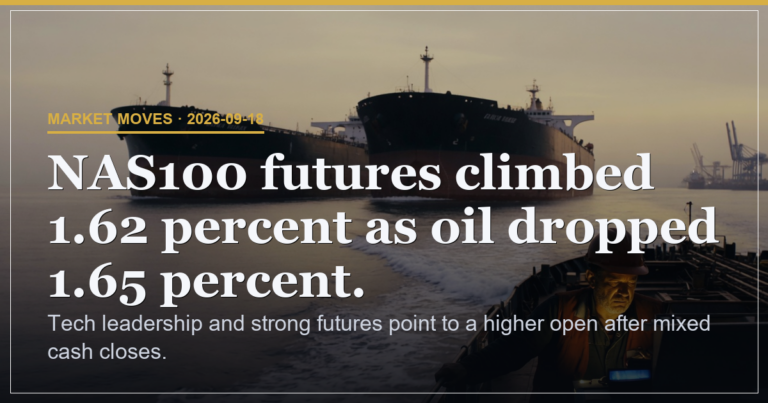
| Nasdaq 100 (NAS100) | 29,727.10 | +1.62% | Leadership = risk appetite |
| S&P 500 (SPX) | 7,543.64 | +0.81% | Realised outran implied |
| Russell 2000 (RUT) | 2,992.54 | +1.22% | Small-caps joined the reach |
| Dow Jones (DJIA) | 52,487.41 | +0.27% | The laggard: value took a back seat |
| Volatility Index (VIX) | 15.84 | -6.27% | Broke a level that matters |
| Gold (XAU) | 4,132.60 | +1.52% | Odd bedfellow to a vol crush |
| Crude Oil (WTI) | 71.81 | -2.33% | Geopolitical premium bled out |
| US Dollar Index (DXY) | 100.94 | -0.11% | Soft dollar greased the melt-up |
Notice the two odd men out. Gold rose 1.5 per cent on the same session that volatility collapsed, and crude gave back 2.3 per cent even with the Middle East still simmering. A vol crush that comes alongside a bid for the classic hedge asset is not a clean all-clear. It is a market that wants to be long and insured at once, which is exactly the behaviour that keeps put premium sticky while the headline gauge falls. Hold that thought; it is the spine of tonight’s read.
The Volatility Read: A Curve Priced for Serenity
The headline gauge fell from a prior close near 16.9 to 15.84, a drop of 1.06 points and one of the sharper single-day slides of the last fortnight. It came off an intraday high of 17.27, so the fade was not a gap; it was a grind lower all session as every dip got bought and every hedge got a little less necessary in real time. The five-day average sits at 16.65, so today closed a clean three-quarters of a point under its own recent mean. Momentum in the vol complex is pointed down.
The term structure is where it gets interesting. The nine-day gauge printed 12.5 against a spot reading of 15.84. That is a steeply upward-sloping front end: near-dated implied volatility is a full 3.3 points cheaper than the 30-day. Translated, the market expects the next week and a half to be quieter than the month as a whole. That is textbook contango, and contango this steep is the signature of a market that has stopped fearing the immediate.
| Curve point | Reading | What it means |
|---|---|---|
| 9-day implied | 12.5 | The next week priced near-flat |
| 30-day implied (spot) | 15.84 | Below its own 5-day mean of 16.65 |
| Front-end spread | +3.34 pts | Steep contango = complacency |
| Vol-of-vol (VVIX) | 88.8 | Below 90: little demand to hedge the hedge |
The vol-of-vol index adds the confirming note. At 88.8 it has slipped back under the line that separates a calm options market from a nervous one. When it sits here, the options that hedge volatility itself are cheap, which tells you nobody is scrambling to protect their protection. Every gauge on the surface agrees: the market is relaxed, and it is paying up for that relaxation by selling premium.
And that is precisely the setup that has burned complacent sellers for as long as options have traded. Cheap volatility is not the same as low risk. It is the price at which the market has decided risk is low, and that price can be wrong in an afternoon.
With the nine-day gauge at 12.5 and the curve in steep contango, near-dated downside protection is priced at a level that rarely lasts through an earnings kickoff. The bank reporting cycle opens the window where index implied volatility historically firms. Owning defined-risk convexity here, rather than chasing the melt-up naked, is the asymmetric side of the book: small, known cost against an outsized payout if the calm breaks. We are accumulating protection while it is on sale, not because a drop is imminent, but because the insurance has almost never been cheaper relative to what is coming.
Realised Versus Implied: The Melt-Up Is Outrunning the Price
A 30-day implied reading of 15.84 translates to an expected daily move of roughly one per cent in the broad index. Today the growth benchmark travelled 1.62 per cent and the S&P 0.81 per cent. On the tech side, realised movement is running hotter than the implied price of it, and it is doing so to the upside. That is the tell of a squeeze-driven tape rather than a smoothly grinding one.
Here is the trap in that observation. When realised volatility comes entirely from green candles, the headline gauge falls even as the market actually moves more, because the index math discounts upside churn. So the gauge understates true movement, premium sellers feel vindicated, and the variance risk premium compresses toward zero. A compressed variance premium is a coiled spring: it pays almost nothing to be short volatility, and it costs almost nothing to be long it. The risk-reward has quietly inverted while the tape looked its calmest.
| Measure | Implied daily move | Actual move today | Read |
|---|---|---|---|
| S&P 500 | ~1.0% | +0.81% | In line, calm holds |
| Nasdaq 100 | ~1.1% | +1.62% | Realised outran implied |
| Russell 2000 | ~1.3% | +1.22% | Balanced, no stress |
The honest admission: I cannot tell you whether this spring uncoils tomorrow or grinds sideways for a fortnight. Nobody can time the break. What I can tell you is that the cost of being wrong on each side is no longer symmetric, and when the payoff skews that hard, you position for the skew and stop trying to call the day.
Per-Symbol Tactical Board
Volatility is a market-wide weather system, but it lands differently on each instrument. Below is how we are reading the names that matter most to the vol book tonight, with the pinning levels and the protection cost baked in.
| Instrument | Close | Pin / magnet | Protection read | Our stance |
|---|---|---|---|---|
| S&P 500 ETF (SPY) | 751.71 | 745 | Put OI leads calls ~1.25x | Own downside convexity |
| Nasdaq 100 ETF (QQQ) | 723.28 | 711 | Put OI leads calls ~1.40x | Richest hedge demand |
| Russell 2000 ETF (IWM) | 297.24 | ~295 | Book near balance, calls creeping in | Cleanest bullish expression |
| Gold (XAU) | 4,132.60 | n/a | Bid alongside the vol crush | Confirms latent caution |
| Crude Oil (WTI) | 71.81 | n/a | Own vol elevated, spot sliding | Wildcard risk vector |
| Volatility Index (VIX) | 15.84 | 14–18 band | Near lower rail of the range | Buy the gauge low |
Two lines in that table carry the message. The growth ETF holds put open interest at roughly 1.4 times its calls even as its underlying ripped 1.6 per cent; that is a book braced for a fall while price runs the other way. And the broad-market ETF sits above its pinning magnet at 745, which means the options gravity actually favours a modest drift lower into expiry. The tape wants up. The structure quietly leans the other way.
The seductive move here is to sell the elevated-looking premium and collect the decay. Resist it. With the nine-day gauge at 12.5 there is barely any premium left to harvest, and the bank reporting cycle opens the exact window where index volatility has a habit of firming without warning. A short-volatility position sized for calm can hand back a fortnight of carry in a single session if the tape gaps. The variance premium is too thin to justify the tail. We are not sellers of naked volatility at these levels, full stop.
The Fear Bid That Refuses to Leave
This is the contradiction at the heart of tonight. The read says calm: gauge down six per cent, curve in contango, vol-of-vol asleep. But the options book says something else entirely. Across the major index products, downside strikes still carry the richer implied volatility, and put open interest still overhangs calls. If the market truly believed in the melt-up, that skew would flatten and those puts would get sold. They have not.
| Product | Put/call OI | Skew read |
|---|---|---|
| S&P 500 ETF (SPY) | 1.25 | Downside puts richer than calls |
| Nasdaq 100 ETF (QQQ) | 1.40 | Heaviest protective overhang |
| Russell 2000 ETF (IWM) | 0.90 | Nearest to neutral, calls building |
Read the gold bid in that light and it stops being a curiosity. A market that pushes the classic safe-haven metal 1.5 per cent higher on a vol-crush day is a market holding its umbrella open in the sunshine. The equity crowd is happy to chase price. The same crowd is not willing to strip off its hedges to do it. That divergence is not resolved yet, and until it is, the calm reading on the surface is only half the truth.
The sentiment gauges echo it. The broad fear-and-greed composite ticked up to 47 from 43, still parked squarely in neutral. Neutral is the honest label for this tape: not fearful enough to be a contrarian buy, not greedy enough to fade, but leaning to reach for risk while keeping the exits mapped. That is the psychology of a book that expects higher and is braced for lower at the same time.
How We Are Positioning: Multi-Strategy Tiers
One tape, several time horizons, several risk appetites. Here is how the volatility read expresses across the tiers we run.
| Tier | Expression | Rationale | Conviction |
|---|---|---|---|
| Core / defensive | Own near-dated index convexity | Protection is on sale at 12.5 | High |
| Directional / tactical | Bullish exposure via defined-risk call structures | Cheap implied lowers the cost of upside | Moderate |
| Relative value | Own the wings, avoid the body | Skew rich, at-the-money cheap | Moderate |
| Premium harvest | Stand aside | Variance premium too thin to pay the tail | Avoid |
The through-line is simple. When volatility is this cheap, you are a buyer of optionality and not a seller of it. You express your directional lean with structures that own convexity rather than sell it, and you let the thin variance premium be somebody else’s problem. This is the same posture the derivatives desk has been building toward all week, and tonight’s close only sharpens the case.
The Risk Read, in Percentage Terms
We frame portfolio risk as a percentage of capital at hazard, not as a score. Tonight the volatility complex earns a composite risk read of 38 per cent – meaningfully elevated for a session that closed green across the board. That number is a blend, and here is exactly what feeds it.
| Risk factor | Weight | Why it counts |
|---|---|---|
| Compressed variance premium | +13% | Thin cushion, coiled spring |
| Live earnings catalyst window | +10% | Bank cycle opens the vol trapdoor |
| Persistent protective put overhang | +8% | Smart money still hedged |
| Geopolitical / crude wildcard | +5% | Own vol high while spot slid |
| Offsetting: neutral sentiment, orderly tape | -8% | No panic, contango intact |
| Composite risk read | 38% | Elevated beneath a calm surface |
Thirty-eight per cent is not a call for a crash. It is a statement that the reward for taking naked risk here does not match the exposure. When the surface reads calmest, the composite risk read is doing its most important work, and tonight it is flashing amber under a green tape.
Scenario Map into Friday and Beyond
Four paths, and their probabilities sum to exactly one hundred. This is how we are preparing, not what you should expect.
| Scenario | Probability | Volatility path | How we are prepared |
|---|---|---|---|
| Bull continuation | 40% | Gauge grinds toward 14, curve stays steep | Cheap call structures capture upside; convexity carry is small |
| Sideways drift | 34% | Gauge chops 15–17, pins near 745 on SPY | Own the wings, let the body decay against sellers |
| Correction | 20% | Gauge snaps back above 20 on an earnings miss | Downside convexity pays multiples of its cost |
| Black swan | 6% | Gauge spikes past 30 on an exogenous shock | Tail hedges are the reason we hold them cheap |
Weight those together and the message is not “sell everything.” It is that a full quarter of the distribution now sits in the correction-or-worse bucket, and the market is charging you almost nothing to insure against it. When the fat left tail is on discount, you buy it and move on. That is the entire edge in a cheap-volatility regime.
Position Sizing Framework
Sizing is where the read becomes discipline. Here is the allocation logic we are running against tonight’s volatility picture.
| Sizing band | Applies to | Reasoning |
|---|---|---|
| MAX | Cheap long convexity / tail hedges | Best risk-reward on the board; insurance rarely this cheap |
| STANDARD | Defined-risk bullish structures | Ride the trend, but with a floor under it |
| REDUCED | Naked directional beta, crude-linked exposure | Realised churn and the crude wildcard argue for less |
| AVOID | Short volatility, premium selling | Thin premium, fat tail, wrong side of the skew |
The band that matters most is the last one. In a normal regime, premium harvesting is a legitimate income engine. Tonight it is a coin that pays pennies and costs pounds. We are sitting it out, and we are comfortable telling you exactly why.
Reading This by Experience Level
A low volatility reading is not a promise of calm; it is the market’s current price for calm, and prices change. The single takeaway: when protection is cheap, that is the time to hold some, not the time to abandon it. Keep position sizes modest and let the tape prove itself before you press.
Watch the divergence, not the headline. Price ripping while put open interest stays heavy is the signal to keep. Express bullish views with defined-risk structures so a cheap implied reading works for you rather than against you, and treat the pinning magnets below spot as gravity, not gospel.
The trade is the compressed variance premium against a steep front-end contango into a live catalyst. Own the wings, fade the body, and keep vega long and cheap. The vol-of-vol sub-90 means the second-order hedges are on discount too; that is where the truly asymmetric convexity sits tonight.
Three-Timeframe Verdict
| Horizon | Volatility bias | Posture |
|---|---|---|
| Short (into Friday) | Suppressed | Contango holds; accumulate cheap protection |
| Medium (1–2 weeks) | Coiling higher | Earnings cycle is the vol catalyst; own convexity |
| Long (regime) | Neutral, fragile | Calm surface, defensive book: respect the tension |
Short-term calm, medium-term coil, long-term fragility. The gauge fell today, but the reasons to own volatility rather than sell it grew stronger, not weaker. That is the paradox this desk is built to read, and tonight it could not be clearer.
Continue Reading Across the Desks
Tonight’s volatility read does not stand alone. As you will find in our Macro Pulse brief, the soft dollar closing at 100.94 and the geopolitical premium bleeding out of crude are the twin engines behind the risk-on melt-up that crushed the gauge; the rates path is doing half the work here. For the flow behind the numbers, the Derivatives & Options Flow desk walks through the pinning magnets and the protective put campaigns that keep the skew bid even as price rips; it is the granular version of the divergence we flagged tonight.
You will also want the Metals & Commodities desk on why gold pushed to 4,133 on a vol-crush day, because that safe-haven bid is the tell we leaned on all the way through this read. And our Institutional Positioning desk frames who is doing the hedging: the same crowd chasing the tape higher is the crowd keeping the umbrella open. Read them together and the calm-on-top, braced-underneath picture snaps fully into focus.
Analysis, not financial advice. Always manage your own risk. Everything above is our reading of publicly observable market conditions at the New York close on 9 July 2026; it is not a signal service, not a recommendation, and not a solicitation to trade. Volatility can expand faster than any hedge can be placed. Position sizes, entries and exits are yours alone to decide. Past readings are the standard we hold ourselves to, never a guarantee of what comes next.