Guide. The structural framework.
Open your chart and know immediately whether the trend is healthy, compressing, or breaking down. Guide gives you that answer at a glance, before you look at anything else.
"Moving averages show you lines. Guide shows you the relationship between the layers of market structure. Whether they agree, whether they are compressing, whether the trend is healthy or decaying. It is the difference between seeing ingredients and seeing the whole meal."
Includes TitanCore, Trend Guard, and Regime Guard.
Trading the Wrong Direction
What happens when you trade without structural context.
Most traders who lose money on a trend trade were not unlucky. They were trading a trend that had already deteriorated. Price was still moving, so it looked fine. But the structural layers underneath had already started collapsing. By the time price confirmed the breakdown, the damage was done.
The other version of this problem is missing compression. A market coils for hours. The range tightens. Something big is loading. Traders without a structural read sit out or take small range trades. Then the break happens and they are watching from the sidelines.
What Guide Gives You
Five things Guide shows you that plain moving averages do not.
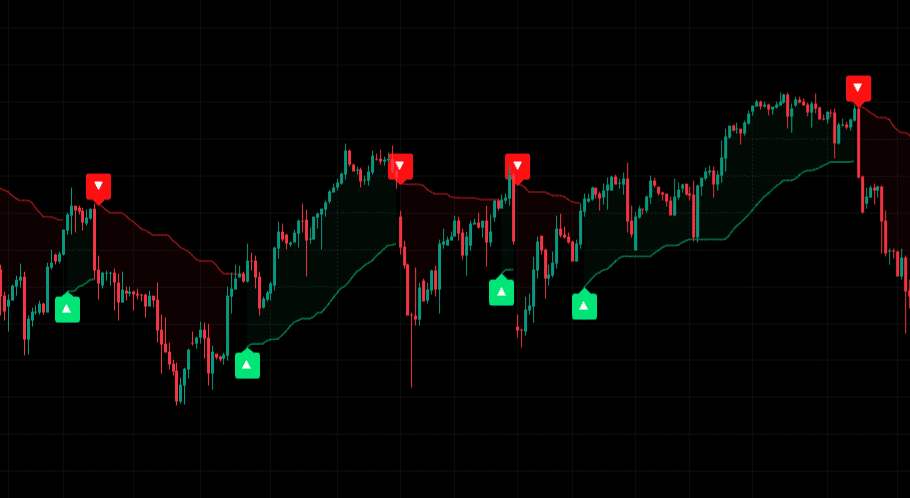
The cloud tells you instantly whether the structural layers are stacked correctly for a healthy trend, tangled and uncertain, or inverting. You do not need to check six moving averages. You look at the cloud and you know.
When the structural layers converge tightly, that is the market coiling. Guide shows you this before the break. Traders who spot compression early are positioned when the move comes. Those who miss it are chasing it.
Guide marks the levels where the market made real decisions. Not arbitrary price points. Where buyers stepped in with conviction, where sellers held the line. These are your natural entry and stop reference points, drawn automatically.
When a healthy trend starts deteriorating, the structural layers show it in the cloud before price gives the definitive signal. That early warning is the difference between a timely exit and taking a full reversal to the face.
From a 1-minute scalp chart to a weekly swing view. The structural cloud adapts to whatever timeframe you are on. Indices, forex, crypto, stocks, commodities. The logic is the same everywhere.
Who It Is For
Three traders who need a structural anchor.
If you are still learning to read trends, Guide makes it visual. A green, well-stacked cloud means the trend is intact. A compressing cloud means wait and watch. A cloud that is inverting means step back. You learn by seeing it happen in real time, not by memorising rules.
Intermediate traders use the multi-timeframe heatmap to confirm that the structural trend on their entry timeframe is supported by the bigger picture. When the heatmap aligns across timeframes, the trade has more behind it. When it disagrees, you know the entry needs more patience.
Advanced traders use the compression signal as a positioning trigger. When the structural layers converge, something big is loading. A tight stop at the compression zone and a clear break as the entry condition gives you a genuinely asymmetric setup. Guide shows you where those opportunities are before they resolve.
What the Trader Sees
How Guide reads during a live session.
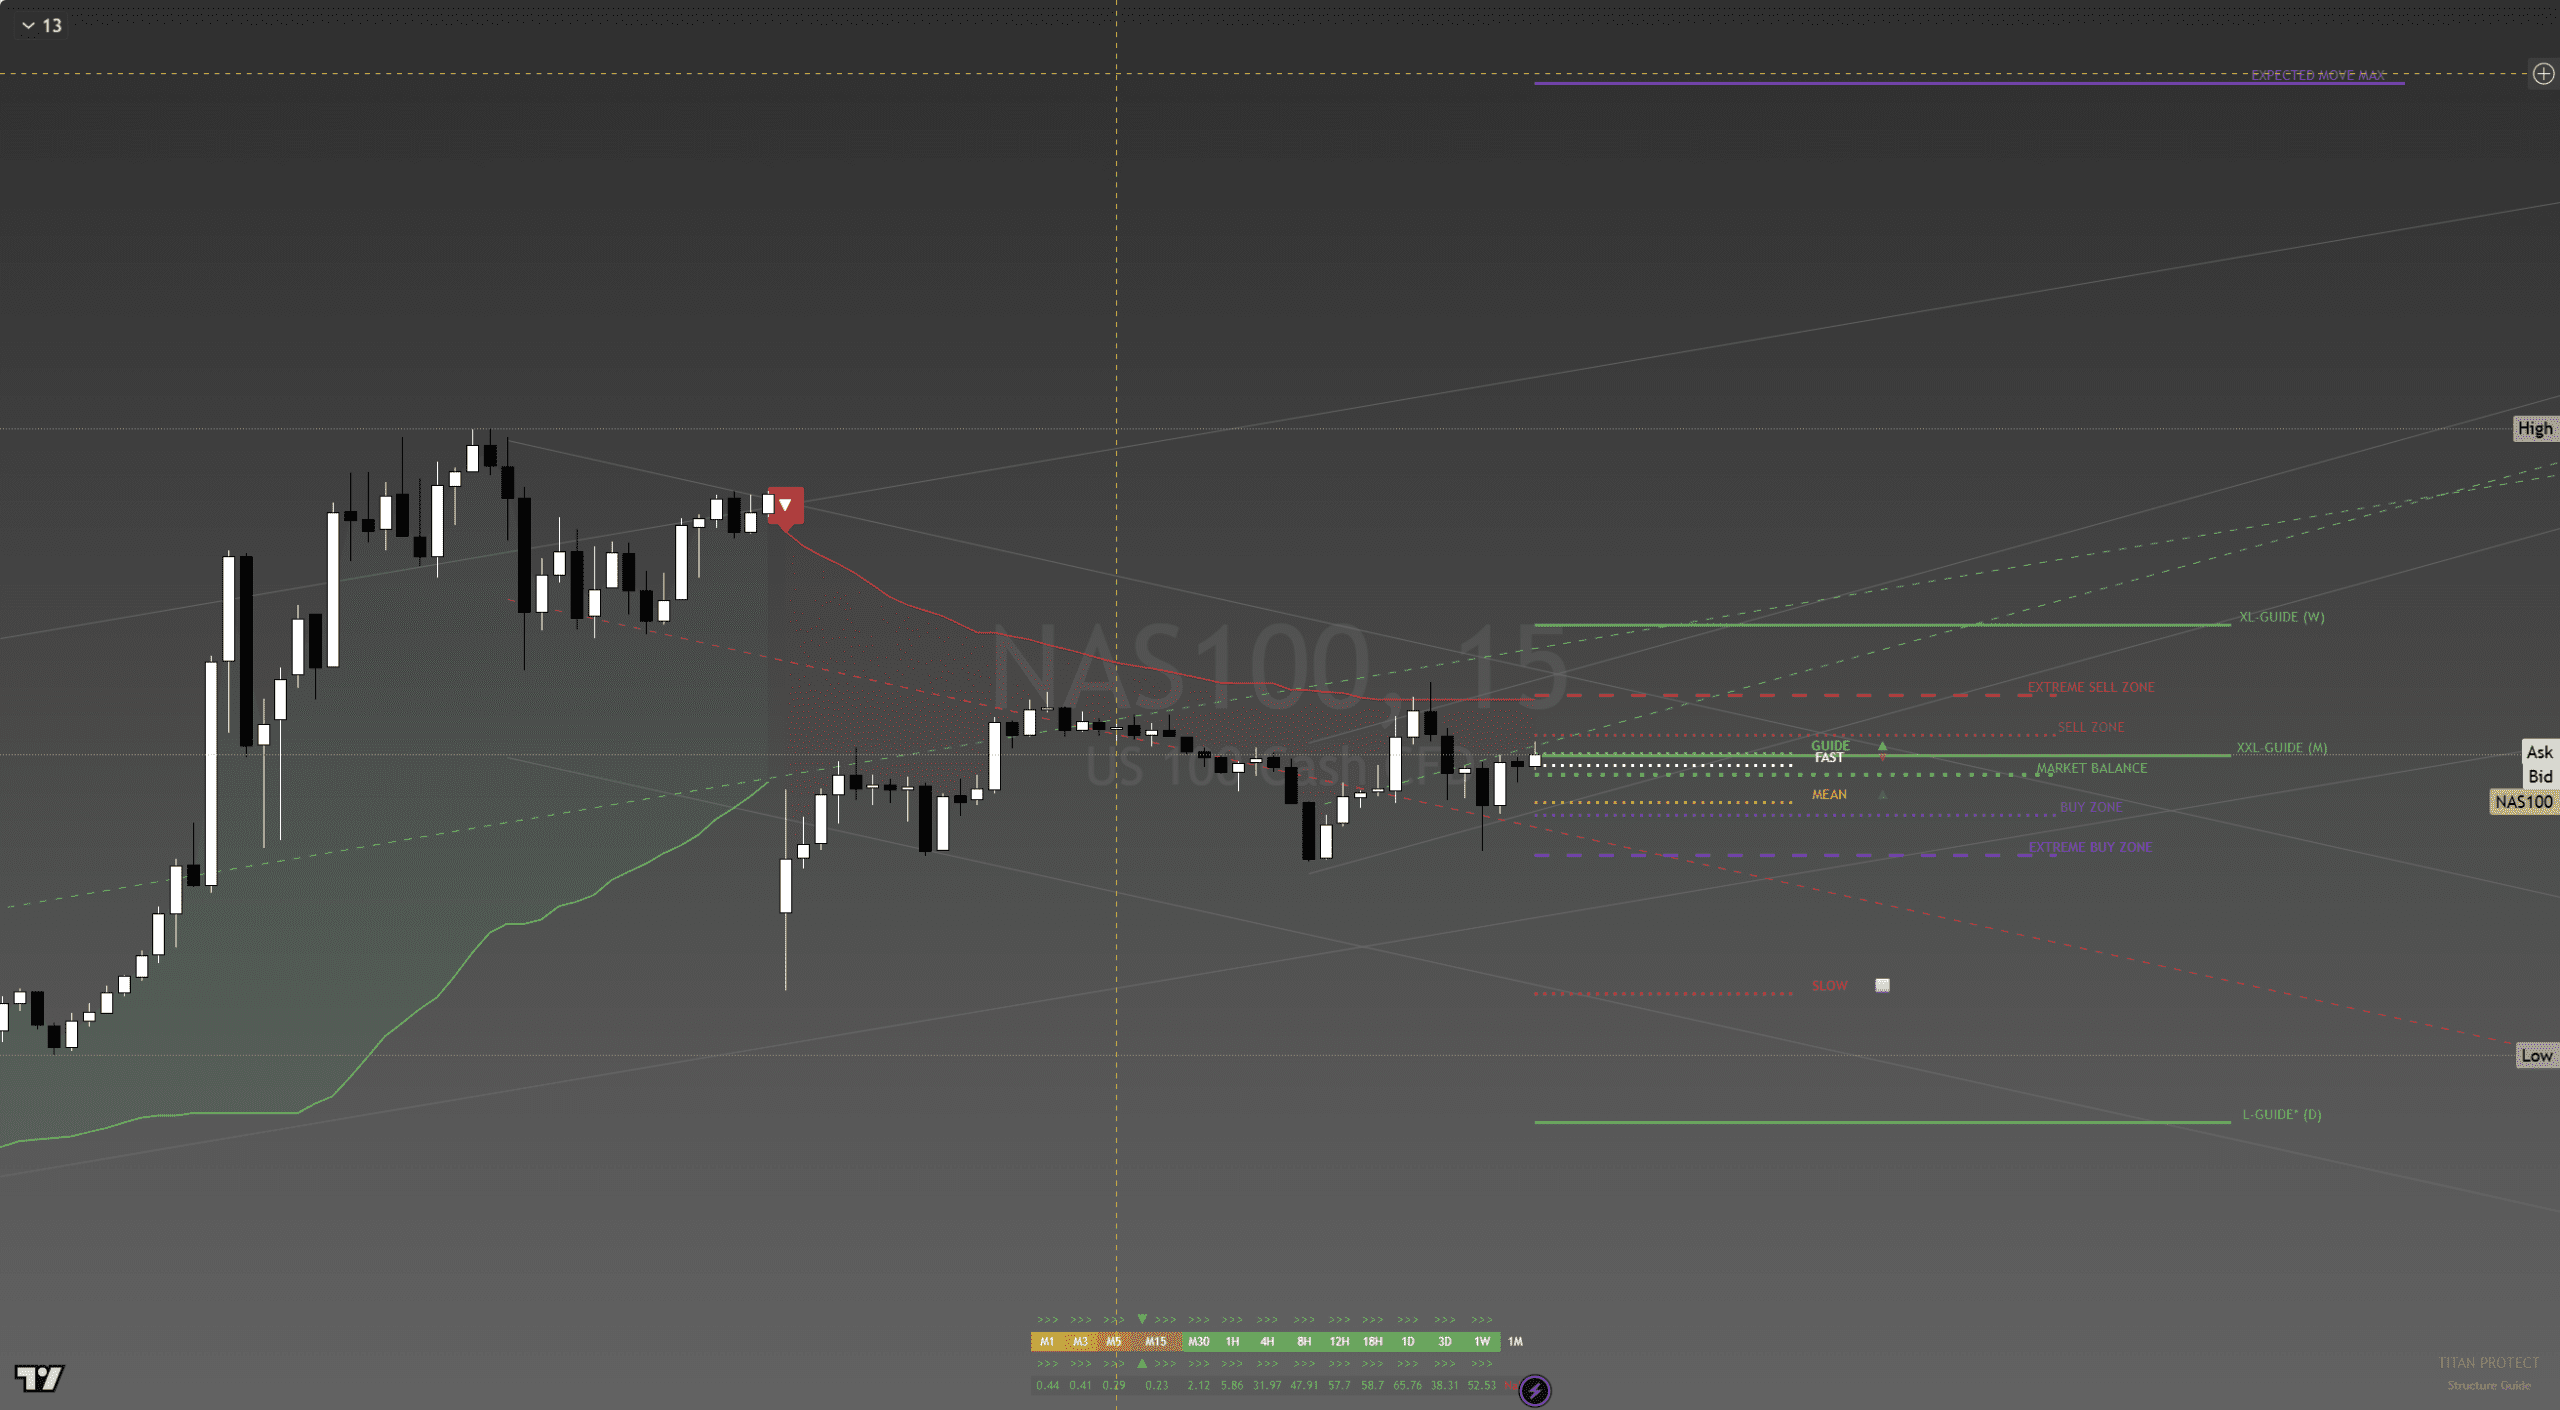
It is early in the London session. You open NAS100 on the 15-minute chart. The cloud is green and well-stacked. The structural layers have been in clean order since the Asia close. The swing level from yesterday afternoon is sitting 80 points below current price as a support reference.
An hour in, the cloud starts to tighten. The layers are converging. You are not sure whether this is consolidation or compression before a bigger move. You watch. Over the next 30 minutes, the cloud compresses further, the range narrows, and then price breaks upward cleanly through the nearest swing level.
You had the entry context because you saw the compression building. The swing level gave you the break point. The stacked cloud told you the broader structure was still intact. That is the whole read, delivered in one tool.
Guide + TitanCore
TitanCore provides the visual foundation and the structural levels that Guide then reads against. TitanCore marks where the market made decisions. Guide shows whether the structural trend is still respecting them or deteriorating away from them. Used together, you have both the reference points and the structural picture in one clean workspace.
Learn about TitanCore →NAS100, 17-20 April
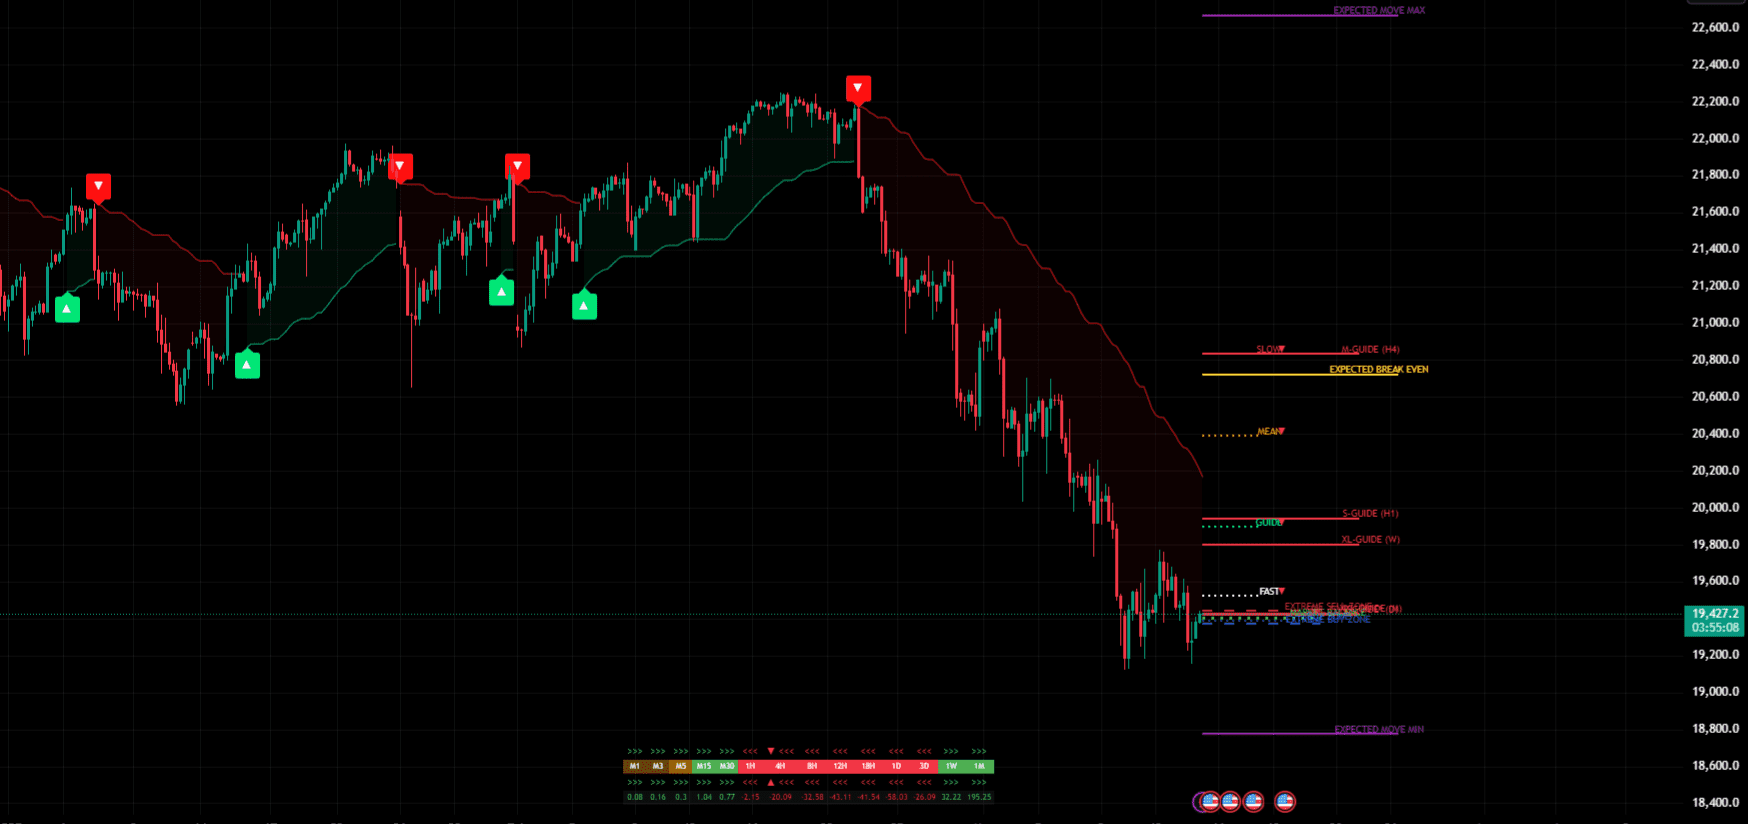
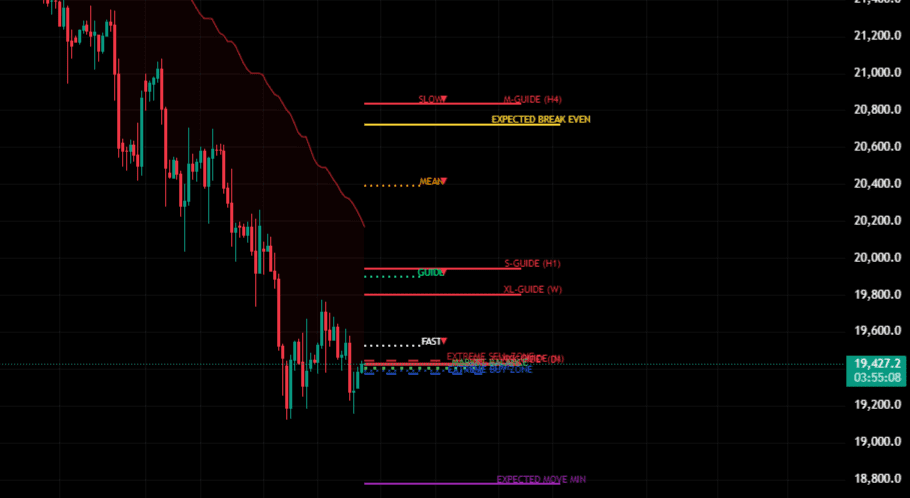
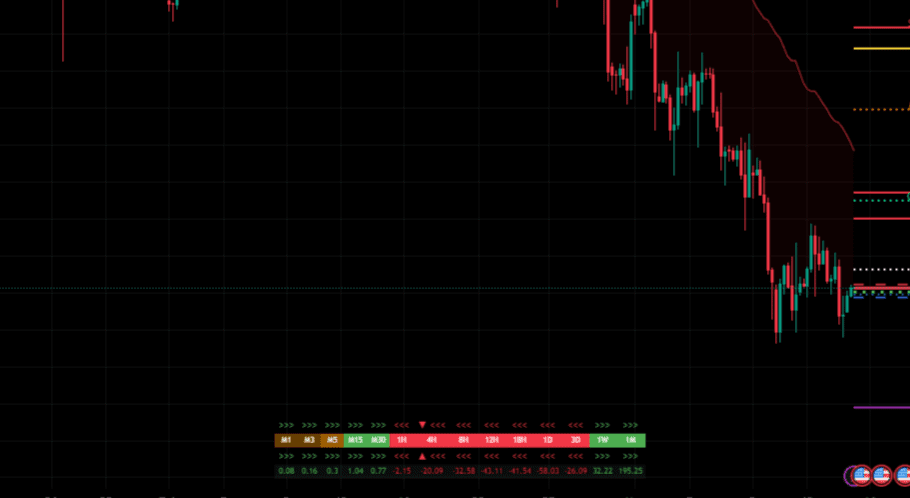
On Friday 17 April, Guide's fast structural average at 26,543 was sitting above the 26,509 structural floor. When NAS100 gapped lower on the Sunday open, that 26,543 level became immediate resistance. The swing level at 26,399 provided the deeper support reference. Traders working off those two levels had entries and stops defined before the London open without having to make a decision under pressure.
The levels were visible before the move. This is not hindsight.
Pricing
Annual plan available. Saves two months.
- ✓ Everything in Core (TitanCore + Foundry)
- ✓ Guide
- ✓ Trend Guard
- ✓ Regime Guard
The Rest of the Edge Tier
Multi-timeframe direction agreement. Know when all timeframes point the same way. Included in Edge at £109/month.
Learn about Trend Guard →Know which type of market you are in before you choose a strategy. Trending, ranging, expanding, or contracting. Included in Edge at £109/month.
Learn about Regime Guard →Frequently Asked Questions
How is this different from just using moving averages?
Moving averages show you lines. Guide shows you the relationship between the layers of market structure. Whether they agree, whether they are compressing, whether the trend is healthy or decaying. A single moving average tells you a price is above or below a level. Guide tells you whether the structure has the architecture of a working trend or one that is falling apart. That is a meaningfully different piece of information.
What timeframes does it work on?
All of them. From 1-minute charts to weekly charts. The cloud adapts to whatever timeframe you are viewing. The structural logic is the same regardless of how compressed or extended the time horizon is.
Does it repaint?
No. Once a bar closes, the reading is final. What you see on a closed bar is what happened. There is no revision after the fact.
Does it work on crypto and forex?
Yes. Guide works on any market you trade. The structural cloud reads trend health the same way on NAS100, EURUSD, Bitcoin, or Gold. The instrument does not change the logic.
Do I need TitanCore first?
Yes. TitanCore is included in the Edge tier and sets the visual foundation that Guide builds on. When you join at Edge, you get both. You do not need to set anything up separately.
Can I use Guide alongside other tools I already have?
Yes. Guide gives you structural context that complements whatever else you use. The cloud and swing levels sit cleanly on your chart without crowding your existing setup. Most traders find it replaces a handful of redundant indicators because it answers the questions those indicators were trying to answer, but more directly.
See the trend clearly. Trade it confidently.
Guide is part of the Edge tier at £109/month. Includes TitanCore, Trend Guard, and Regime Guard. Annual plans save two months.
View Membership OptionsEducational analysis only. Not financial advice. Always manage your risk.