STOXX 600 (SXXP) – Daily Read
10 September 2026 | Index | Titan Macro Desk
640.4
The STOXX 600 (SXXP) is testing whether a controlled pullback is turning into a broader European equity correction. Last price 640.4, 1.4 percent lower on the day, leaves the index down near the floor of its one-month range. The immediate view is cautious because sellers have control below the recent balance area, but the longer trend still points up. That makes this a test of demand within an established advance, not yet a confirmed trend reversal. The distinction matters because nearby support can still produce a meaningful rebound, while failure there would materially widen the downside.
The macro pressure is coming from the combination of rising energy costs, renewed Middle East tension, firmer bond yields, and concern that persistent inflation pressure could keep European monetary policy tighter. Attention around the ECB decision adds event risk, while upcoming US inflation information can influence global yields and equity valuation appetite. This backdrop is especially important for SXXP because it is the broad index of 600 European companies, spanning countries, sectors, and company sizes rather than representing only the Eurozone’s largest names. Energy producers may absorb part of the oil shock, but manufacturers, consumers, transport businesses, and other energy users face margin pressure. That breadth makes the decline a useful reading of region-wide risk appetite, not simply weakness in the Euro Stoxx 50.
The one month average is 651.4; price is below it, and the structure reads as a pullback, slipping under the one-month average while the longer trend still points up. Momentum is roughly 1.8 percent down over the last two weeks, confirming that the current weakness has persistence. The nearer round number handles at 650.0 and 640.0 frame the immediate contest. Reclaiming 650.0 would show that buyers are rebuilding control, while continued acceptance below 640.0 would suggest that dip demand is failing.
A shelf of support sits at 638.8, about 0.2 percent below. It matters because it is the closest defined area where buyers can defend the pullback before the structure deteriorates. The month swing high is 660.0, about 3.1 percent above the current price, and marks the key supply boundary. The three month range is 601.7 to 663.4, so the market is testing support while still occupying the upper portion of its broader range.
The bull path is straightforward: if 638.8 holds, then stabilization above 640.0 can begin a recovery toward 650.0 and 651.4. If buyers subsequently force a decisive move above 660.0, that opens the path toward 663.4 and confirms that the pullback has been absorbed. The bear path is equally clear: if 640.0 cannot be recovered and 638.8 is lost, then the break signals more than routine consolidation and exposes 601.7.
The read is invalidated on either side by failed follow-through. A brief support breach followed by a fast recovery would trap sellers, while a move above 650.0 that cannot hold would leave supply dominant. Net, the longer trend remains constructive, but the burden of proof has shifted to buyers at 638.8. Until they defend it and reclaim 650.0, caution is warranted.
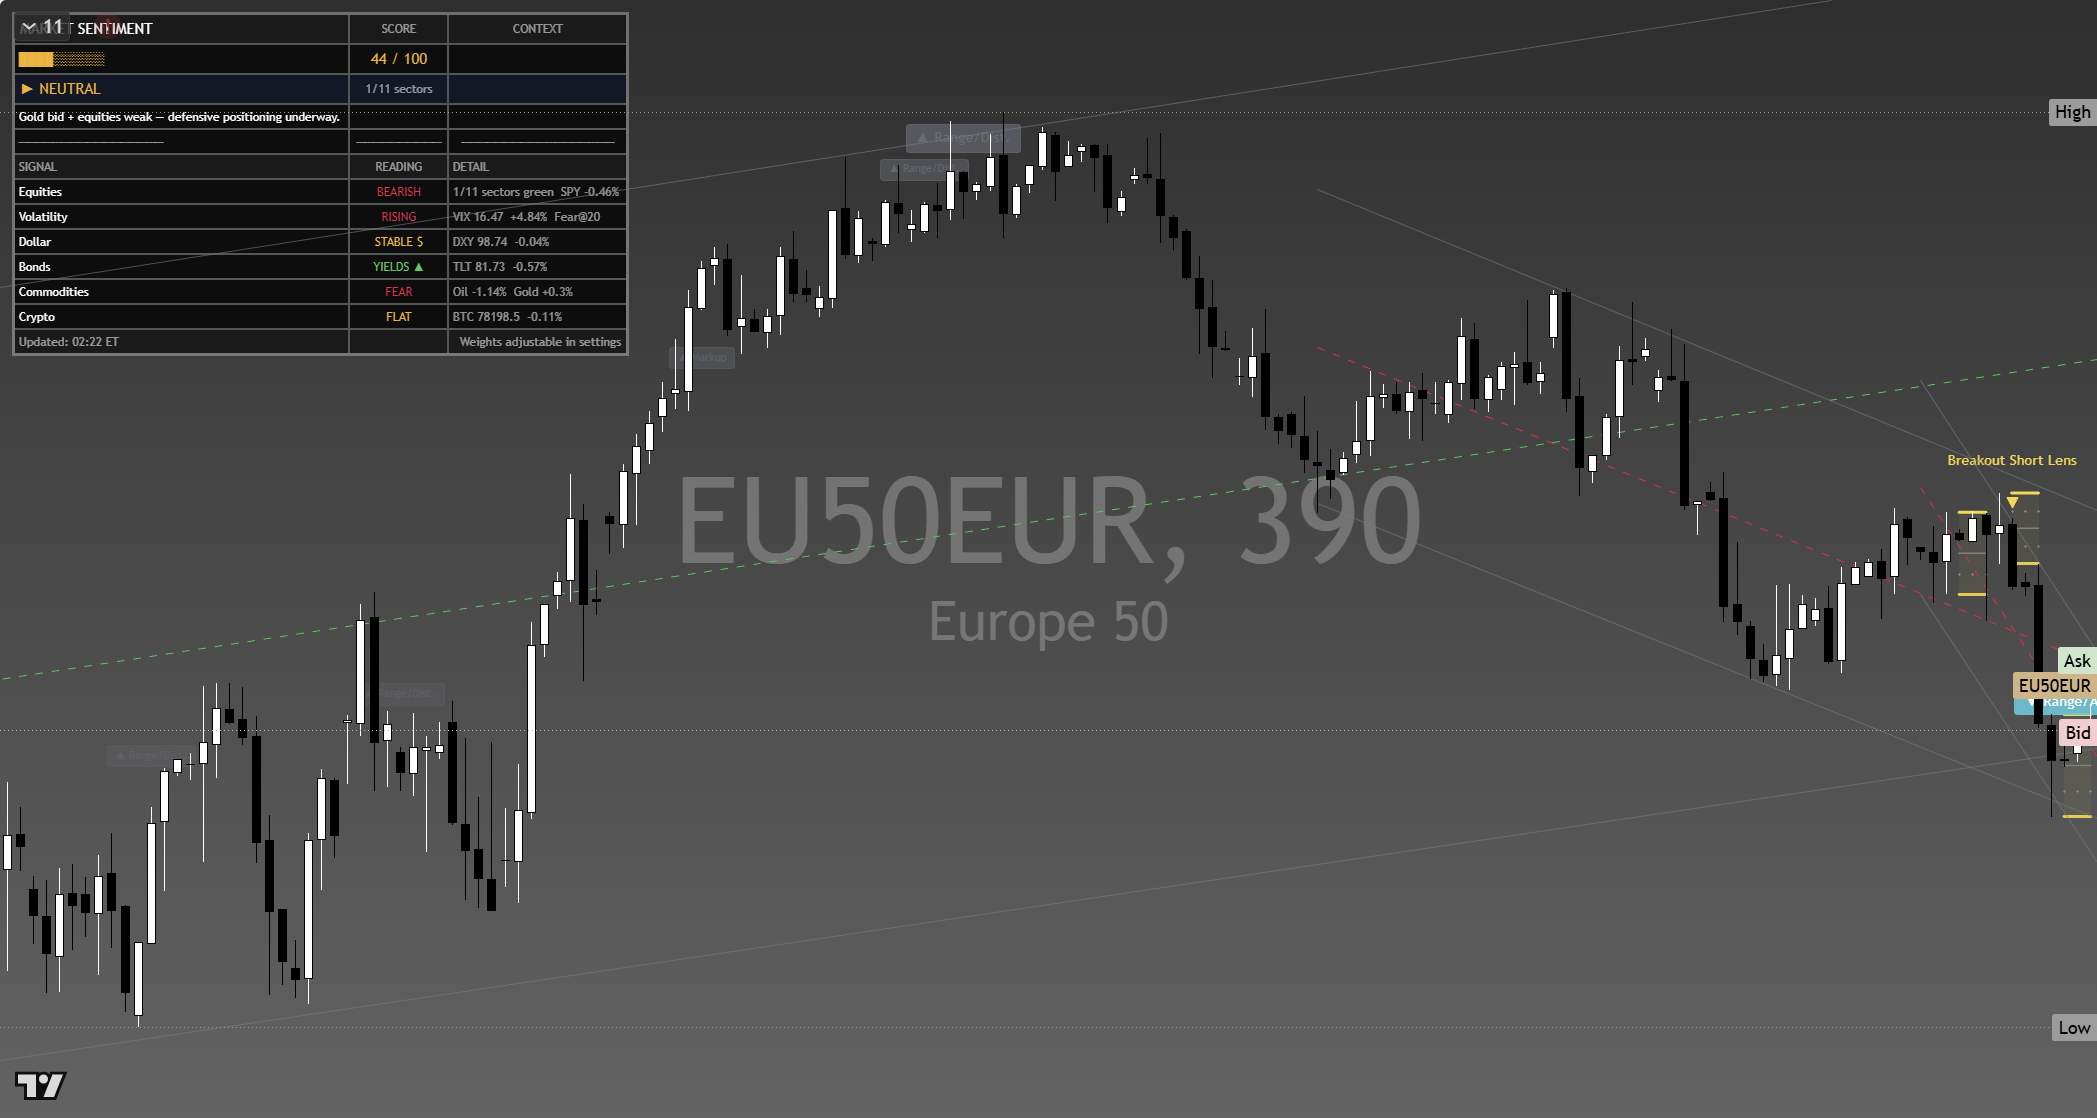
The chart above is the full daily read: structure, momentum, the levels that matter, and where the current price sits against them. Read it top to bottom for the complete picture, and pair it with our session briefs for the wider market context.
This is analysis, not financial advice. It reflects our multi-factor framework and is not a recommendation to buy or sell. Always do your own research and manage your risk.