S&P 500 (SPX) – Daily Read
10 September 2026 | Index | Titan Macro Desk
7,636.4
The S&P 500 is in a controlled but increasingly important pullback, not yet a broken uptrend. Last price is 7,636, 0.0 percent higher on the day, leaving the index down near the floor of its one-month range. The clear view is cautiously constructive while nearby support holds, but conviction should remain measured because price is no longer absorbing macro pressure comfortably. This matters because the market is testing whether buyers still regard weakness as an opportunity or whether persistent inflation and policy uncertainty are forcing a broader reduction in equity exposure.
The immediate catalyst is an unfavorable mix of elevated energy costs, geopolitical supply risk, and anxiety around incoming inflation data. That combination can keep bond yields firm and complicate the Federal Reserve’s decision, which is especially relevant for an index carrying substantial exposure to highly valued growth companies. The economic backdrop remains resilient enough to support earnings expectations, but that resilience also limits the case for easier policy. For SPX, the tension is therefore straightforward: corporate durability continues to support the longer trend, while renewed inflation risk challenges valuations. The index is roughly 1.2 percent down over the last two weeks, showing that sellers have gained tactical control without yet proving that the broader advance is finished.
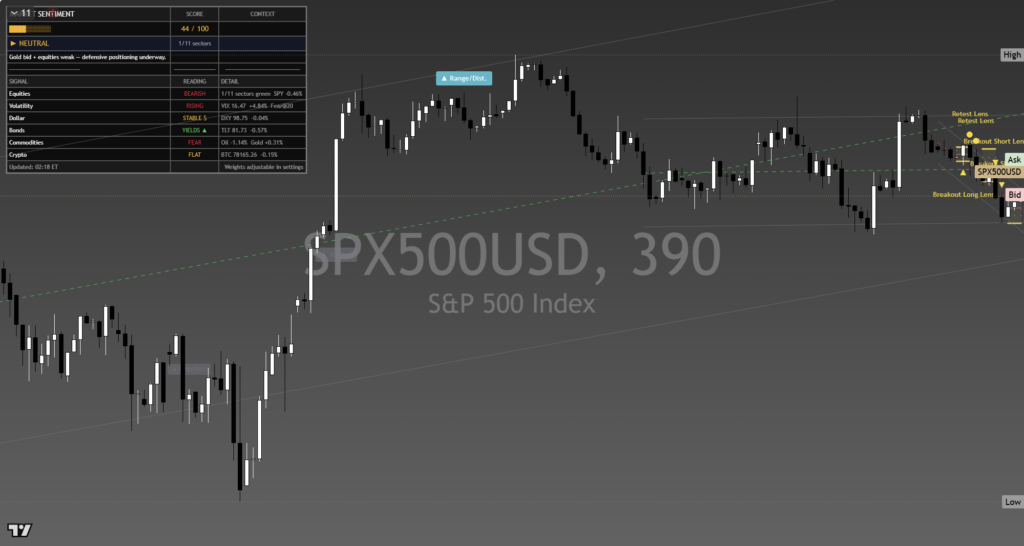
The one month average is 7,688; price is below it, and the structure reads as a pullback, slipping under the one-month average while the longer trend still points up. Recovering that area would show that buyers are again willing to carry exposure through the macro uncertainty. The month swing high is 7,810, about 2.3 percent above the current price, and sits just beneath the upper edge of the three month range of 7,238 to 7,817. That concentration makes the region a genuine supply test rather than a routine waypoint. A shelf of support at 7,611, about 0.3 percent below, is the immediate defense because it separates a shallow retreat from a deeper range rotation. The nearer round number handles at 7,750 and 7,500 frame sentiment: the former would signal improving control by buyers, while the latter would become the next psychological defense if support fails.
If 7,611 holds and price reclaims 7,688, then the pullback remains corrective and a push through 7,750 should draw attention back toward 7,810. A decisive move above 7,810 opens the path toward 8,000, because it would clear both recent supply and the top of the broader range. If 7,611 breaks decisively, then buyers have failed at the range floor and pressure should turn toward 7,500. Failure there would expose 7,238 and convert the decline from consolidation into a more meaningful trend challenge.
The principal risk to the constructive case is another inflationary impulse that lifts expected policy restraint and compresses equity valuations. The bearish read would be invalidated by a durable recovery above 7,810, while the bullish read fails on sustained trade below 7,611. Net, the longer trend still deserves respect, but the burden has shifted to buyers to defend support and retake lost ground.
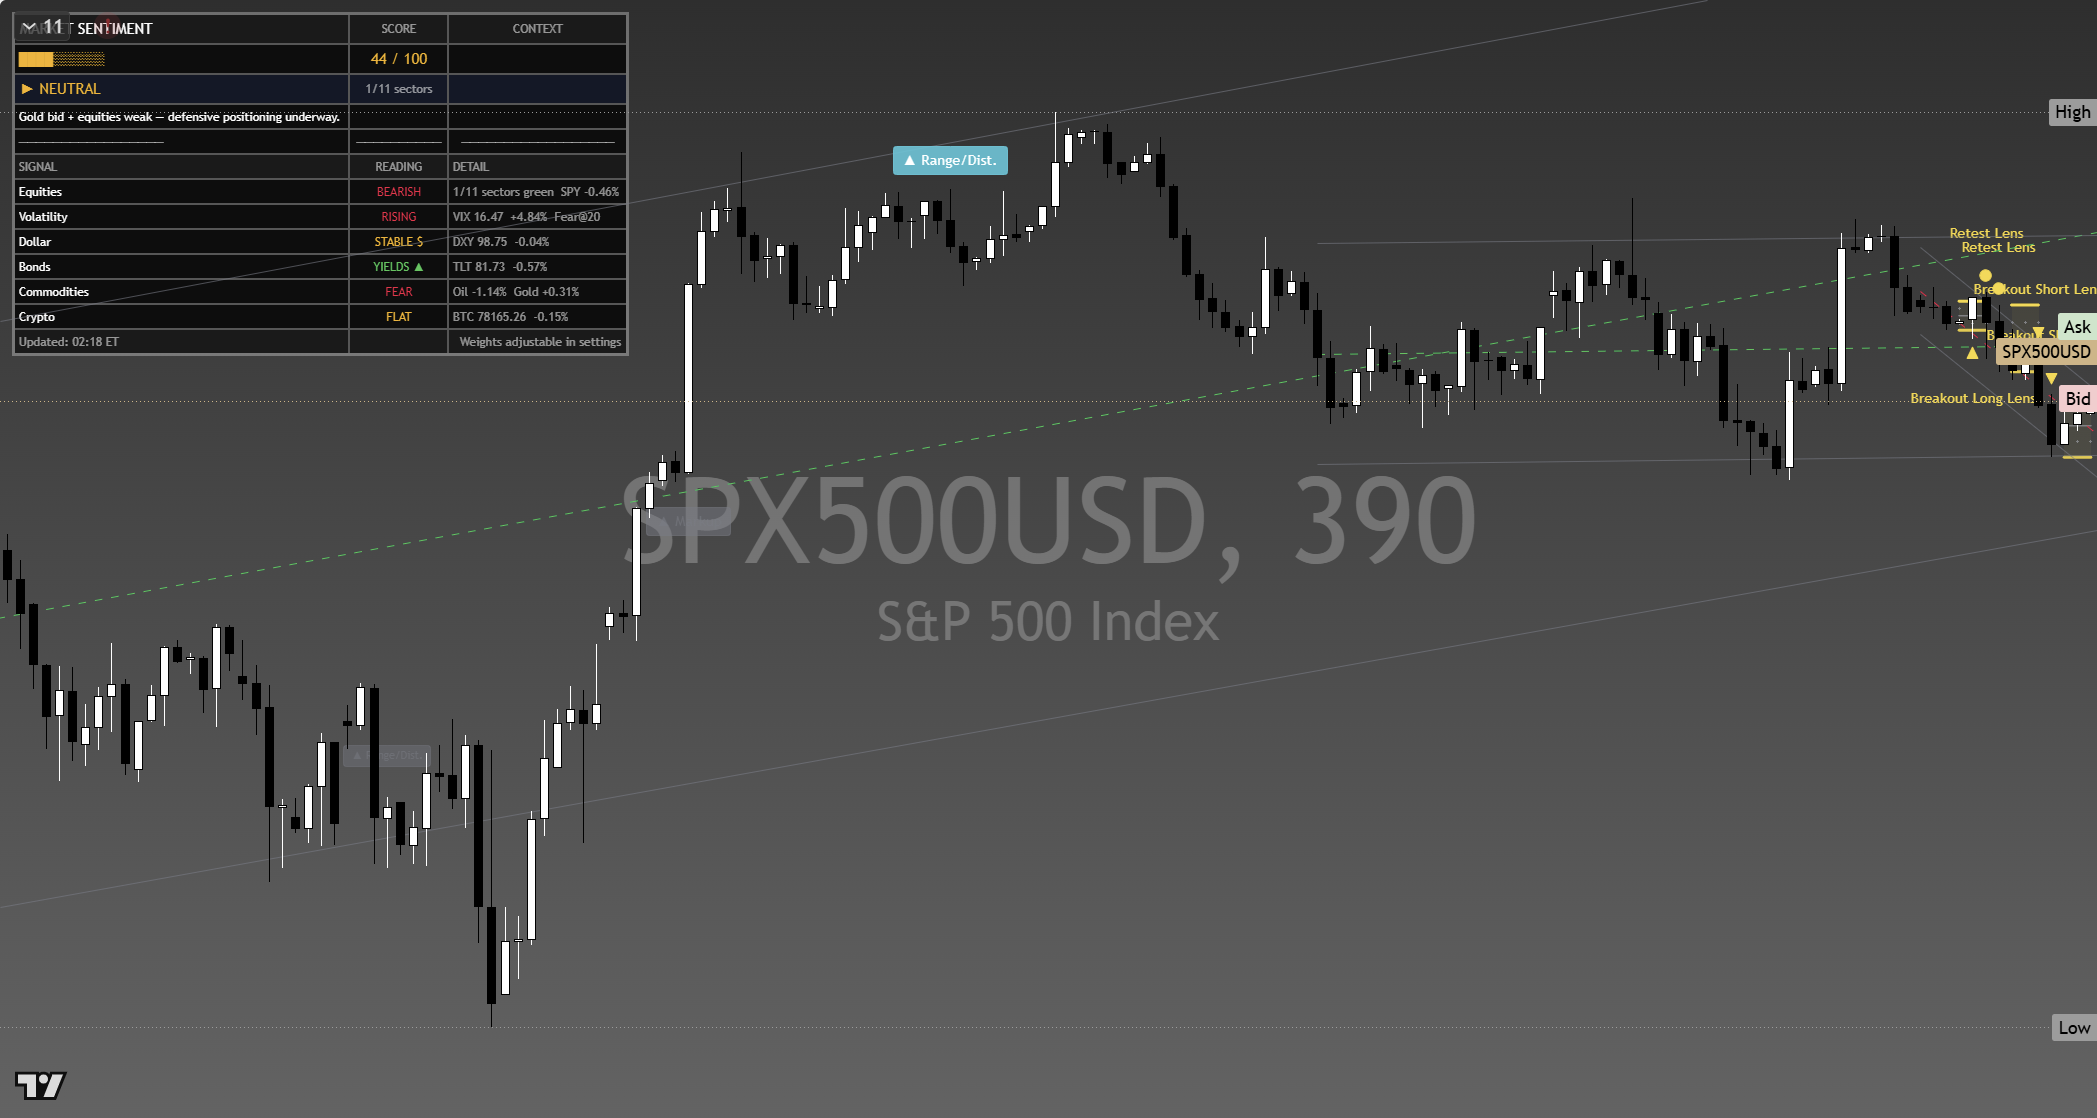
The chart above is the full daily read: structure, momentum, the levels that matter, and where the current price sits against them. Read it top to bottom for the complete picture, and pair it with our session briefs for the wider market context.
This is analysis, not financial advice. It reflects our multi-factor framework and is not a recommendation to buy or sell. Always do your own research and manage your risk.



