S&P 500 (SPX) – Daily Read
8 September 2026 | Index | Titan Macro Desk
7,718.6
The S&P 500 remains in a constructive uptrend, but the immediate trade is compression rather than acceleration. Last price is 7,719, 0.0 percent higher on the day, leaving the index close enough to resistance to preserve an upside breakout case, yet without the price expansion needed to confirm it. The clear view is cautiously bullish: trend control still belongs to buyers, but fresh exposure needs either a defended pullback or a clean escape from the recent ceiling.
The macro backdrop is creating that hesitation. A stronger labor-market update has revived concern that the Federal Reserve may keep policy restrictive or tighten further, lifting yields and raising the valuation hurdle for equities. Inflation data and the approaching policy meeting now matter because they can either validate that concern or release the pressure. [Recent market context](https://apnews.com/article/1af16359af43eb8abc66445465f633c8) and the [Federal Reserve calendar](https://www.federalreserve.gov/monetarypolicy.htm) reinforce the point: this is a data-sensitive index sitting near its upper boundary. For the S&P 500 specifically, resilience in growth leadership is supporting the asset class, while higher yields remain the main challenge to multiple expansion.
The index is sitting mid-range over the past month. Its one month average is 7,703; price is above it, and the structure reads as a clean uptrend, price above both its one-month and longer averages. Momentum is roughly 0.6 percent up over the last two weeks, positive but controlled rather than stretched. That makes 7,750 the immediate test of buyer intent. Sustained acceptance above that nearer round number handle would show that demand is becoming more assertive. The month swing high is 7,817, about 1.3 percent above the current price, and it is the real breakout gate because sellers have previously capped progress there.
Below, a shelf of support sits at 7,611, about 1.4 percent below. It matters because buyers defending it would preserve the sequence of higher trading zones and keep pullbacks corrective. The nearer round number handle at 7,500 is a deeper sentiment line where bargain demand should emerge if the broader trend remains credible. The three month range is 7,238 to 7,817, so failure at the upper boundary followed by loss of support would turn a consolidation near the highs into a broader range reversal.
If buyers reclaim 7,750 and maintain pressure, then a retest of 7,817 becomes the base case; a decisive move above 7,817 opens the path toward 8,000 as sidelined demand and breakout buying reinforce each other. If price rejects the upper zone and then loses 7,611, then the bullish structure weakens materially; losing 7,611 exposes 7,238, with 7,500 unlikely to provide more than an interim defense unless buyers respond forcefully.
The principal risk is a renewed rise in policy expectations and yields, especially if incoming inflation evidence challenges the equity market’s valuation tolerance. The read is invalidated by sustained trade below 7,611, not by ordinary noise around 7,703. Net, the S&P 500 remains buy-the-dip constructive while support holds, but conviction should increase only through 7,817.
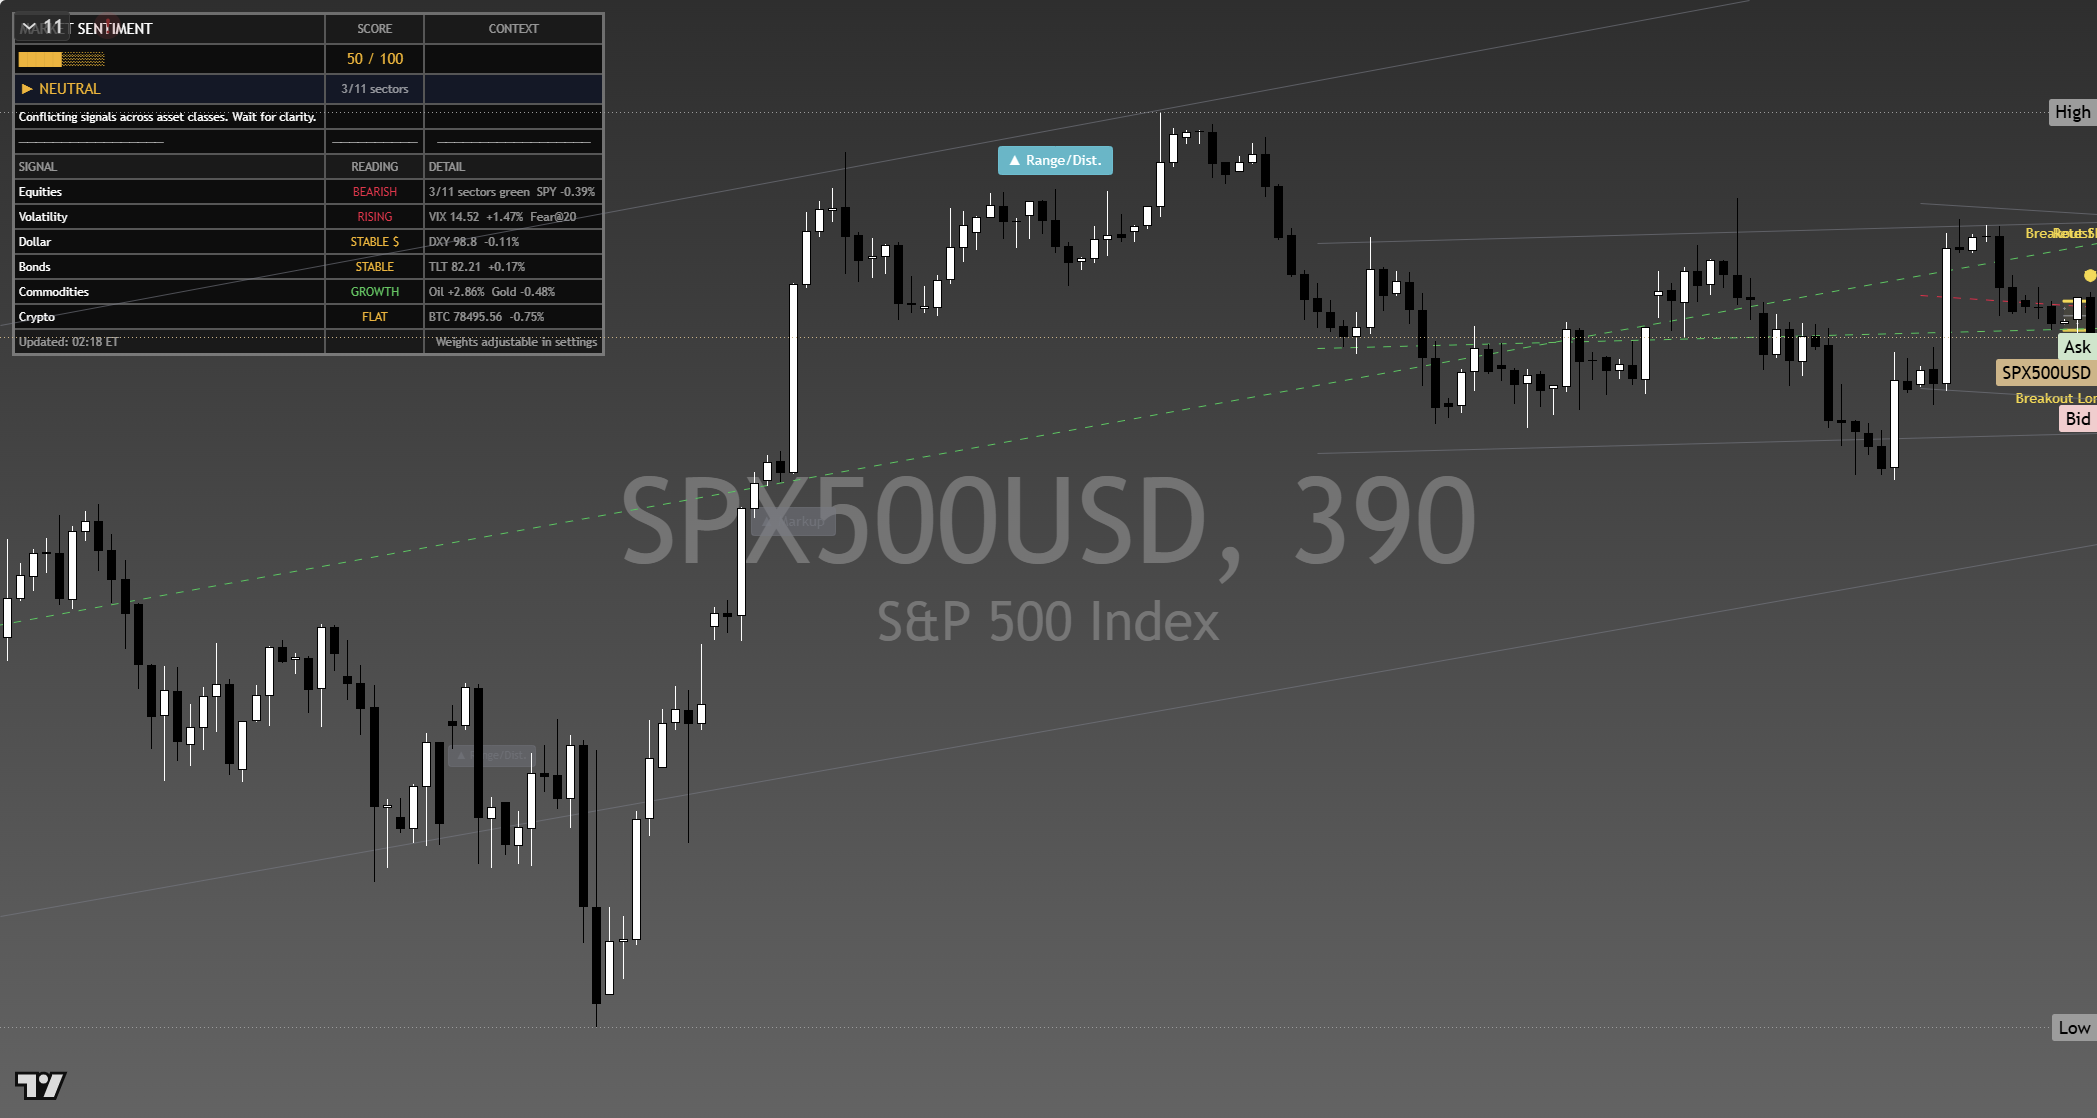
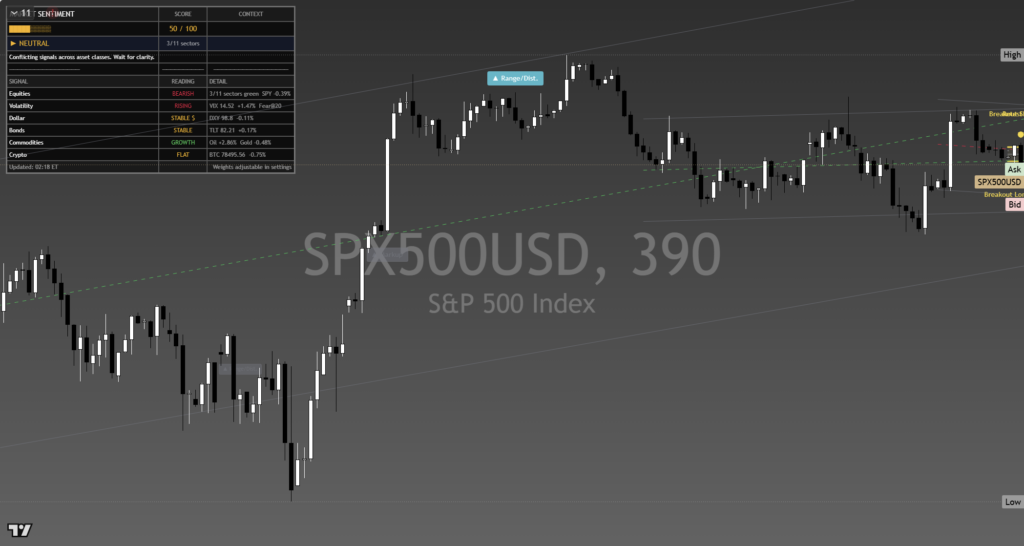
The chart above is the full daily read: structure, momentum, the levels that matter, and where the current price sits against them. Read it top to bottom for the complete picture, and pair it with our session briefs for the wider market context.
This is analysis, not financial advice. It reflects our multi-factor framework and is not a recommendation to buy or sell. Always do your own research and manage your risk.



