S&P 500 (SPX) – Daily Read
7 September 2026 | Index | Titan Macro Desk
7,718.6
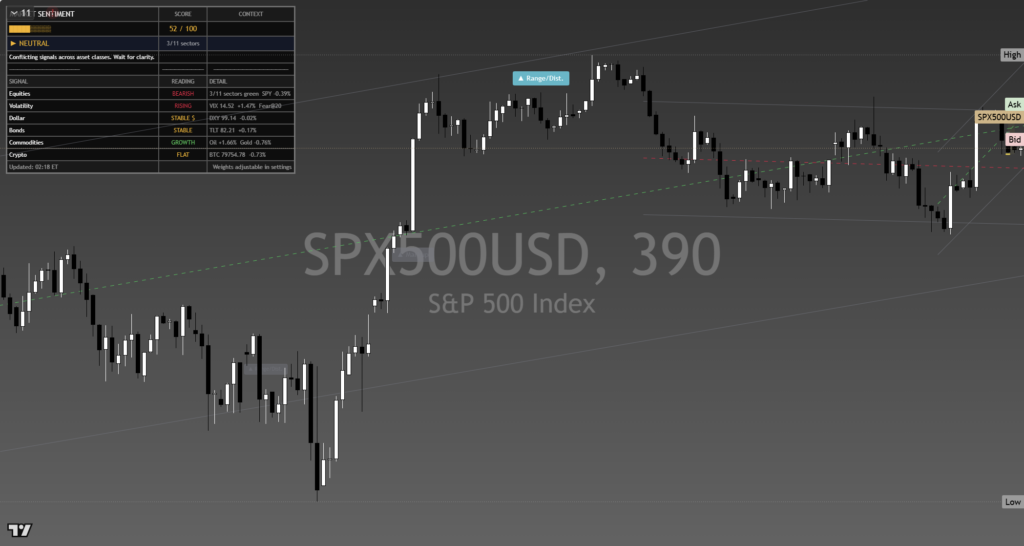
The S&P 500 is consolidating within an established advance rather than signaling a meaningful loss of control. Last price is 7,719, 0.0 percent higher on the day, with the index sitting mid-range over the past month. That lack of immediate movement matters because it reflects balance near elevated prices, not aggressive distribution. The cleanest view is constructive while support holds, but buyers still need to clear the recent ceiling before the next leg can develop.
The broader macro backdrop is best characterized as a contest between confidence in durable growth and sensitivity to any shift in financial conditions. For an index, that tension works through expectations for earnings, valuation tolerance, and the willingness to hold broad market exposure. The one month average is 7,706; price is above it, and the structure reads as a clean uptrend, price above both its one-month and longer averages. Momentum roughly 0.5 percent up over the last two weeks reinforces that positive bias, although the restrained pace suggests accumulation rather than a chase.
The month swing high at 7,817, about 1.3 percent above the current price, is the key test of demand. It marks the point where previous buying stopped advancing, so sellers and profit-taking are likely to defend it. The nearer round number handle at 7,750 is the first area where buyers can demonstrate intent. Holding above it would improve the quality of any challenge to the high. A decisive move above 7,817 opens the path toward 8,000, where the psychological importance of the round number could attract both momentum demand and supply.
Below the market, a shelf of support at 7,611, about 1.4 percent below, is the principal defense of the current structure. Buyers need to protect it because a sustained loss would turn consolidation into deterioration. The nearer round number handle at 7,500 would then become an important battleground, but it would sit inside a weakening structure rather than represent confirmed safety. The three month range is 7,238 to 7,817, and losing 7,611 exposes 7,238, the lower boundary where the broader advance would face a much more consequential test.
The bull path is straightforward: if the index establishes acceptance above 7,750, then demand should press against 7,817; if that ceiling breaks decisively, then 8,000 becomes the logical destination. The bear path begins if attempts above 7,750 repeatedly fail and price retreats through 7,706. If sellers then force a loss of 7,611, the market would likely seek liquidity around 7,500 before exposing 7,238.
The main risk to the constructive read is that apparent stability masks weakening participation or a macro catalyst abruptly reduces valuation tolerance. A decisive loss of 7,611 invalidates the near-term bullish structure. Conversely, repeated rejection at 7,817 would argue for patience even while the trend remains intact. Net, the bias stays bullish above support, but conviction should increase only through a confirmed break of the range ceiling.
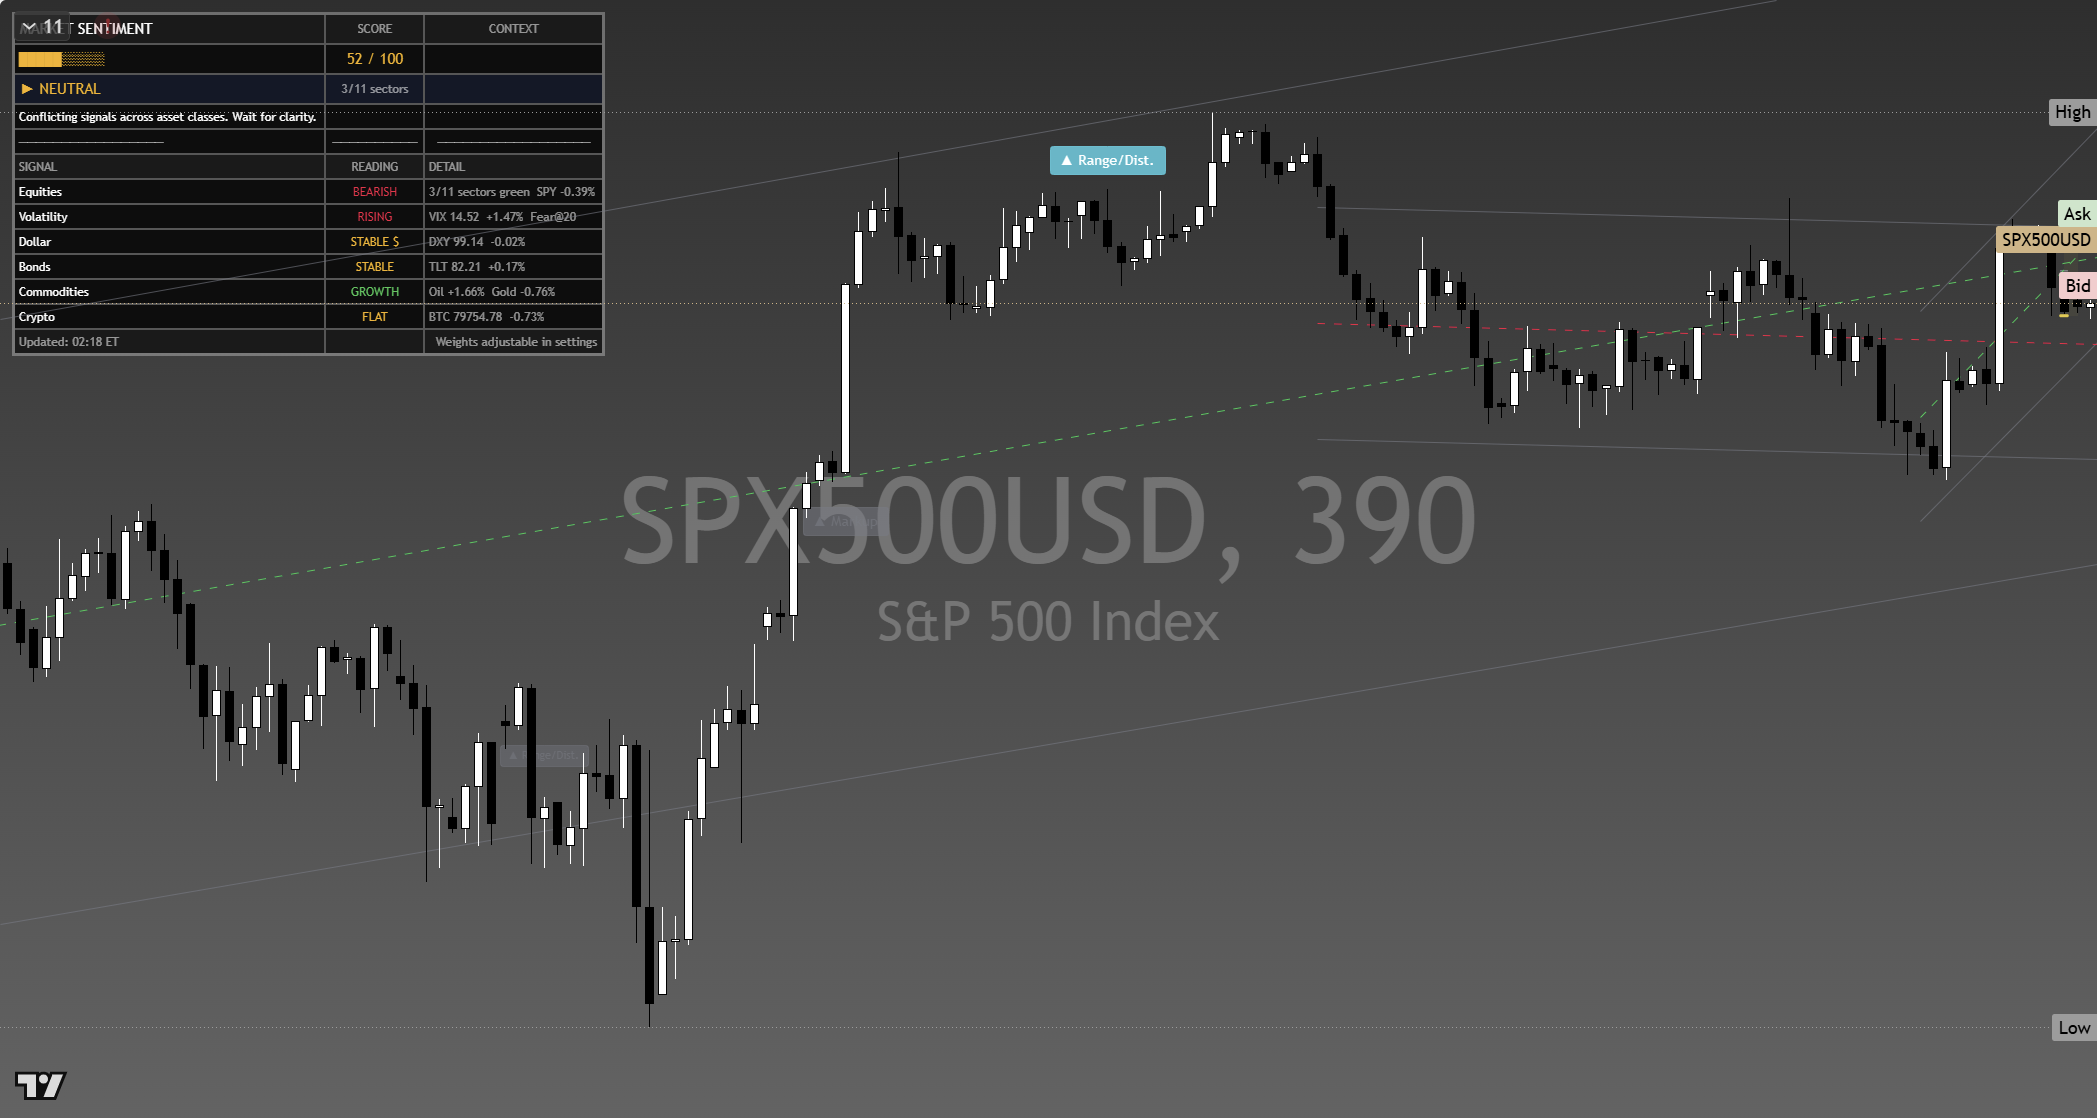
The chart above is the full daily read: structure, momentum, the levels that matter, and where the current price sits against them. Read it top to bottom for the complete picture, and pair it with our session briefs for the wider market context.
This is analysis, not financial advice. It reflects our multi-factor framework and is not a recommendation to buy or sell. Always do your own research and manage your risk.



