S&P 500 Slips 0.45% as Crude Rips 5.3% in a Textbook Rotation Day
Market Moves | Tuesday 7 July 2026 | Post-Close read | 16:00 New York / 21:00 London / 05:00 Tokyo
Nothing broke today, but plenty rotated. The S&P 500 (SPY) closed down a contained 0.48%, the kind of number that reads calm on a headline scroll. Underneath it, the Nasdaq 100 (QQQ) lost 1.85% with semiconductors doing the damage, crude oil went vertical for 5.3%, gold gave back its entire weekend rip, and the VIX barely blinked at 16.13. That combination only happens on one type of day: money leaving high-beta growth and piling into hard assets, not money leaving the market. We have seen this shape before. Tonight it showed up with unusual cleanliness.
The thesis in one line
This was a rotation session, not a risk-off event. Energy took the leadership baton, technology handed back its recent gains, and every volatility gauge that matters stayed contained. The tape sold semiconductors, not confidence.
The Close, In Full
Start with the number that gets quoted on the nine o’clock news: the S&P 500 (SPX) finished at 7,503.85, down 0.45% on the session, having opened at 7,516.63 and never traded far from that mark until the last hour dragged it to a 7,478.63 low. The SPDR S&P 500 ETF Trust (SPY) tracked it down to 747.71, off 0.48%, inside a 745.21 to 750.96 range. That is not a breakdown. That is a market taking a breath.
Now look one level down and the story changes completely. The Nasdaq 100 (QQQ) fell 1.85% to 709.43, and the underlying Nasdaq-100 index (NDX) dropped 1.77% to 29,173.02, sliding as low as 28,974.47 intraday, a level that matters because it sits below the 29,355 gap floor we were watching only 24 hours ago. Semiconductor and memory-chip names were the identified drag, the same corner of the market that has carried this tape higher for months now handing some of it back.
The Dow Jones Industrial Average (DIA) barely noticed, down just 0.31% to 528.45, while the underlying Dow index eased 0.25% to 52,925.15. The Russell 2000 (IWM) fell 0.91% to 296.19, tracking the broad tape rather than leading it either way. Three different indices, three different stories, one session.
The Round Trip: What Yesterday’s Calm Turned Into
Yesterday we flagged that the Nasdaq-100 had closed up 1.3% at 29,698, holding a reopen gap but stalling short of the 29,921 line that would have confirmed the week’s bullish regime decisively. We also noted a VIX at 15.6 heading into today’s session was “the cheapest event insurance the market has offered in weeks,” and that a book positioned for calm had left itself no cushion.
Tonight answered that setup, just not with the catalyst we were watching for. The Nasdaq-100 did not wait for Wednesday’s rate decision minutes to test its gap floor. It found a different reason entirely: crude oil. The index gave back the whole 1.3% gain and then some, dropping 1.77% to close below the 29,355 line we called the “unfilled gap floor” only a day earlier. Gold did something similar in reverse. Yesterday it ripped 1.8% to 4,187, breaking its weekend cap with real conviction. Tonight it gave essentially all of that back, closing at 4,116.60, down 0.93%, having printed a 4,192.40 high early before fading hard into the close. Crude, on the other hand, went the opposite direction from its own recent pattern: yesterday it merely “held the $67 line” with a token 0.2% gain to 68.85. Tonight it broke out for real, opening at its own low of 68.58 and closing near the day’s 72.51 high at 72.20, a 5.3% move that is the single biggest number on tonight’s board.
Bitcoin (BTC/USD) completed the reversal set. Yesterday’s 1.0% recovery to 64,188 unwound tonight into a 1.07% decline to 63,309, tracking the tech-led risk-off pocket rather than the energy-led rotation. The VIX itself is the neatest full circle of the lot: 15.6 last night, 16.13 tonight, a move that is almost the mirror image in percentage terms. Calm going out, calm coming back in, with a genuinely different market underneath it both times.
The honest miss: our scenario map last night gave only a 20% weight to a gap-fill move below the 29,355 floor, and we tied that outcome specifically to a hawkish surprise in Wednesday’s rate-decision minutes. The floor broke anyway, a day early, and the minutes have not even been released yet. The level mattered exactly as much as we said it would. The catalyst we attached to it was wrong. That distinction matters: reading structure correctly and reading the trigger correctly are two different skills, and tonight only one of them showed up.
Rotation Anatomy: Where the Money Actually Went
Energy did not just outperform tonight, it dominated. Crude Oil WTI (CL) closed at $72.20, up 5.32%, with Brent Crude (BZ) close behind at $75.86, up 5.38%. Both markets opened at their session lows and closed within a whisker of their highs, the shape of a genuine breakout rather than a squeeze that fades. Natural Gas (NG) added a supporting 1.11% to $3.281. That is unambiguous energy-complex leadership, and it is the reason the Dow and the broad S&P held up far better than the Nasdaq: energy-heavy value names caught a bid that growth names never got near.
Here is where the tension shows up, and it is worth sitting with rather than smoothing over. If this were a broad reflation trade, the precious metals would be rising alongside crude. They are not. Gold (XAU/USD) fell 0.93% to $4,116.60 and Silver (XAG/USD) fell harder, down 2.45% to $60.40, off a $62.59 high. Copper (HG), the metal that usually tells you something honest about global growth expectations, closed flat at $6.182, up a token 0.06%. As our Raw Materials coverage highlights this week, that split, energy up hard, metals down, copper dead flat, is not a uniform commodity story. It is an energy-specific supply and geopolitical impulse riding on its own, disconnected from the inflation-hedge or growth narrative that would normally pull gold and copper along for the ride.
The read says this should be inflationary and therefore bad for risk assets broadly. But the VIX did not move like an inflation scare, and the Dow did not sell off like one either. The tension is real and it is not resolved: crude at these levels feeds into the next inflation print one way or another, yet tonight’s tape traded it as a sector rotation story, not a macro regime change. Our Macro Pulse briefing frames it as the second consecutive session with the regime held at neutral, the calendar itself thin on first-tier US data, which left crude as the only truly high-conviction directional signal on the board.
That last line deserves its own paragraph. Our Digital Flow read this evening notes that Bitcoin’s move mirrored the Nasdaq’s almost tick for tick, closing near the bottom of its $62,768 to $64,221 range, while the wider crypto complex fell with it: Ethereum (ETH) down 1.42% to $1,772, Solana (SOL) off 1.58%, Ripple (XRP) the sharpest large-cap loser at down 2.81%, and Avalanche (AVAX) leading the alt bleed at down 3.50%. Crypto sat firmly in the tech-correlation camp tonight, not the energy-rotation camp. That single fact is a decent litmus test for how the market is actually thinking: risk assets that trade with growth stocks lost money, and hard assets tied to energy supply made it. The line between the two was clean.
Sentiment and the Volatility Check
Here is the part of tonight’s tape that should make anyone nervous about calling this a straightforward risk-off session pause and reconsider. The CNN Fear & Greed measure jumped to 43, still labelled neutral but up a full 8.9 points from yesterday’s 34.1. Fear eased on a day when the Nasdaq fell 1.85%. That does not happen during genuine liquidation. Meanwhile, individual investor sentiment moved the opposite way: the weekly retail bullish reading collapsed 13.6 percentage points to 31.4%, below its long-run average of 37.5% for the sixth time in seven weeks, with the neutral camp swelling to 47.7%. Retail is washing out its optimism at the exact moment the price-based fear gauge is calming down. As our Sentiment brief puts it, that divergence, institutional and price-based measures improving while retail surveys sour, is the textbook shape of a wall-of-worry setup, not a top.
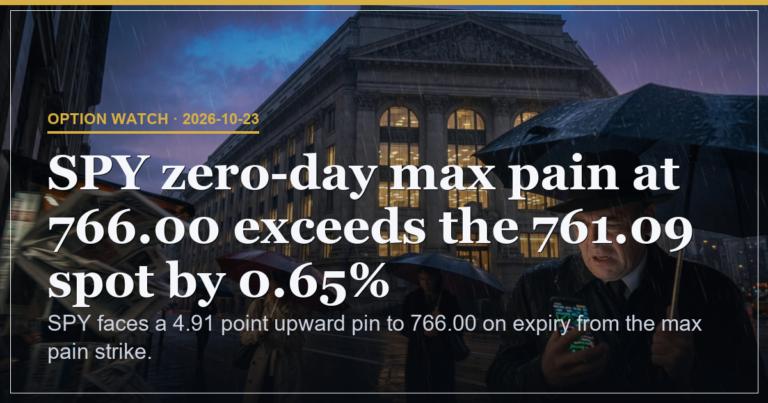
The options market backs this up. The composite put-call ratio sits at 0.767, comfortably call-tilted, and our Options desk flags that every major index’s zero-days-to-expiry max pain level sits above tonight’s spot price: the S&P 500 ETF (SPY) pin at 749 against a 747.71 close, the Nasdaq 100 (QQQ) pin at 724 against 709.43. Dealer positioning is a mechanical pull higher into expiry, not a directional forecast, but it is one more data point arguing against panic.
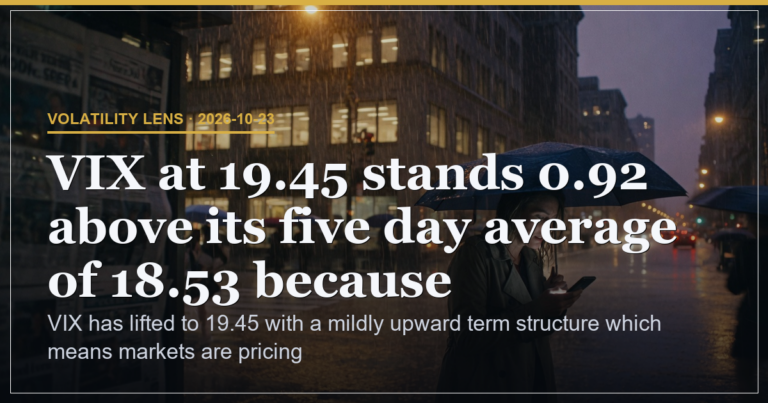
Now the volatility structure itself. The VIX closed 16.13, up 3.6% on the day, yet that print still sits fractionally below its own five-day average of 16.21. The VIX9D term structure reads 13.42, comfortably under spot, the normal upward-sloping shape you want to see: no inversion, no stress, no sign the options market expects trouble in the next nine days. The VVIX, the volatility-of-volatility gauge, sits at 87.9, on the low side, meaning demand for tail-risk protection is subdued rather than urgent. Our Volatility read for tonight is blunt about what this means: a 1.77% index decline that barely moves the fear gauge is an orderly rotation, not a liquidation event. If this were the start of something nastier, VVIX and VIX9D would already be telling you.
Currencies: The Quiet Corner of the Rotation
FX did not have a loud night but it was not silent either. The Dollar Index (DXY) firmed 0.28% to 101.13, a mild broad-dollar bid that our FX brief calls a pivot rather than a breakout. USD/JPY rose 0.43% to 162.15, keeping the yen-funded carry trade intact with no reversal signal in sight. EUR/USD slipped 0.24% to 1.1410, GBP/USD sat completely flat at 1.3353, and USD/CHF posted the day’s biggest dollar gain against a major, up 0.59% to 0.8086. Commodity currencies were mixed rather than following crude higher: AUD/USD down 0.14%, USD/CAD essentially flat, NZD/USD off 0.50%. If crude’s rip were a broad growth signal, you would expect the commodity bloc to catch a bid. It did not, which is one more piece of evidence that tonight’s energy move is a supply story rather than a demand one.
Key Levels We Are Watching
Our Setup Radar coverage and tonight’s options-desk read agree on the number that decides the next 24 hours for the broad tape: 745.21 on the S&P 500 ETF (SPY). That was today’s low and it held all session. Lose it and the conversation changes from rotation to something with more teeth. Above spot, the 749 max-pain magnet and the 751.28 prior close are the reclaim targets that would put this pullback back in the “one bad afternoon” column rather than the “trend change” column.
Multi-Strategy Breakdown
Scalping (1-5 minutes): the 745.21 to 750.96 SPY range is the whole game intraday. Fade the edges, respect the 749 pin, and stand down the moment volume dries up near either boundary. Crude’s intraday range, 68.58 to 72.51, is wide enough for scalpers but the move is already extended; the smarter scalp tonight was long the dip toward 70, not chasing the high.
Intraday (15 minutes to 4 hours): the pair trade our Tactics coverage keeps coming back to, long value against short tech, is the cleanest intraday expression of tonight’s data. Dow relative strength against Nasdaq weakness is not a one-session fluke when the vol and sentiment gauges both confirm it is rotation rather than capitulation. A break of QQQ’s 704.90 low targets a further push toward the 700 round number; a reclaim of 716 argues the tech leg is done falling for now.
Swing (1-5 days): crude’s breakout has legs into $76 if the momentum holds, but the entry has already run; waiting for a retest of $70-71 is the more disciplined swing entry than paying up at $72.50. On the equity side, the swing question is entirely about 745.21 SPY. Hold it into Wednesday’s rate-decision minutes and Thursday’s PepsiCo (PEP) and Progressive (PGR) earnings, and the rotation likely resolves as a pause within an uptrend. Lose it, and the swing bias flips defensive fast.
Risk Read
RISK: 38%
Rotation, not liquidation, caps the risk well below anything approaching a warning level. But three factors keep it above the low-30s floor: the Nasdaq-100 broke a level we flagged as meaningful a day early and without its expected trigger, dealer gamma across single names reads negative, which our Options desk notes can amplify a move in either direction if spot breaks its range, and Wednesday’s rate-decision minutes land on a tape that has already shown it can move fast on a single data point. None of that is a red flag on its own. Together, it is enough to keep size honest rather than heroic.
Three Scenarios Into Wednesday and Thursday
The sideways case carries the most weight for a reason: nothing in tonight’s vol or sentiment data argues for an immediate resolution either way. The bull and correction cases are near mirror images of each other, both hinging on the same two triggers, the 745.21 line and Wednesday’s rate-decision minutes, just resolving in opposite directions.
Position Sizing
Reading This At Your Level
Beginner: the single thing to take from tonight is that a red day on the news is not automatically a bad day for your portfolio. The S&P 500 fell less than half a percent while a specific corner of the market, chip stocks, did most of the damage inside the Nasdaq. Before reacting to any “markets fall” headline, check whether the fall is broad or narrow. Tonight it was narrow. That distinction changes what, if anything, you should be doing about it, which for most beginner accounts is nothing at all.
Intermediate: the useful skill tonight is reading a rotation rather than a direction. Energy up, tech down, value outperforming growth, gold fading rather than catching a haven bid, this is a market reshuffling its winners, not abandoning risk. Watch for confirmation or denial at the 745.21 SPY level tomorrow; that single line tells you whether the rotation stays contained or widens into something broader.
Advanced: the negative dealer gamma flagged across single-name options tonight is the detail worth building a plan around. A negative-gamma regime means dealer hedging amplifies moves rather than dampens them once spot breaks its recent range in either direction. Combined with a call-tilted put-call ratio and an upside max-pain pin, the mechanical bias into Wednesday’s expiry is higher, but any break below 745.21 could accelerate faster than the calm VIX print currently suggests. Size for that asymmetry, not for the headline vol number.
Three-Timeframe Verdict
Short-term (1-7 days): neutral, tilted cautious. The 745.21 SPY line and Wednesday’s rate-decision minutes are the two swing factors, and both cut either way with roughly equal force right now.
Medium-term (1-8 weeks): constructive. Real-money futures positioning remains net long the S&P and Nasdaq per the latest weekly report, per our Institutional Flow brief, and a call-tilted options market rarely sits underneath a genuine top.
Long-term (2-12 months): bullish-leaning, unchanged from recent weeks. Nothing in tonight’s data, not the crude spike, not the tech pullback, not the gold fade, rises to the level of a structural regime change. It is a rotation inside an intact trend until proven otherwise.
What We Called vs What Happened
Last night’s post-close brief put a 40% weight on the Nasdaq-100 grinding higher through 29,921 to confirm the week’s bullish regime, 35% on a range-bound hold beneath that level into Wednesday’s minutes, 20% on a hawkish-surprise-driven gap fill toward 29,355, and 5% on an external shock. What actually happened does not sit cleanly in any single bucket, which is itself the honest lesson. The index did not grind higher, and it did not simply range beneath 29,921 either. It broke straight through the 29,355 floor we had reserved for the 20% hawkish-surprise case, but the trigger was crude oil and sector rotation, not the rate-decision minutes we had pencilled in as the catalyst. The level held its predictive value. The story attached to it did not. That is the difference between structure and narrative, and tonight is a clean example of why we separate the two rather than pretend a single number explains everything.
Continue Reading Tonight’s Full Picture
This read sits inside a wider evening of coverage. For the block-flow and real-money angle behind tonight’s bullish undercurrent, see our Institutional Flow brief. For the dealer positioning and max-pain mechanics driving the upside pin, our Options brief goes deeper. The full sector-by-sector breakdown of tonight’s rotation lives in our Hot Zones read, and the commodity-specific detail behind the crude breakout and the gold fade is in our Raw Materials brief. For how crypto tracked the tech complex down rather than the energy complex up, see our Digital Flow brief, and for the currency-market read on tonight’s mild dollar bid, our FX brief has the full board.
Analysis, not financial advice. Always manage your own risk. Titan Macro Desk.