Solana (SOL) – Daily Read
28 September 2026 | Crypto | Titan Macro Desk
$121.78
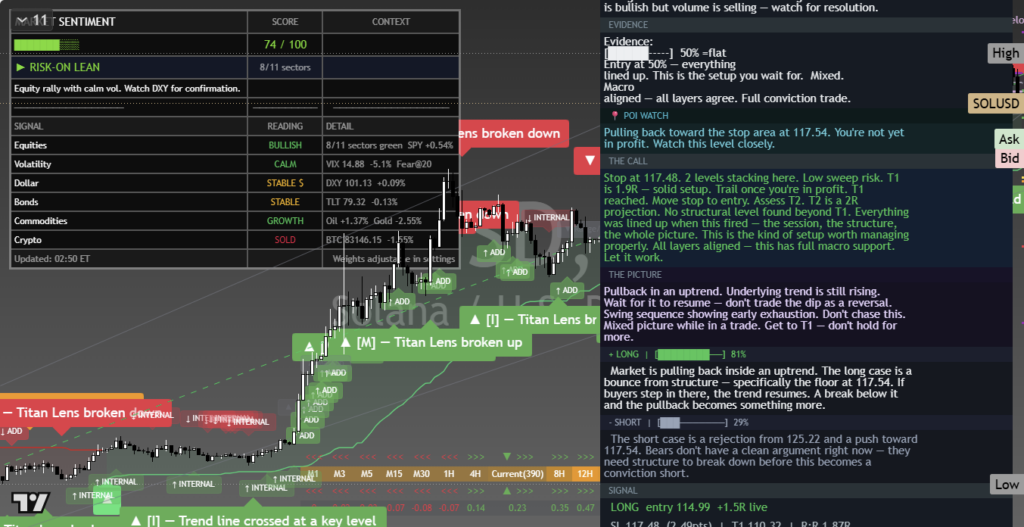
Solana is testing the upper boundary of a strong advance, with last price $121.78, 0.2 percent lower on the day, while pressing the top of its one-month range. The clear view is constructive but disciplined: buyers retain control, yet the market is close enough to resistance that fresh upside now requires confirmation rather than enthusiasm. That matters because a successful range break could extend the trend, while rejection would leave late buyers exposed after a rapid move.
The macro backdrop for crypto remains driven by liquidity expectations, broader risk appetite, and the market’s willingness to hold volatile assets. For SOL specifically, that broad environment interacts with demand for the Solana ecosystem and the tendency of capital to concentrate in liquid crypto assets when sentiment improves. Momentum is roughly 23.7 percent up over the last two weeks, showing that this is not an early move. The one month average is $108.65; price is above it, and the structure reads as a clean uptrend, with price above both its one-month and longer averages. That alignment keeps dips buyable in principle, but it also raises the importance of distinguishing consolidation from exhaustion.
The immediate handles are $122.00 and $120.00. Holding around $122.00 would show that buyers can absorb supply near the range ceiling, turning a psychological reference into a staging area. A slip through $120.00 would not destroy the trend, but it would signal that the first breakout attempt has lost force and invite a deeper reset. The month swing high is $124.53, about 2.3 percent above the current price. This is the decisive ceiling because it also marks the top of the three month range of $71.87 to $124.53. A clean break would remove the most visible overhead reference and force sellers to reassess.
The bull path is straightforward: if SOL holds $120.00, reclaims and stabilizes above $122.00, then a decisive move above $124.53 opens the path toward $126.53. The reasoning is that acceptance beyond the range high would confirm continued demand rather than a brief overshoot. The bear path begins with repeated failure beneath $124.53. If that rejection is followed by a sustained loss of $120.00, then momentum can cool toward the one month average at $108.65. Below there, attention shifts to the shelf of support at $96.26, about 21.0 percent below. That shelf matters because it separates an ordinary pullback from structural damage. Losing $96.26 exposes $71.87.
The main risk to the constructive read is a broad deterioration in crypto risk appetite just as SOL challenges major resistance. A breakout that cannot hold above $124.53 would also invalidate the immediate continuation case, especially if $122.00 and $120.00 quickly become resistance. Net, the trend remains bullish, but the trade location demands proof: strength above the range high favors continuation, while failure at the ceiling argues for patience and respect for the widening downside map.
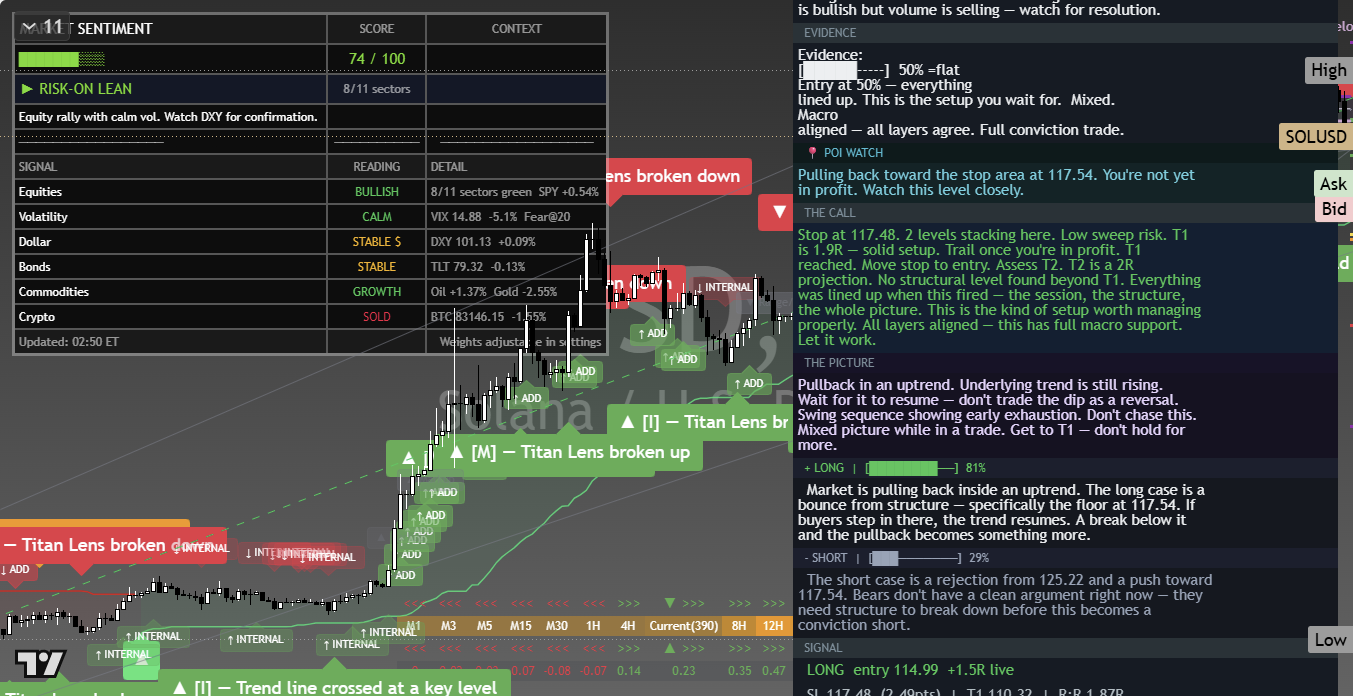
The chart above is the full daily read: structure, momentum, the levels that matter, and where the current price sits against them. Read it top to bottom for the complete picture, and pair it with our session briefs for the wider market context.
This is analysis, not financial advice. It reflects our multi-factor framework and is not a recommendation to buy or sell. Always do your own research and manage your risk.