Solana (SOL) – Daily Read
2 September 2026 | Crypto | Titan Macro Desk
$100.18
Solana is pressing higher with a constructive structure, but the immediate question is whether buyers can convert strength around the big round number into a genuine breakout. Last price $100.18, 0.1 percent higher on the day. That modest daily change understates the broader move. It is holding in the upper half of its one-month range, showing that buyers are retaining control rather than immediately taking profits. The clear view is bullish while price holds its recent base, although the market is now close enough to overhead supply that fresh upside needs confirmation.
The macro backdrop matters because crypto remains highly sensitive to global liquidity, interest-rate expectations, the dollar, and general appetite for risk. A friendlier liquidity narrative would encourage capital to move beyond the largest crypto assets and into higher-beta names such as Solana, while tighter financial conditions would make recent gains more vulnerable. For SOL specifically, the market is balancing its appeal as a liquid expression of crypto risk appetite against the possibility that a strong advance has already pulled forward near-term demand. The one month average $88.64; price is above it, and the structure reads as a clean uptrend, price above both its one-month and longer averages. Momentum roughly 14.6 percent up over the last two weeks. That combination says buyers have been rewarded for defending weakness, but it also raises the bar for continuation.
The first battle is around the nearer round number handles at $102.00 and $100.00. Holding $100.00 keeps the market psychologically anchored in triple digits and suggests buyers are prepared to defend the breakout area. Acceptance above $102.00 would show that supply immediately over the market is being absorbed. The month swing high $109.79, about 9.6 percent above the current price, is the decisive ceiling because it marks the point where the latest advance previously stopped. A decisive move above $109.79 opens the path toward $111.79, with the former high then expected to become support. Below, a shelf of support at $72.47, about 27.7 percent below, represents the deeper structural defense. The three month range $62.39 to $109.79 defines the broader field, so losing $72.47 exposes $62.39 and would signal that the uptrend has failed rather than merely paused.
The bull path is straightforward: if SOL holds $100.00, clears $102.00, and continues attracting demand on shallow pullbacks, then a retest of $109.79 becomes the base case. If that ceiling breaks decisively, then $111.79 is the next destination and the market can begin building value above the prior range. The bear path begins if repeated failures above $102.00 force price back through $100.00. If that loss leads to sustained selling and the one month average $88.64 no longer attracts buyers, then the move becomes a broader retracement. If $72.47 subsequently fails, then $62.39 comes into play.
The main risk is a macro reversal that drains liquidity from crypto just as SOL challenges resistance. The bullish read is invalidated by sustained trade below $72.47, while failure to clear $109.79 would leave the market range-bound rather than outright bearish. Net, SOL remains constructive and buyers retain the advantage, but the next high-quality signal comes from acceptance above resistance, not simply proximity to it.
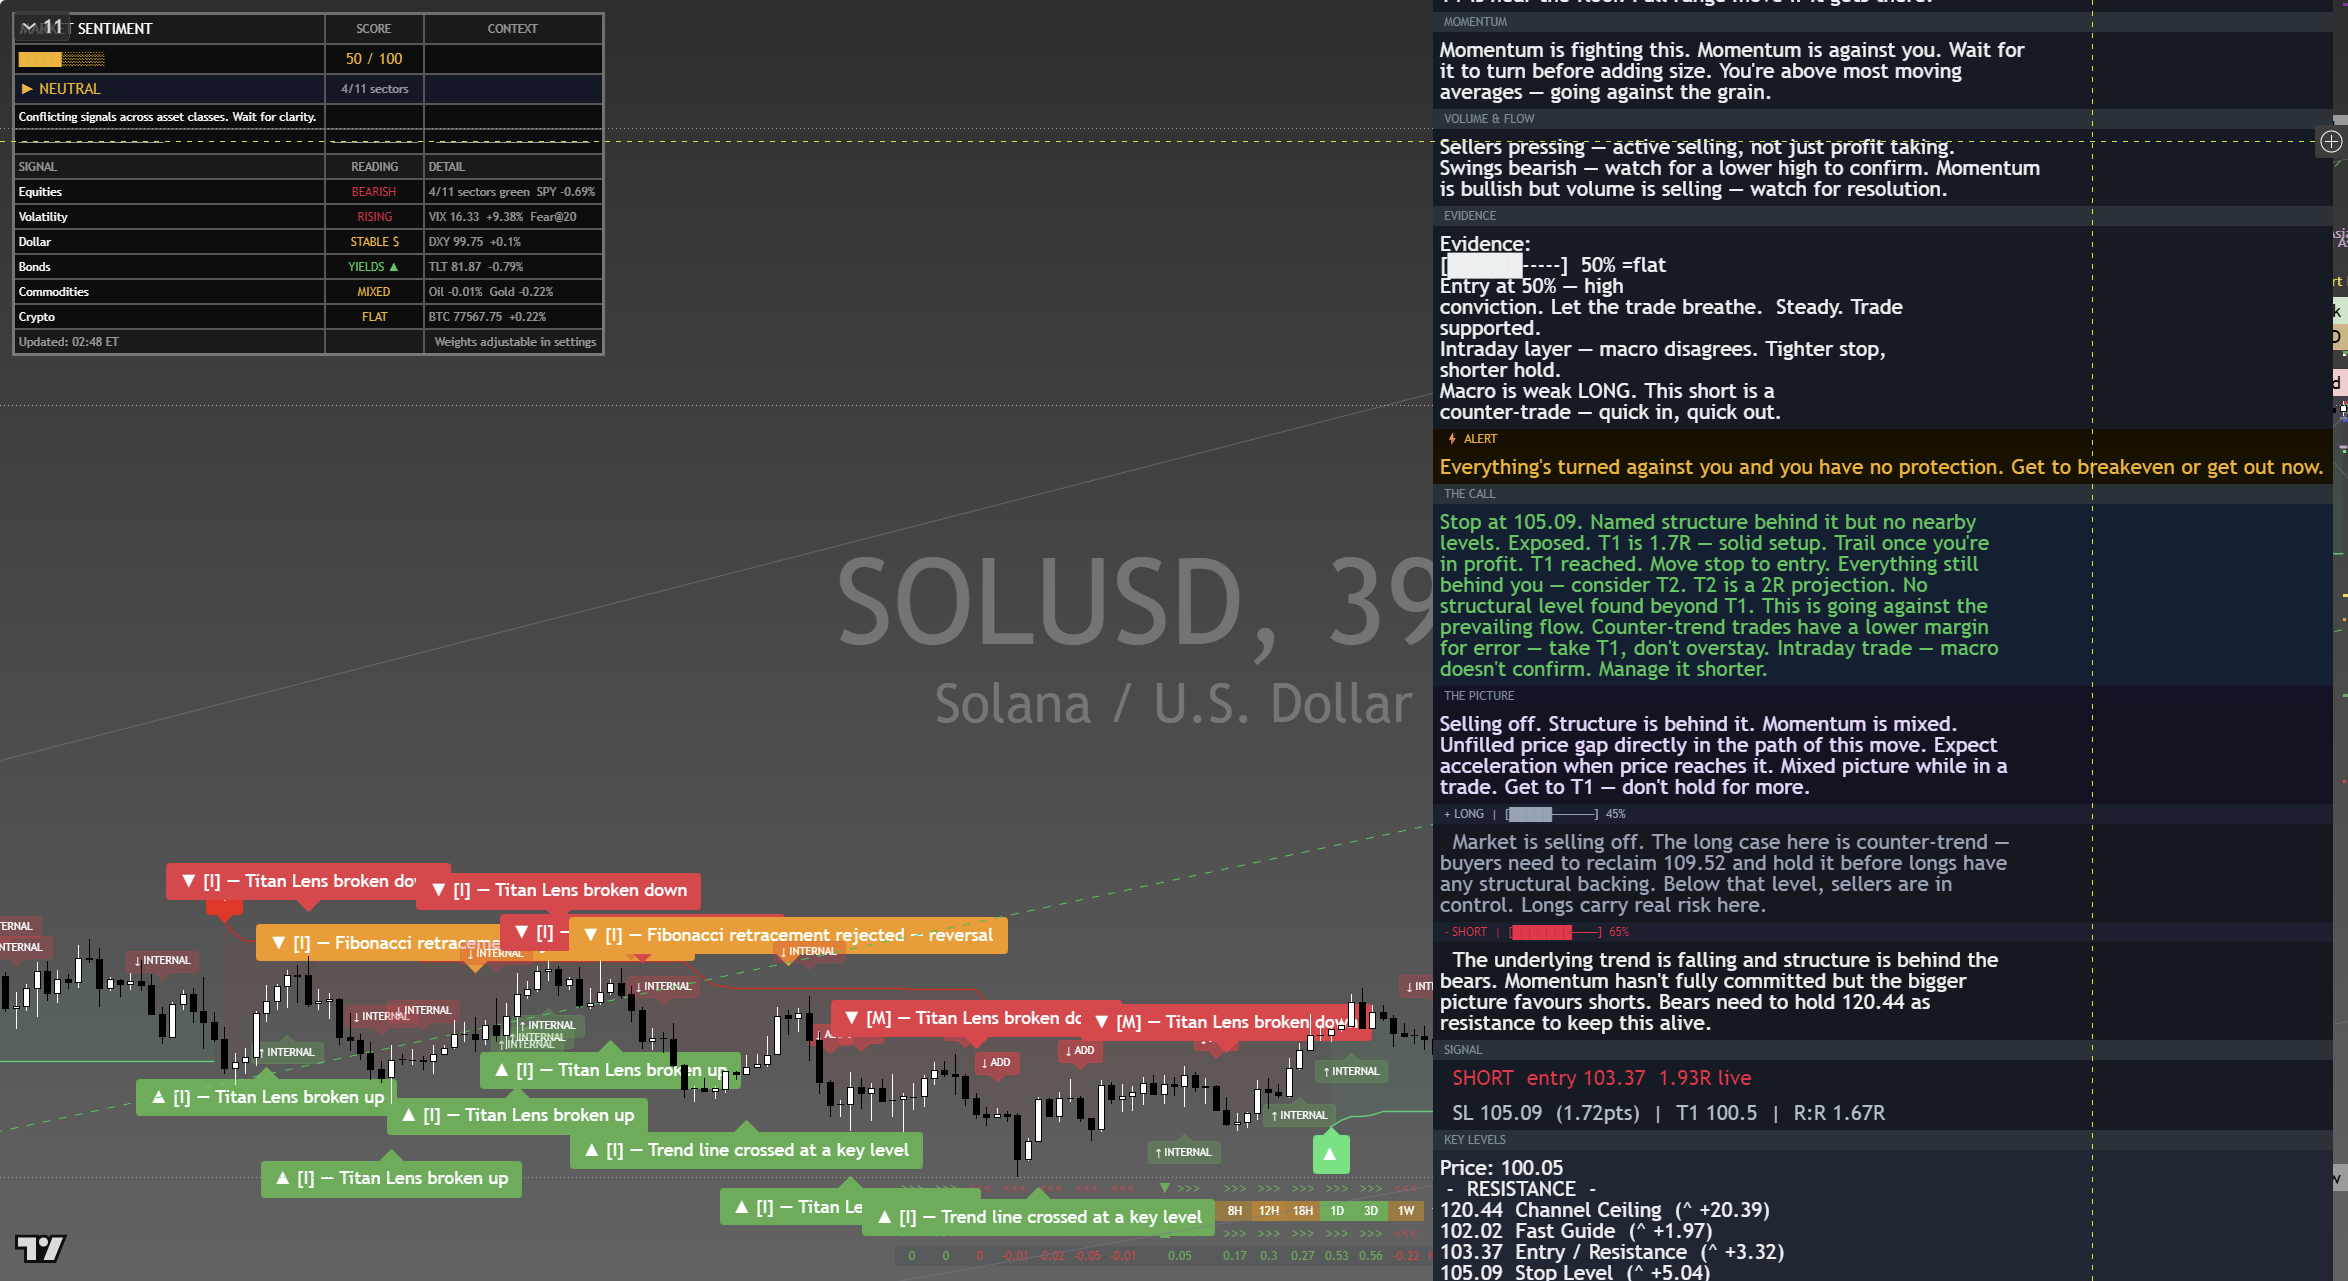
The chart above is the full daily read: structure, momentum, the levels that matter, and where the current price sits against them. Read it top to bottom for the complete picture, and pair it with our session briefs for the wider market context.
This is analysis, not financial advice. It reflects our multi-factor framework and is not a recommendation to buy or sell. Always do your own research and manage your risk.