Russell 2000 (RTY) – Daily Read
1 October 2026 | Index | Titan Macro Desk
2,796.9
Russell 2000 (RTY) is testing a consequential support zone while its underlying structure remains weak. Last price 2,797, 0.4 percent lower on the day. It is down near the floor of its one-month range, so the immediate question is whether sellers can force a breakdown or whether compressed positioning near support produces a tradable rebound. The clear view is cautious: proximity to support can slow the decline, but buyers have not yet done enough to reverse control. That matters because small-cap equities often provide a sharper read on domestic risk appetite and financing conditions than larger, more internationally diversified companies.
The macro backdrop matters through interest-rate expectations, credit availability, liquidity, and confidence in domestic growth. Smaller companies tend to be more sensitive to borrowing costs and refinancing risk, while their earnings often depend more heavily on the local economic cycle. That makes RTY vulnerable when markets demand stronger balance sheets and dependable cash flow. Conversely, any easing in financial conditions or improvement in growth expectations can produce an aggressive rotation into the asset class. For now, momentum roughly 2.2 percent down over the last two weeks confirms that sellers have retained pressure rather than merely delivering a single weak session.
The one month average 2,864 sits above price, and the structure reads as a downtrend, price under both its one-month and longer averages. That area matters because a recovery through it would show that buyers are beginning to absorb supply rather than simply defending the lows. The month swing high 2,977, about 6.4 percent above the current price, is the more important upside boundary because it marks where the present bearish structure would face a genuine challenge. Immediately below, a shelf of support at 2,794, about 0.1 percent below, is being defended by buyers responding to the edge of the recent range. The nearer round number handles at 2,800 and 2,750 frame sentiment and execution: the former is the current battleground, while the latter is the next natural downside reference. The three month range 2,794 to 3,070 shows that price is pressing the lowest boundary of a broader balance.
The bull path is straightforward. If 2,794 holds and RTY reclaims 2,800 with sustained buying, then a move back toward 2,864 becomes credible. If buyers can then convert that recovery into a decisive move above 2,977, it opens the path toward 3,070, with the breakout signaling that demand has overcome the supply defining the recent decline. The bear path is equally clear. If repeated attempts to recover 2,800 fail and selling pressure loses 2,794, that exposes 2,750. Such a break would matter because it would move price beneath the three month floor and confirm that support was temporary rather than durable.
The main risk to the cautious read is a rapid improvement in the macro tone that pulls capital back toward economically sensitive shares and forces sellers to cover. A sustained recovery above 2,864 would weaken the bearish case, while acceptance above 2,977 would invalidate it. Conversely, a clean loss of 2,794 would remove the immediate defense. Net, RTY is vulnerable but sitting at support, so confirmation matters: respect the floor while it holds, but keep the bias defensive until price proves it can reclaim lost ground.
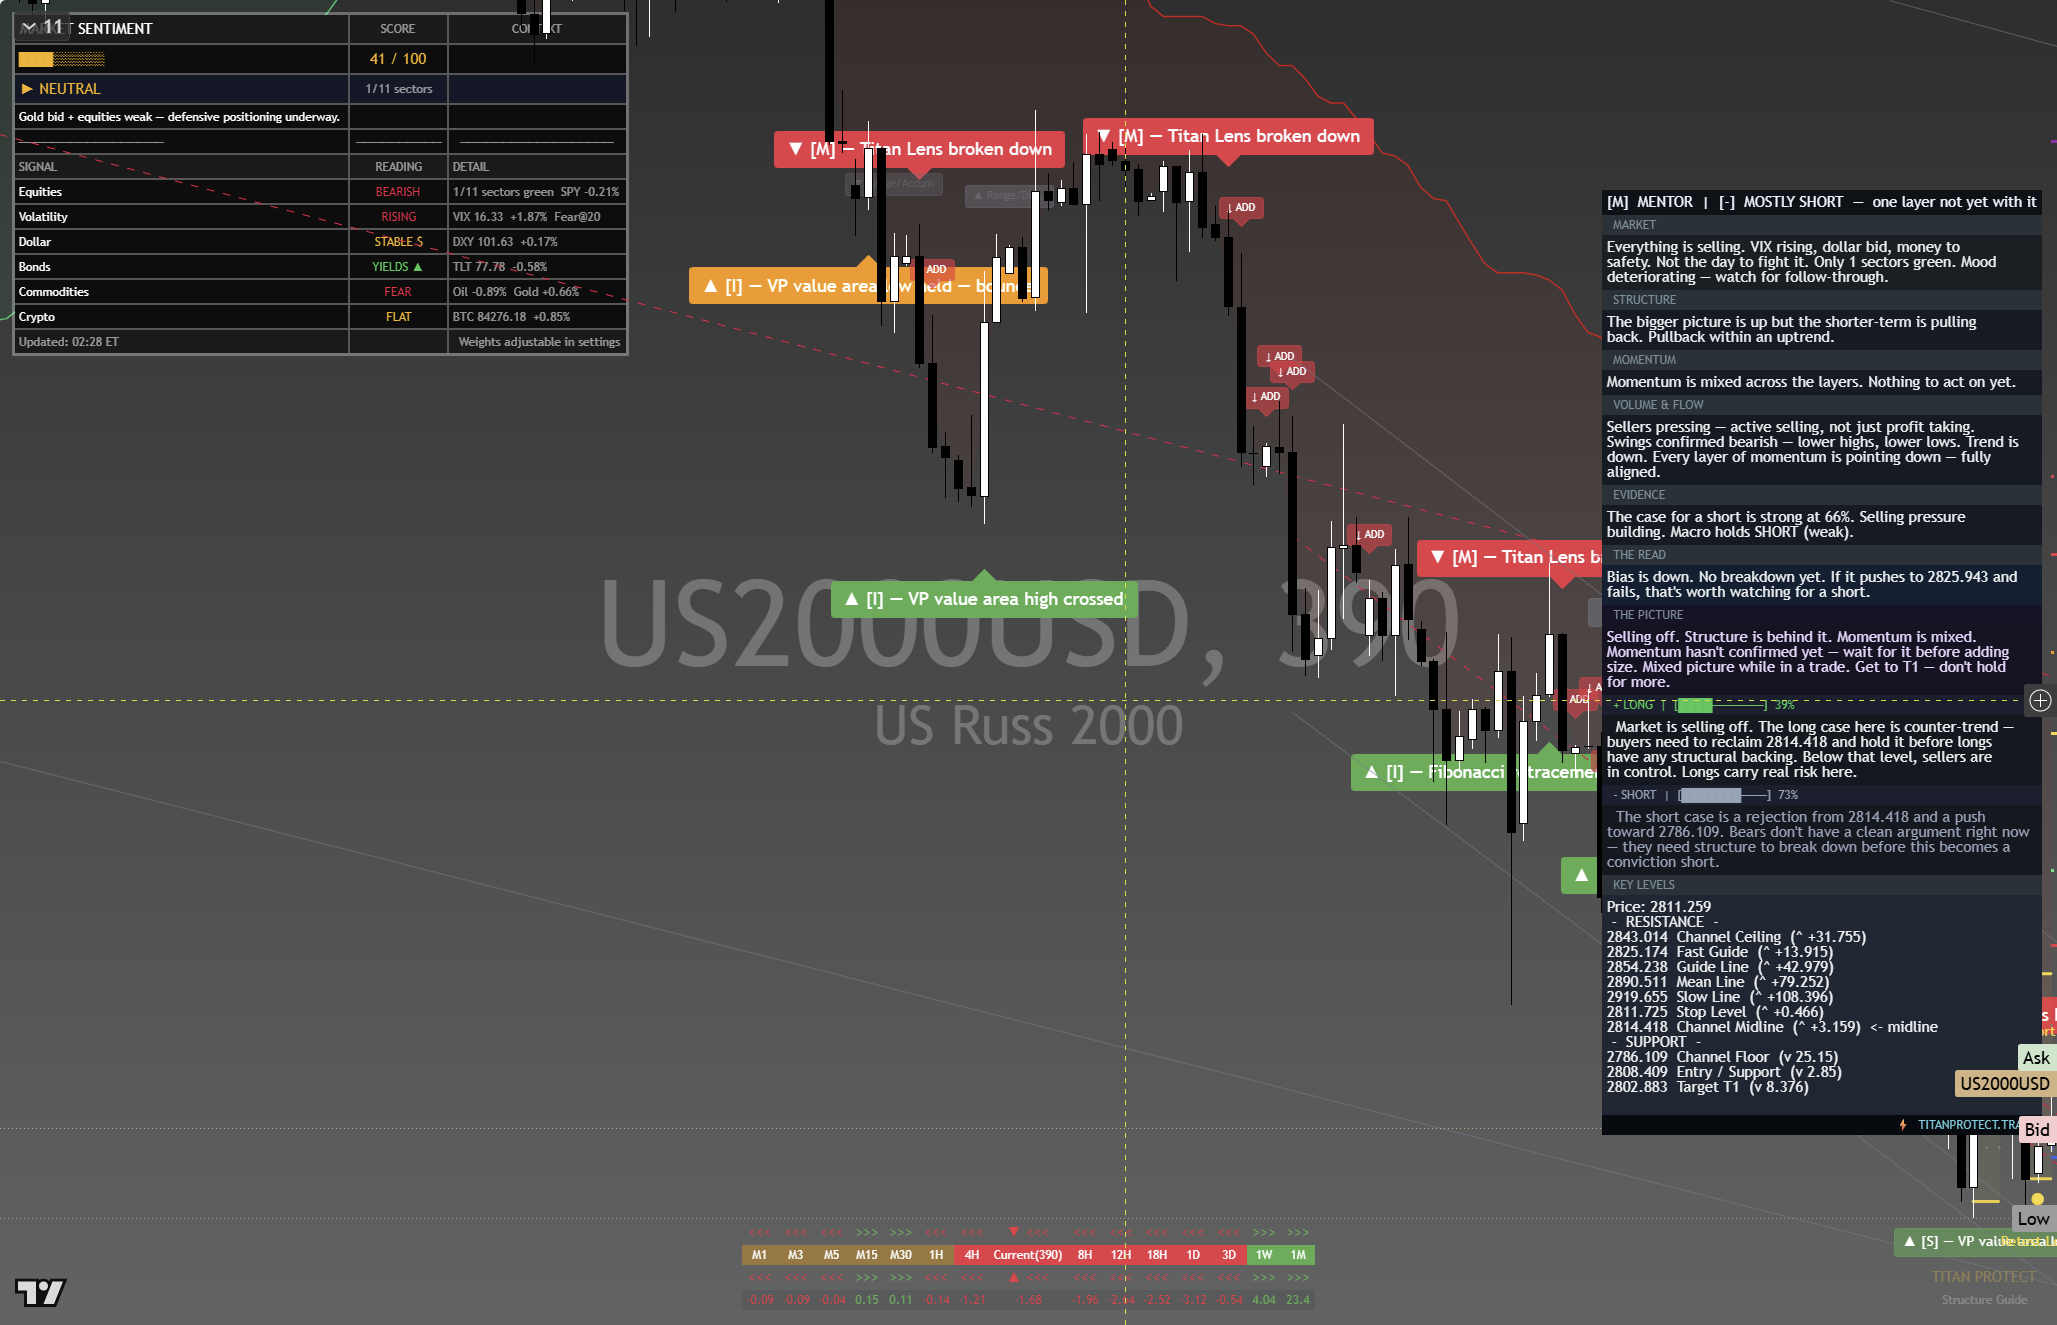
The chart above is the full daily read: structure, momentum, the levels that matter, and where the current price sits against them. Read it top to bottom for the complete picture, and pair it with our session briefs for the wider market context.
This is analysis, not financial advice. It reflects our multi-factor framework and is not a recommendation to buy or sell. Always do your own research and manage your risk.