Russell 2000 (RTY) – Daily Read
17 September 2026 | Index | Titan Macro Desk
2,858.8
Russell 2000 is pinned near the bottom of its recent range, and the message is defensive rather than neutral. Last price is 2,859, 0.0 percent higher on the day, but that flat performance masks a market still struggling to attract durable demand. It is down near the floor of its one-month range, while the broader structure reads as a downtrend. Small caps need a credible improvement in domestic growth expectations, financing conditions, or risk appetite to regain leadership. Until that arrives, rallies are more likely to meet supply than develop into sustained advances.
The macro backdrop matters especially for this index because smaller companies are more exposed to domestic demand and refinancing pressure than their larger peers. Uncertainty around growth and the path of borrowing costs therefore carries disproportionate weight. The one month average is 2,937; price is below it, and price also remains under its longer averages. That confirms that sellers still control the medium-term structure. The market has fallen roughly 3.9 percent down over the last two weeks, showing that recent pressure is persistent rather than the result of a single weak session.
The immediate battle is around the nearer round number handles at 2,900 and 2,850. The 2,850 area is being defended because it sits close to current price and just above the more important range floor. Holding it can encourage short covering and tactical buying, but reclaiming 2,900 is necessary to show that demand is becoming more assertive. Above there, the one month average at 2,937 is the next structural test. A sustained recovery through it would weaken the downtrend and shift attention toward the month swing high at 3,020, about 5.6 percent above the current price.
On the downside, a shelf of support sits at 2,832, about 0.9 percent below. This level matters because it is also the lower boundary of the three month range of 2,832 to 3,070. Buyers defending it are protecting the entire established range, not merely an intraday foothold. Losing 2,832 exposes 2,800 and would signal that the range has resolved lower. Conversely, a decisive move above 3,020 opens the path toward 3,070, where the upper boundary would test whether a recovery can become a broader breakout.
The bull path is straightforward: if 2,850 holds, then a recovery through 2,900 can challenge 2,937; if that level is accepted, then pressure can build toward 3,020, and a decisive move above 3,020 opens the path toward 3,070. The bear path begins if rebounds fail beneath 2,900 and price returns to 2,832. If that shelf breaks decisively, then 2,800 becomes exposed as sellers press the range breakdown.
The main risk to the bearish read is a rapid improvement in growth confidence or financing expectations that pulls small caps back above 2,937 and sustains demand. The bullish case is invalidated by losing 2,832. Net, the index remains vulnerable near support, with tactical rebound potential but no convincing structural turn until buyers reclaim the levels overhead.
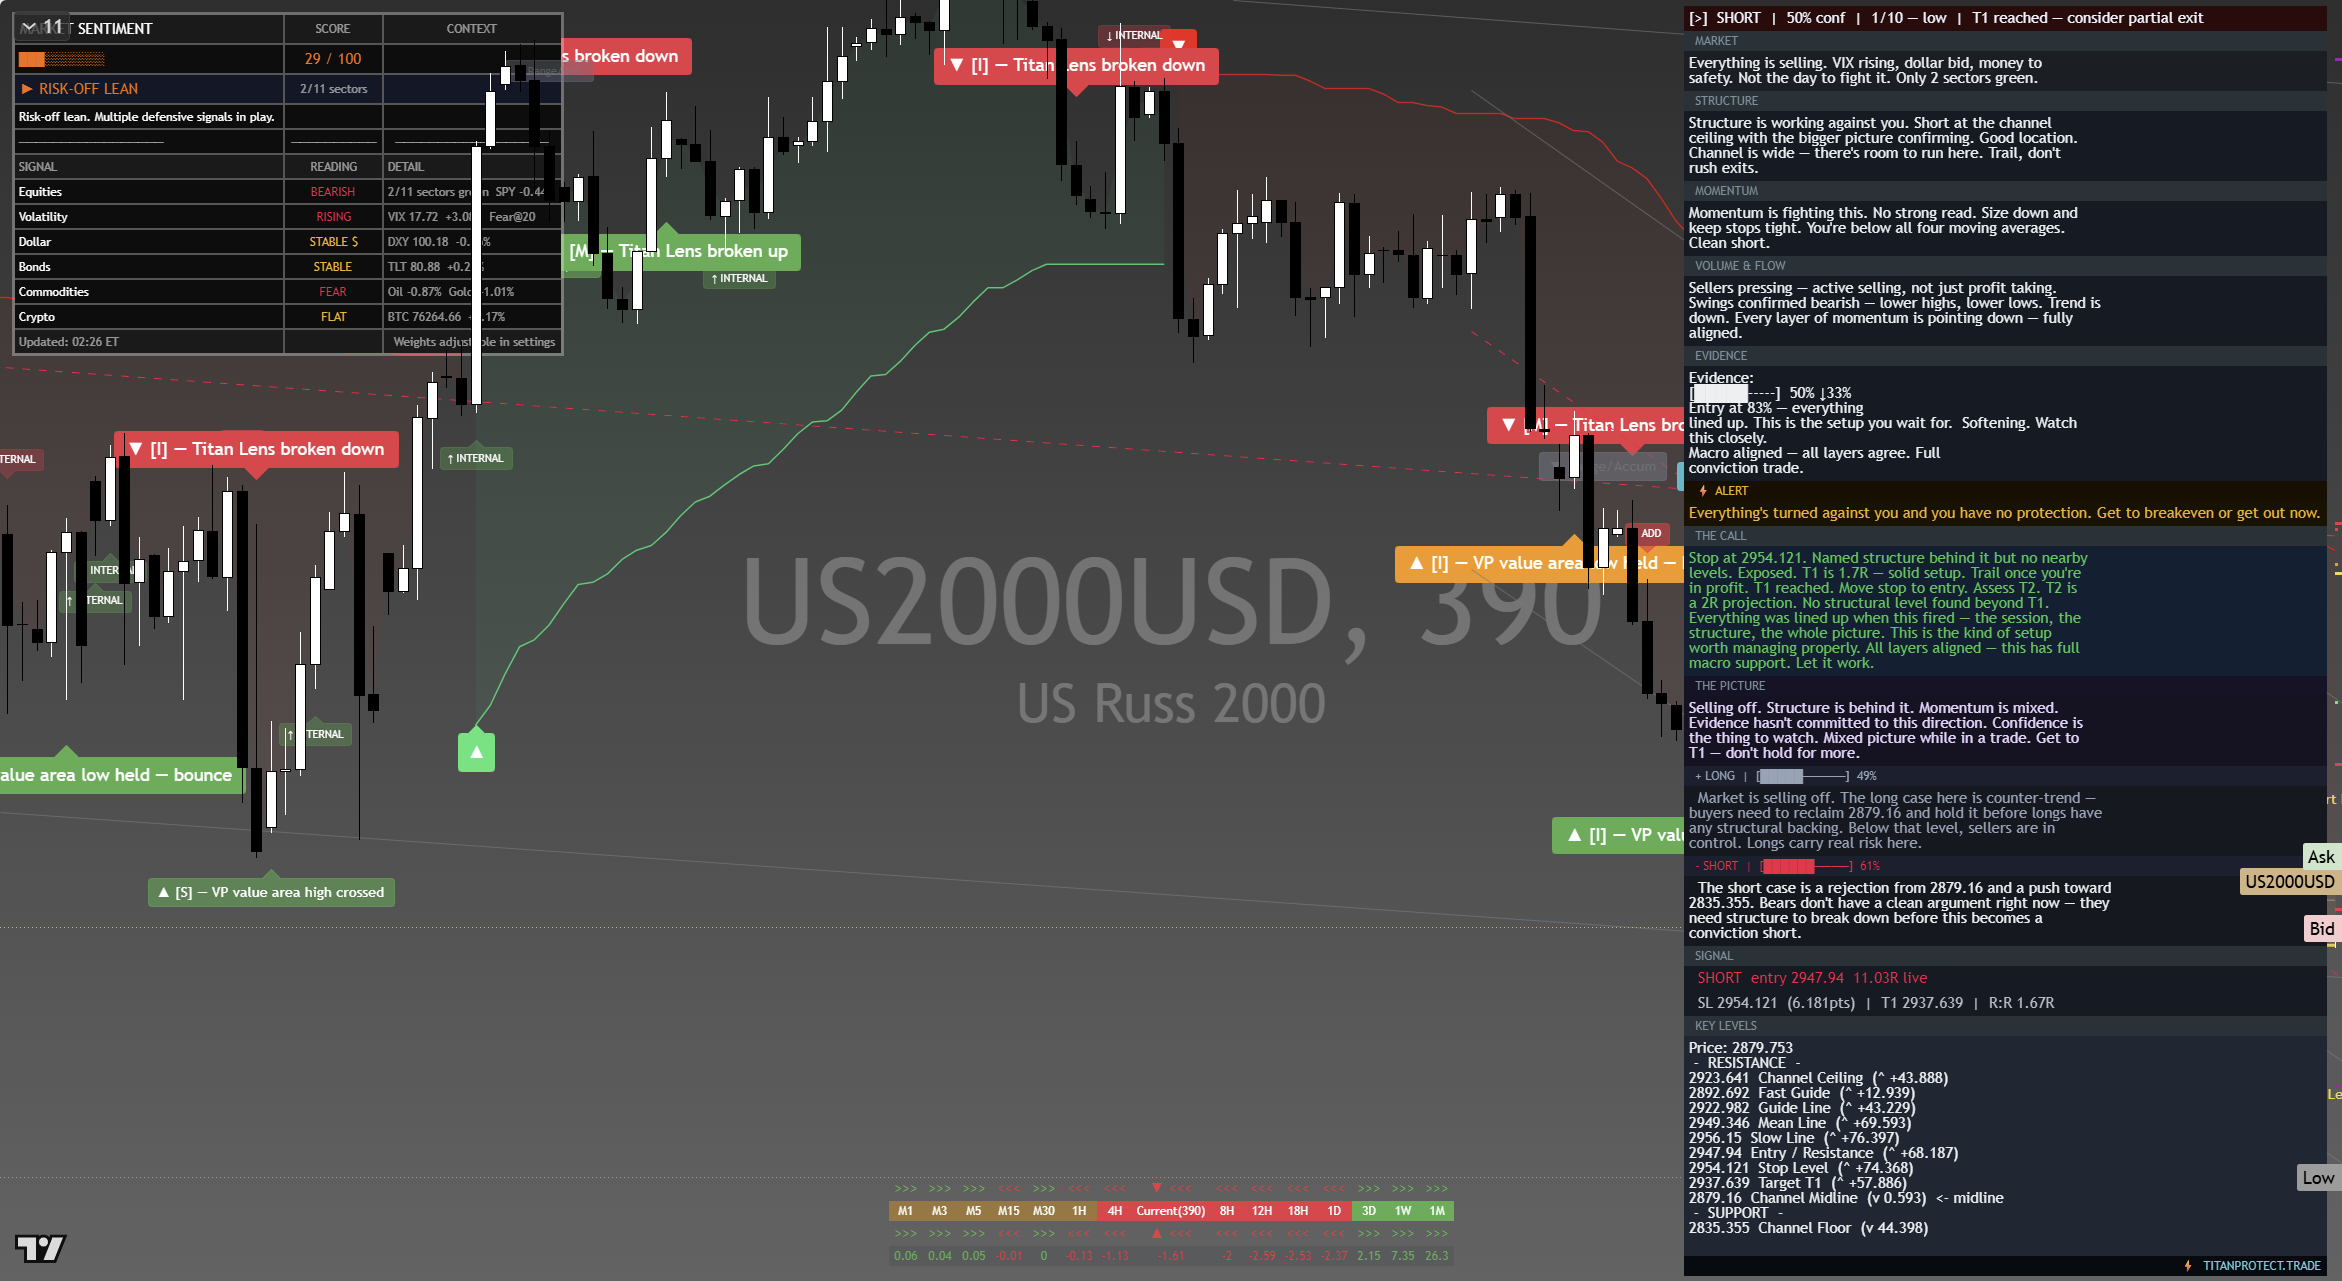
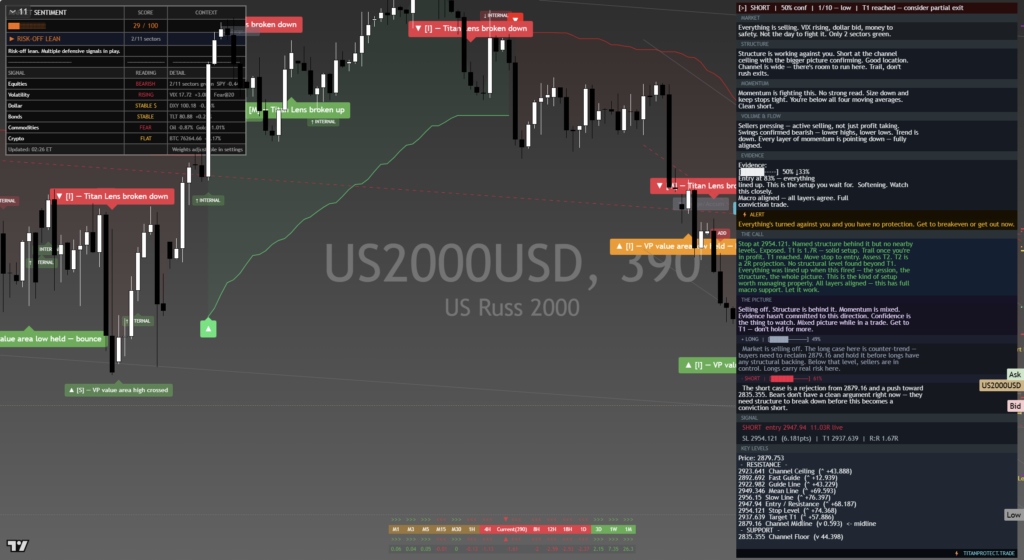
The chart above is the full daily read: structure, momentum, the levels that matter, and where the current price sits against them. Read it top to bottom for the complete picture, and pair it with our session briefs for the wider market context.
This is analysis, not financial advice. It reflects our multi-factor framework and is not a recommendation to buy or sell. Always do your own research and manage your risk.