Russell 2000 (RTY) – Daily Read
16 September 2026 | Index | Titan Macro Desk
2,870.3
Russell 2000 (RTY) is testing the lower edge of its recent structure, and the balance of evidence still favors caution. Last price 2,870, 0.0 percent higher on the day. That unchanged tone masks a market sitting close to an important decision point. It is down near the floor of its one-month range, with sellers retaining control unless price can reclaim the ground lost during the latest downswing. The clear view is that downside pressure remains dominant, but nearby support makes chasing weakness unattractive before the market confirms a break.
The macro backdrop matters particularly for small caps because they are more sensitive than larger companies to financing conditions, domestic demand, and shifts in risk appetite. Uncertainty around growth, inflation, and the policy outlook can therefore produce a sharper response in RTY than in indices dominated by cash-rich global businesses. The instrument-specific picture reflects that pressure. The one month average is 2,945; price is below it, and the structure reads as a downtrend, price under both its one-month and longer averages. Momentum is roughly 3.5 percent down over the last two weeks. This suggests recent weakness is persistent rather than a single-session dislocation, while the lack of a meaningful daily rebound shows buyers have not yet demonstrated urgency.
The month swing high is 3,020, about 5.2 percent above the current price. That level matters because it marks the point from which supply last overwhelmed demand, so clearing it would show that buyers have absorbed the available selling. Before then, the nearer round number handle at 2,900 is the first recovery test. Holding above it would help stabilize sentiment and make a return toward the monthly average more credible. Below the market, a shelf of support at 2,862, about 0.3 percent below, is the immediate defense. It also forms the bottom of the three month range 2,862 to 3,070, giving it significance beyond the current downswing. The other nearer round number handle at 2,850 is the next area where buyers may attempt to restore balance if that shelf fails.
The bull path is straightforward: if buyers defend the range floor, recover 2,900, and establish acceptance above the monthly average, then the downtrend begins to lose authority and the market can challenge the prior swing high. A decisive move above 3,020 opens the path toward 3,070, because that would remove the clearest recent supply barrier and return price toward the opposite edge of the broader range.
The bear path is equally clear: if rebounds continue to fail below the monthly average and selling presses through the range floor, then recent weakness is being confirmed rather than exhausted. Losing 2,862 exposes 2,850. Failure there would imply that the established range is no longer containing risk and that sellers remain willing to transact at progressively lower prices.
The main risk to the bearish read is a forceful recovery that holds above the monthly average and then clears the swing high. Conversely, a brief dip below support followed by an immediate recovery would warn against treating the first break as decisive. Net, RTY remains vulnerable while below its key recovery zones, but the proximity of major support makes confirmation essential.
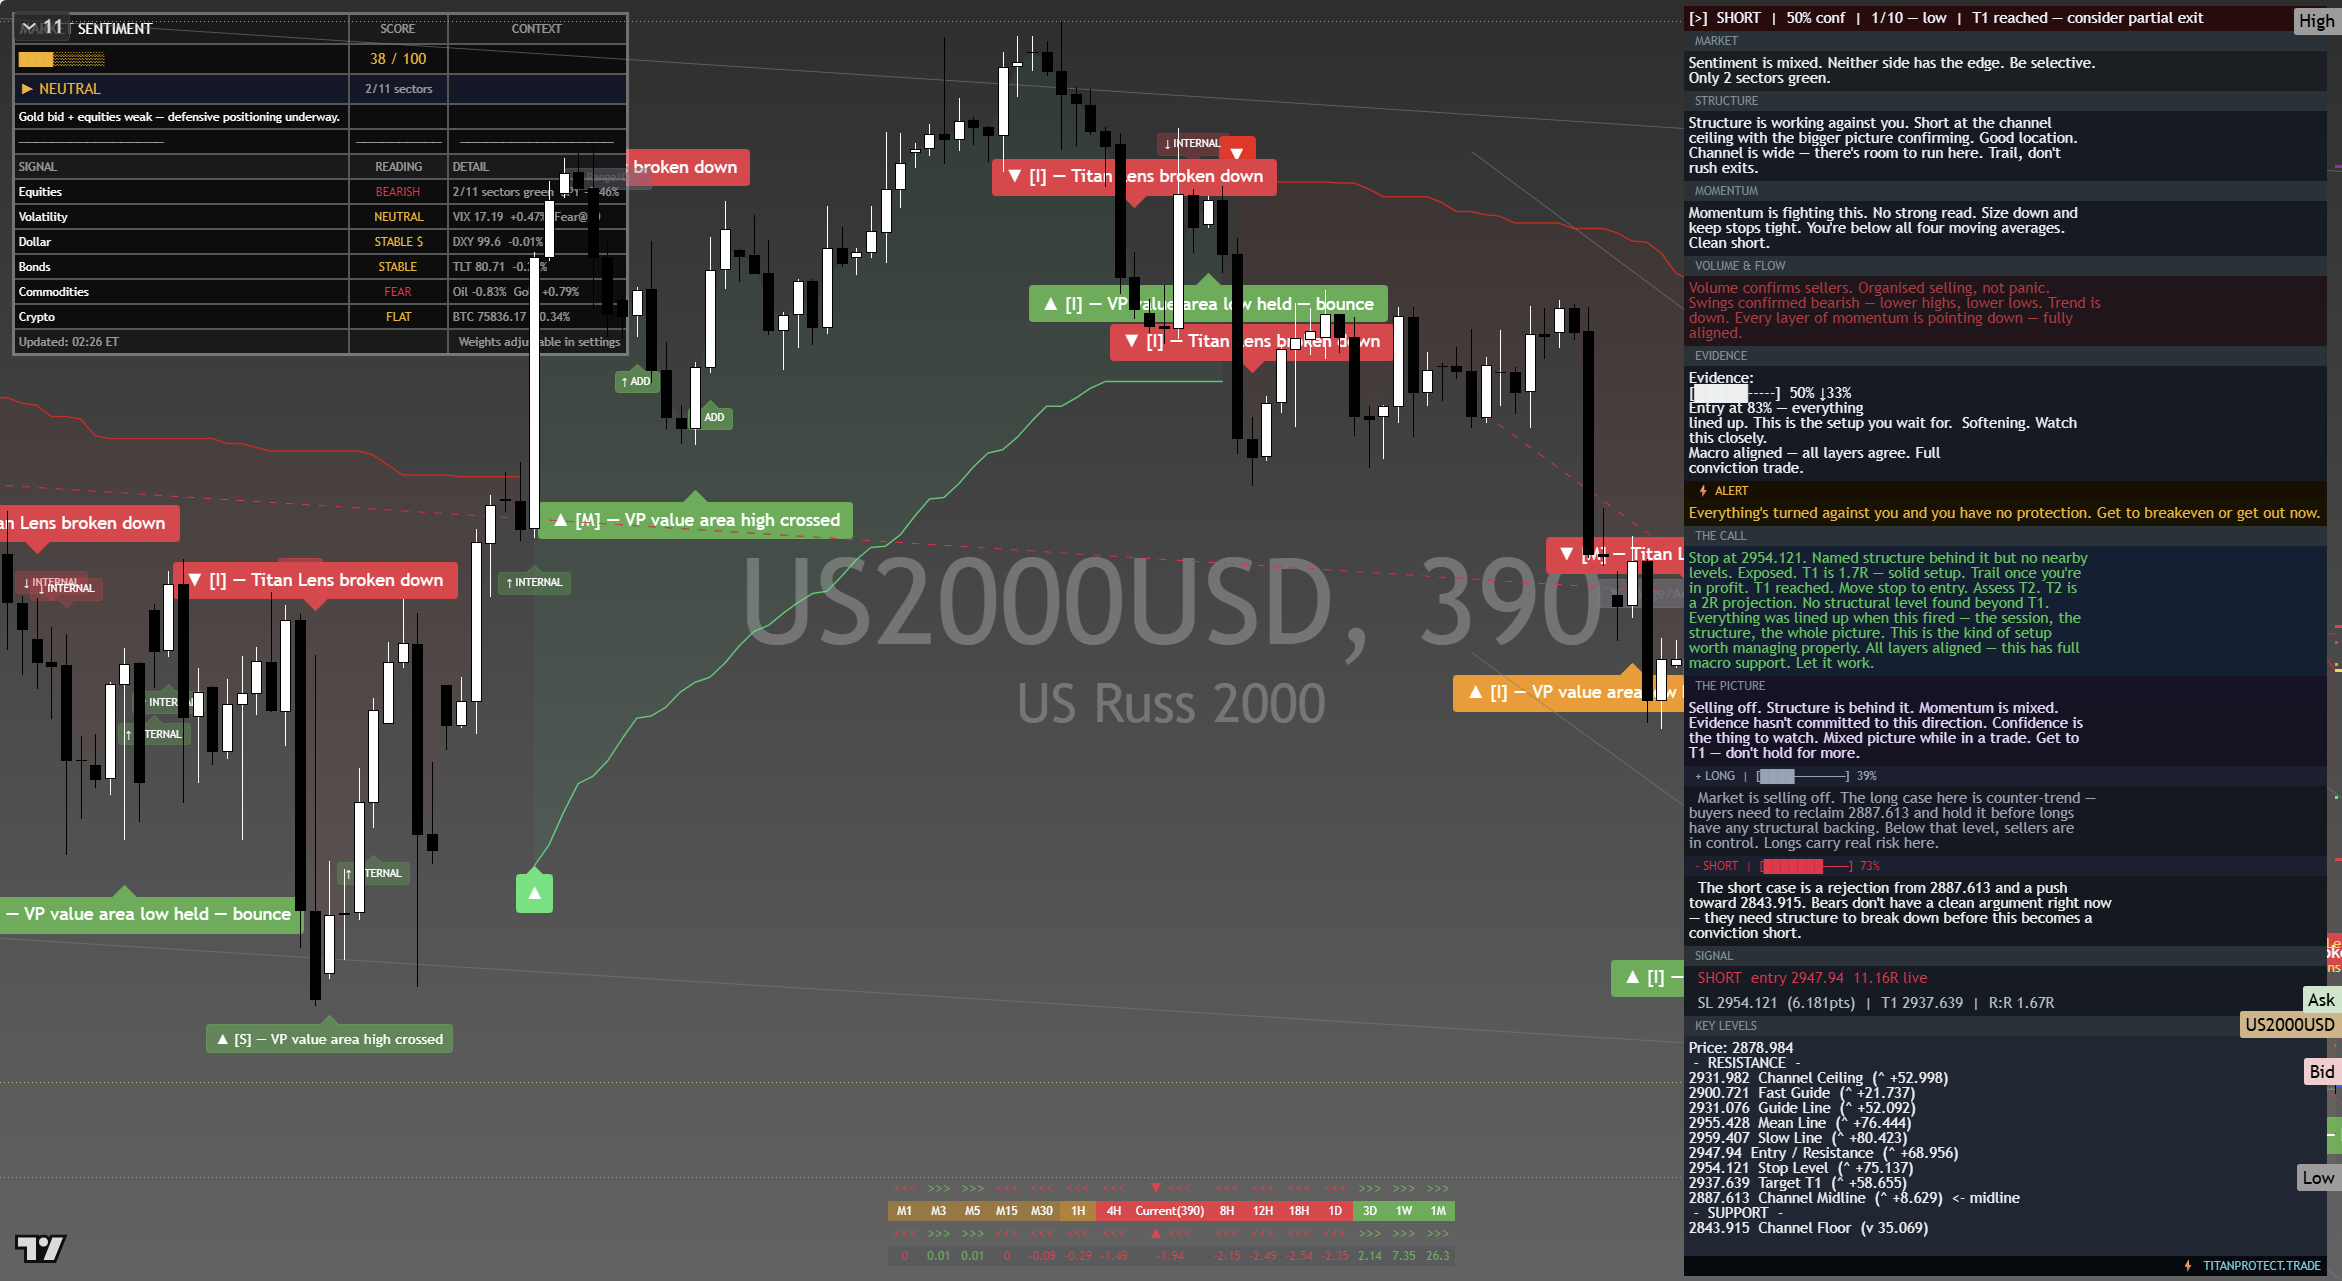
The chart above is the full daily read: structure, momentum, the levels that matter, and where the current price sits against them. Read it top to bottom for the complete picture, and pair it with our session briefs for the wider market context.
This is analysis, not financial advice. It reflects our multi-factor framework and is not a recommendation to buy or sell. Always do your own research and manage your risk.