A candle wick is a message. The body tells you where price opened and closed. The wick tells you where price tried to go and failed. That failure carries information about who was active at that level and whether they had conviction. Learning to read wicks is learning to read intent.
Most traders glance at wicks and move on. The ones who pay attention use them to identify rejection zones, exhaustion moves, and liquidity grabs that often precede sharp reversals.
What Wicks Actually Represent
Every wick represents a period where price moved in one direction, encountered opposing pressure, and reversed before the candle closed. A long upper wick means buyers pushed price higher, sellers stepped in forcefully, and price retreated. A long lower wick means sellers drove price down, buyers absorbed the selling, and price recovered.
The key word is absorbed. A lower wick on a bullish candle means demand was strong enough to not only halt the selling but reverse it entirely within the same time period. That is institutional demand in action. Large buyers do not broadcast their intentions, but they do leave footprints in the form of wicks.
Rejection vs Exhaustion Wicks
Not all long wicks are created equal. Context determines whether a wick signals rejection (the move is reversing) or exhaustion (the move is running out of steam but has not reversed yet).
A rejection wick appears at a key level — a prior high, a round number, a daily open. Price spikes into that level, the wick forms, and subsequent candles move away from it with momentum. The level rejected price. This is a tradeable signal.
An exhaustion wick appears after an extended trending move. Price has been rallying for three days. A candle prints with a very long upper wick but the body is still up on the session. This is not necessarily a reversal — it may just be momentum tiring. Confirmation from the next candle or two is needed before treating it as a reversal signal.
Wick-to-Body Ratios
A wick that is twice the length of the body is notable. A wick that is three times the body length is significant. The larger the ratio, the stronger the rejection signal at that level. A candle where the wick is five times the body, sitting at a key technical level, is telling you that buyers or sellers were extremely active there.
A single wick is interesting. Two consecutive wicks at the same level with similar structure is confirmation. The level has been tested and rejected more than once, which means it is not random noise — there is genuine supply or demand concentrated there.
Liquidity Grabs: The Stop Hunt
A liquidity grab is a specific wick pattern. Price spikes below a well-known level — a prior low, a round number, the session low — takes out the stops of traders who placed them there, and then reverses sharply back above the level. The wick is the trace of the stop hunt.
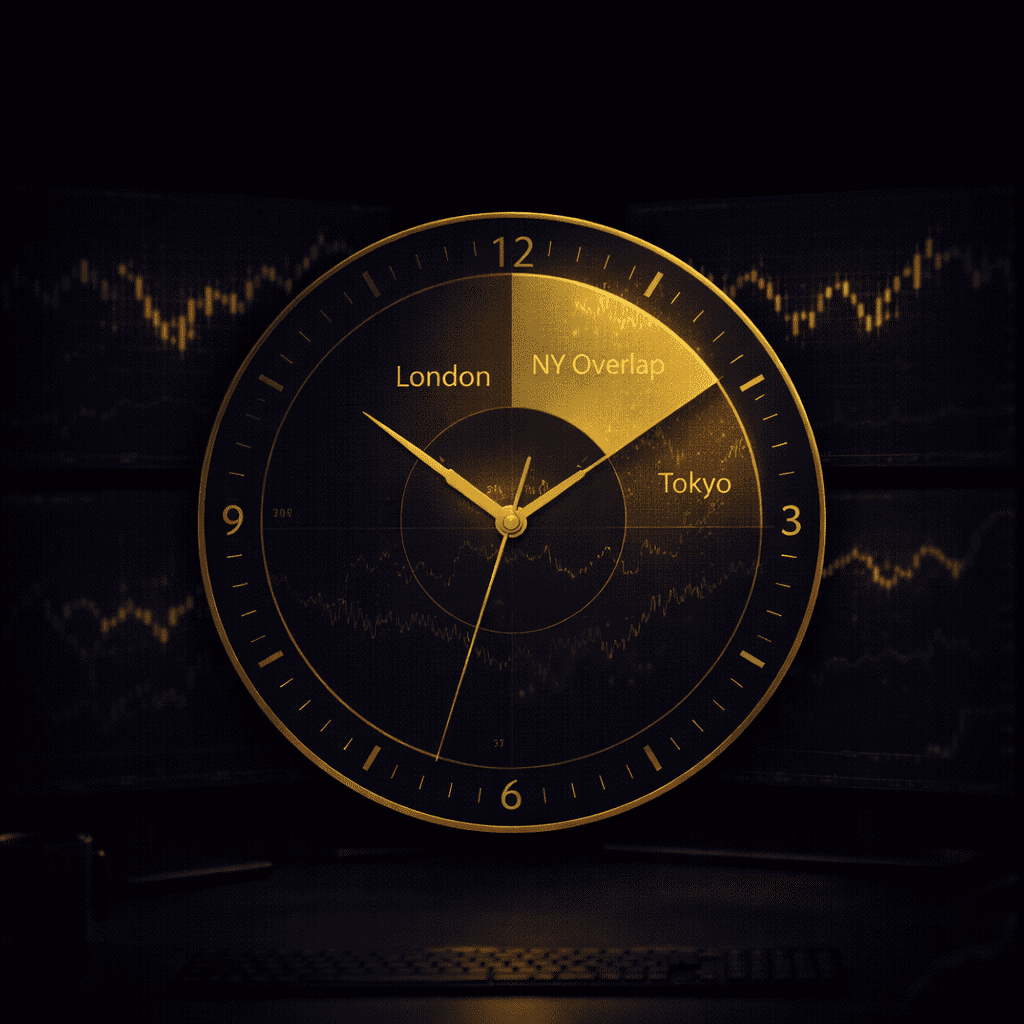
This pattern is particularly common around the London and New York session opens, when volume surges and algos know exactly where retail stops are clustered. The wick down into obvious stop territory, followed by a quick recovery, is often the start of the actual directional move. The spike shook out the weak longs and created fuel for the next leg up.
Key Takeaways
- Wicks show where price tried to go and failed. The failure is the signal.
- Long lower wicks at support indicate buyers absorbed selling pressure — potential long setup.
- Long upper wicks at resistance indicate sellers rejected the advance — potential short setup.
- Distinguish between rejection wicks (at levels) and exhaustion wicks (mid-trend). Context determines interpretation.
- Wick-to-body ratios matter. Larger ratios signal stronger conviction at the rejection level.
- Liquidity grabs — spikes beyond obvious levels that quickly reverse — often precede the real directional move.
Get the daily framework intelligence
Trade the framework, not the noise.
The principles in this article are how we read markets every day. Members get the live application: daily Pre-Asia, Pre-London, Pre-NY and Post-Close briefs across 20+ instruments, the indicator suite, the Foundry library, and live community.
Free Explorer tier · No card required · Upgrade when you’re ready